Financial Analysis Report: A Comparative Study of J&J and PFIZER
VerifiedAdded on 2020/06/04
|14
|3584
|55
Report
AI Summary
This report provides a financial analysis of two major pharmaceutical companies, Johnson & Johnson (J&J) and PFIZER. It begins with an introduction outlining the importance of financial analysis for evaluating a company's performance, viability, profitability, and stability. The report examines the mission statements and positions of both companies, followed by a review of their balance sheets, income statements, and key financial ratios. The analysis includes calculations and comparisons of working capital, current ratio, quick ratio, debt-equity ratio, return on equity, cash flow to debt, interest coverage ratio, and debt service coverage ratio. The report highlights the strengths and weaknesses of each company based on their financial data, offering insights into their liquidity, asset utilization, and ability to manage debt. The report concludes by summarizing the comparative financial positions of J&J and PFIZER, providing a comprehensive overview of their financial health and performance.
Financial analysis for a
company
company
Paraphrase This Document
Need a fresh take? Get an instant paraphrase of this document with our AI Paraphraser
Table of Contents
INTRODUCTION...........................................................................................................................1
Mission statement:......................................................................................................................1
Position of the company: ...........................................................................................................1
Balance sheet review...................................................................................................................3
Income statements review...........................................................................................................8
CONCLUSION..............................................................................................................................10
REFERENCES..............................................................................................................................10
INTRODUCTION
Financial analysis is an important tool use by the company in order to make proper
evaluation of company financial position. It will help to make an idea for investors to invest
capital into their operation. It includes assessment of viability, profitability and stability of the
business (Vogel,2014). Under this project report two of the most largest company
Johnson&Johnson and PFIZER those are related in manufacturing of pharmaceutical products.
As PFIZER is a public limited company which is related in producer of medical products and it
situated in New york in 1849, their major products Atorvastatin, prevnar, Norvasc etc. While J&J
is public limited company founded in 1886 US and their major products are baby care and skin
and hair care products. The main aim of this project is to analyse the financial position of both
company with income statements, balance sheet and cash flow statements of the companies.
Mission statement:
Johnson and Johnson company: They are clench research and science to bring advanced ideas,
products and services to boost people health and well being.
PFIZER: It main aims is to innovate to bring therapies to patients that importantly better their
lives.
Financial analysis: It refer to be the process of evaluation of project and business through budget
and other finance related aspects should be use to determine their stability and growth. The major
things considered under this various statements like income statements, balance sheet and cash
flow statements.
Position of the company:
As for PFIZER the balance of the company equity and liability are use to compare their position
that it is healthy because equity are more than liabilities (Healy and Palepu, 2012). With the
earning capacity of almost 80,000 million. While J&J is bit more higher healthy position as
compare to PFIZER because the are generating a net earning of more than 1,41,208 million and
has less number of liabilities on it which make them positive enough from other competitor.
Competitor of J&J and PFIZER:
The major competitor of PFIZER is Glaxo Smith kline and Eli Lilly and company those are
prove to beat PFIZER from their products.
While competitor of Johnson and Johnson are PFIZER, Merck and Novartis.
1
⊘ This is a preview!⊘
Do you want full access?
Subscribe today to unlock all pages.
Trusted by 1+ million students worldwide
SWOT of J&J:
Strengths:
Largest Healthcare provider: As J&J involve in producing consumer healthcare goods
most for baby care products (Higgins, 2012). It includes pharmaceutical and medical
diagnostic segment those are use for people.
Large brand portfolio: It has good presence within every products ranges. They captured
most number of areas in order to make their brand more reachable to every people.
Weaknesses:
Litigation: In 2010 J&J has been sued by their shareholder because use of the red cross
symbols.
Dependences upon the success of set up products: Those brand new product which are
uncertain from regulatory reviews are said to be vulnerable for the company.
Opportunity:
Huge range of potential cross-selling chance: It is done with using through providing
balance among pharmaceutical and medical devices that would help to generate more
revenues for the company.
Increase in lifestyle: Due to maximisation in literacy rate in global areas the healthcare
issues has made huge demand of medical products.
Threats:
Struggle against harmful element: Those ingredients should be banned in countries which
are harmful for the people as well as the society.
Negative impact of goods when they recall.
SWOT for PFIZER:
Strength:
It is said to be one of the largest company in pharma sectors that is spread over 50
countries.
His name is has been recognised at international.
Weaknesses:
There is huge competitor that has to face this company that tend to limited scope for
market growth.
Because of fraud in healthcare product in market it has shown negative impact.
2
Paraphrase This Document
Need a fresh take? Get an instant paraphrase of this document with our AI Paraphraser
Opportunity:
It create awareness in healthcare requirement.
It develop increase demand for healthcare solution.
International penetration through merger and acquisition in other sectors to increase their
demand.
Threats:
Because of not success in new products has been big risk in company.
There is being huge impact because of economic slowdown in European market.
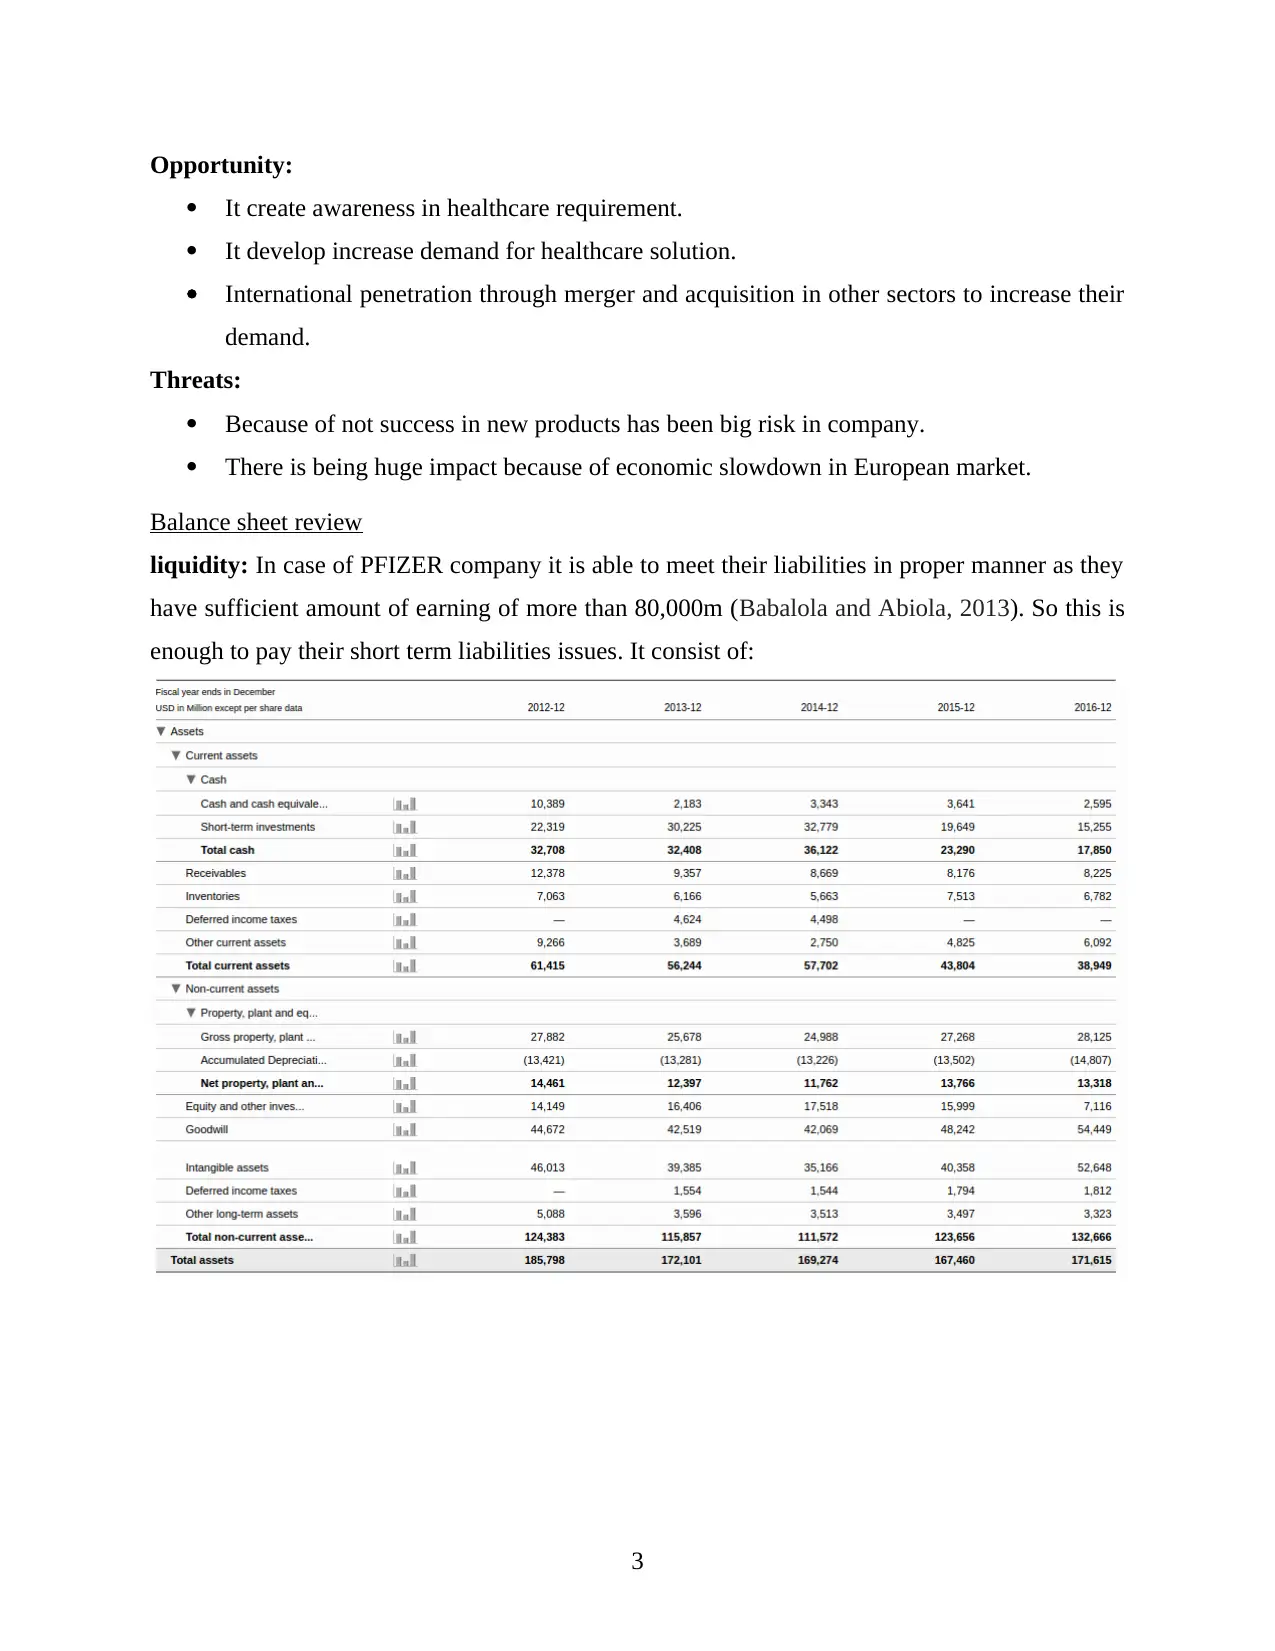
Balance sheet review
liquidity: In case of PFIZER company it is able to meet their liabilities in proper manner as they
have sufficient amount of earning of more than 80,000m (Babalola and Abiola, 2013). So this is
enough to pay their short term liabilities issues. It consist of:
3
It create awareness in healthcare requirement.
It develop increase demand for healthcare solution.
International penetration through merger and acquisition in other sectors to increase their
demand.
Threats:
Because of not success in new products has been big risk in company.
There is being huge impact because of economic slowdown in European market.
Balance sheet review
liquidity: In case of PFIZER company it is able to meet their liabilities in proper manner as they
have sufficient amount of earning of more than 80,000m (Babalola and Abiola, 2013). So this is
enough to pay their short term liabilities issues. It consist of:
3
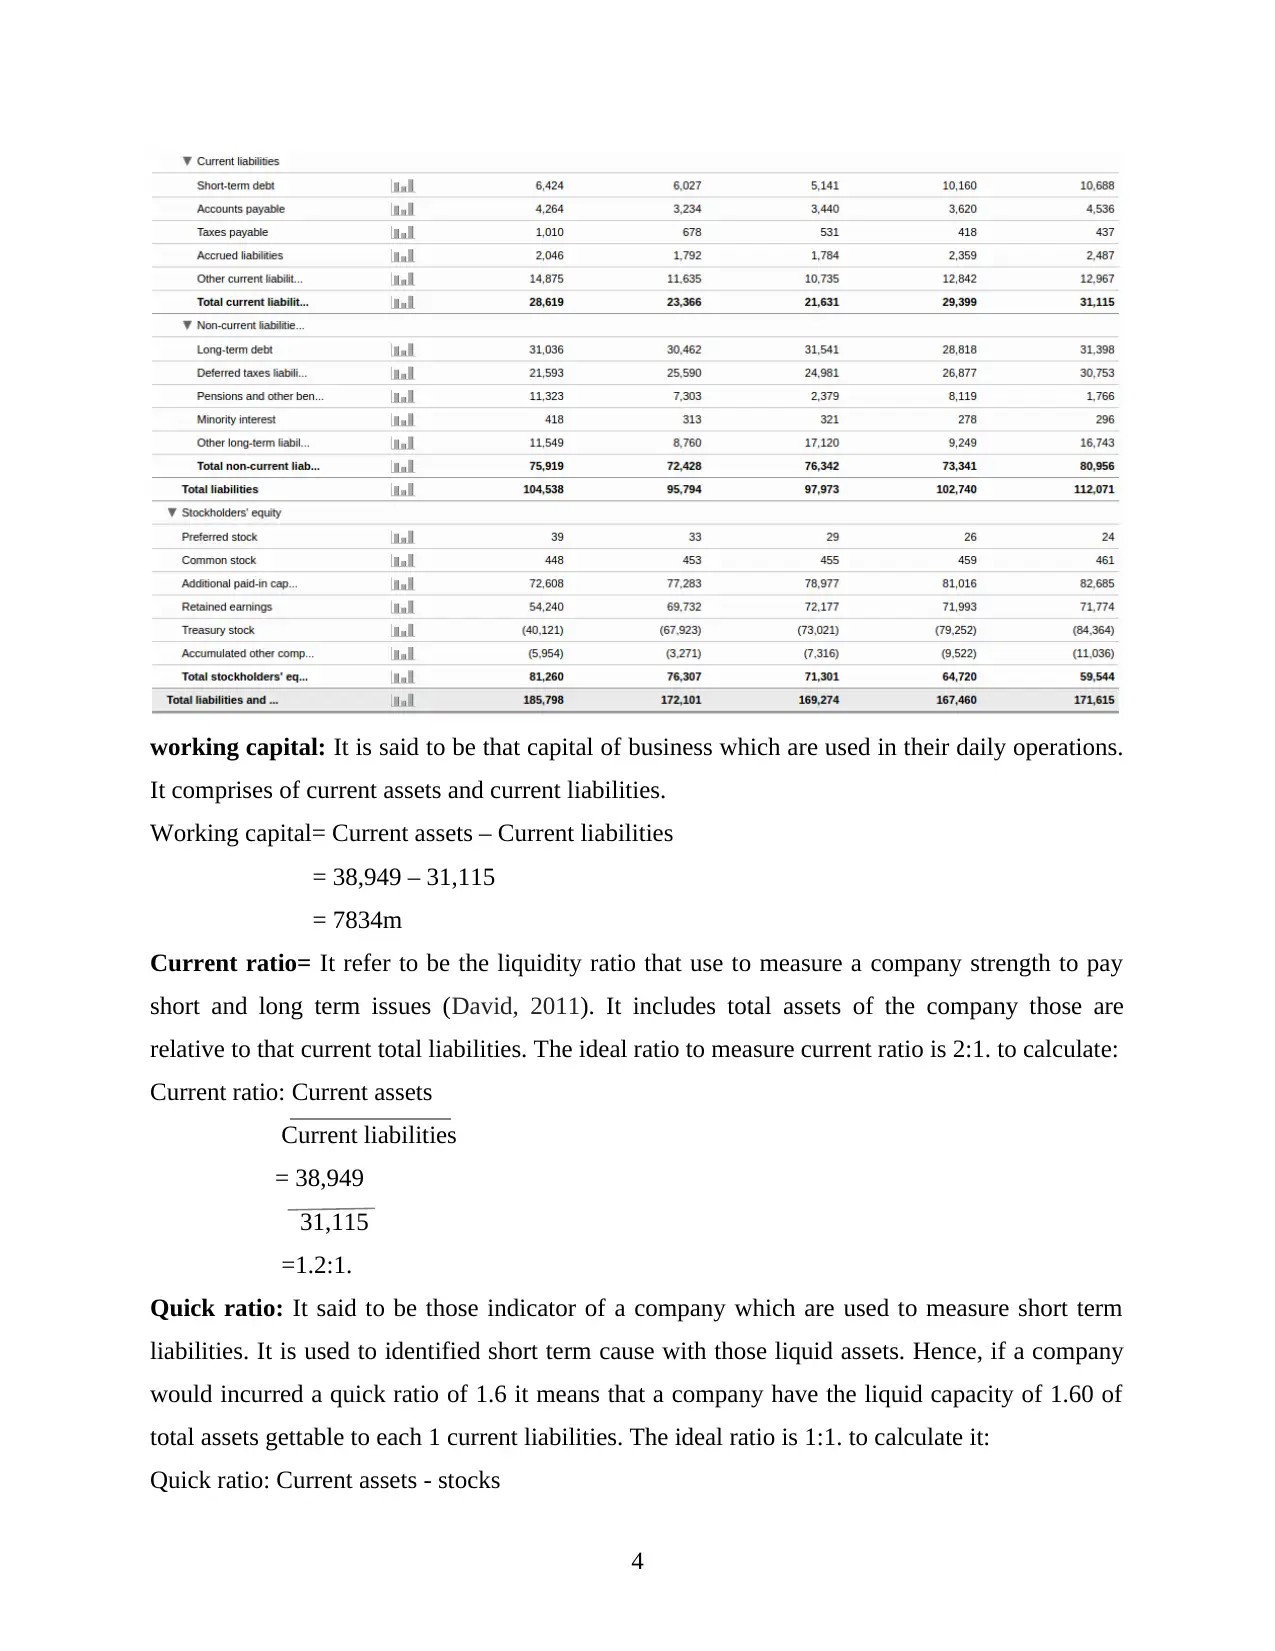
working capital: It is said to be that capital of business which are used in their daily operations.
It comprises of current assets and current liabilities.
Working capital= Current assets – Current liabilities
= 38,949 – 31,115
= 7834m
Current ratio= It refer to be the liquidity ratio that use to measure a company strength to pay
short and long term issues (David, 2011). It includes total assets of the company those are
relative to that current total liabilities. The ideal ratio to measure current ratio is 2:1. to calculate:
Current ratio: Current assets
Current liabilities
= 38,949
31,115
=1.2:1.
Quick ratio: It said to be those indicator of a company which are used to measure short term
liabilities. It is used to identified short term cause with those liquid assets. Hence, if a company
would incurred a quick ratio of 1.6 it means that a company have the liquid capacity of 1.60 of
total assets gettable to each 1 current liabilities. The ideal ratio is 1:1. to calculate it:
Quick ratio: Current assets - stocks
4
⊘ This is a preview!⊘
Do you want full access?
Subscribe today to unlock all pages.
Trusted by 1+ million students worldwide
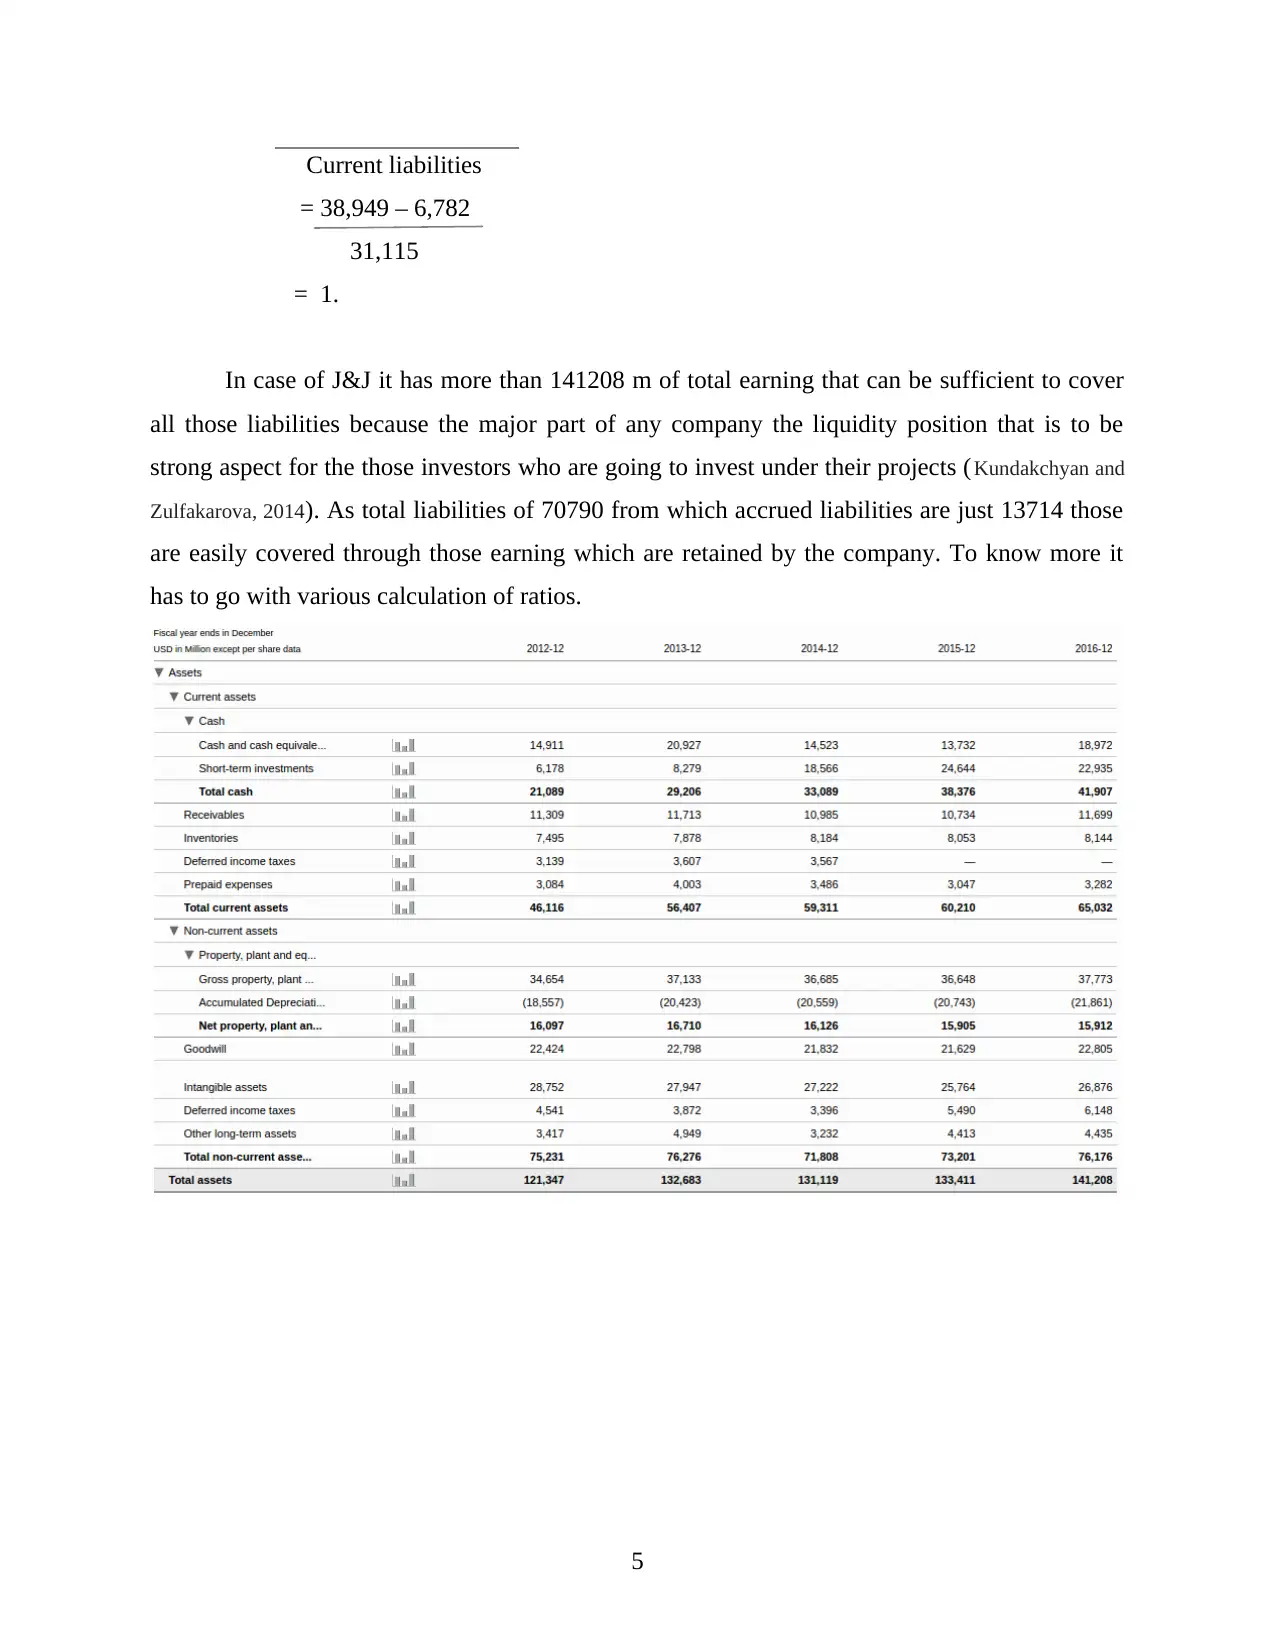
Current liabilities
= 38,949 – 6,782
31,115
= 1.
In case of J&J it has more than 141208 m of total earning that can be sufficient to cover
all those liabilities because the major part of any company the liquidity position that is to be
strong aspect for the those investors who are going to invest under their projects (Kundakchyan and
Zulfakarova, 2014). As total liabilities of 70790 from which accrued liabilities are just 13714 those
are easily covered through those earning which are retained by the company. To know more it
has to go with various calculation of ratios.
5
Paraphrase This Document
Need a fresh take? Get an instant paraphrase of this document with our AI Paraphraser
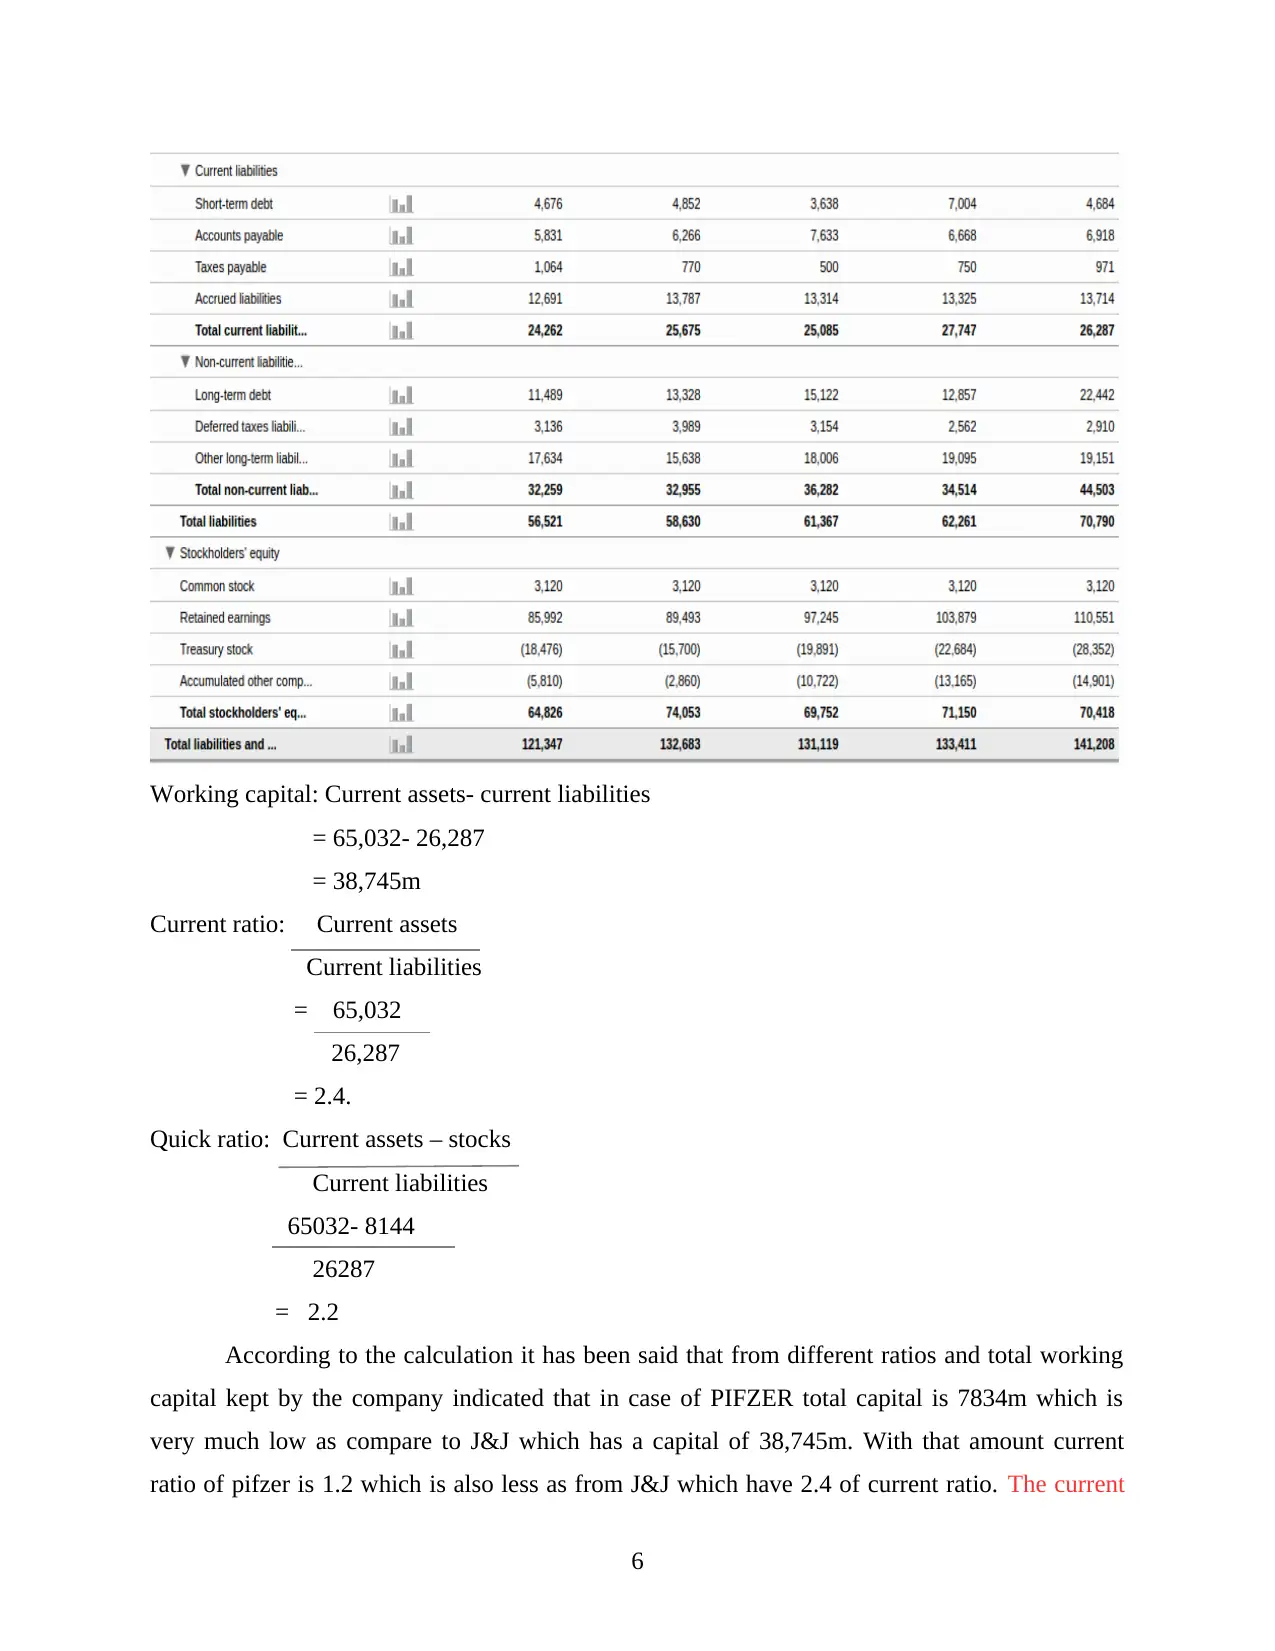
Working capital: Current assets- current liabilities
= 65,032- 26,287
= 38,745m
Current ratio: Current assets
Current liabilities
= 65,032
26,287
= 2.4.
Quick ratio: Current assets – stocks
Current liabilities
65032- 8144
26287
= 2.2
According to the calculation it has been said that from different ratios and total working
capital kept by the company indicated that in case of PIFZER total capital is 7834m which is
very much low as compare to J&J which has a capital of 38,745m. With that amount current
ratio of pifzer is 1.2 which is also less as from J&J which have 2.4 of current ratio. The current
6
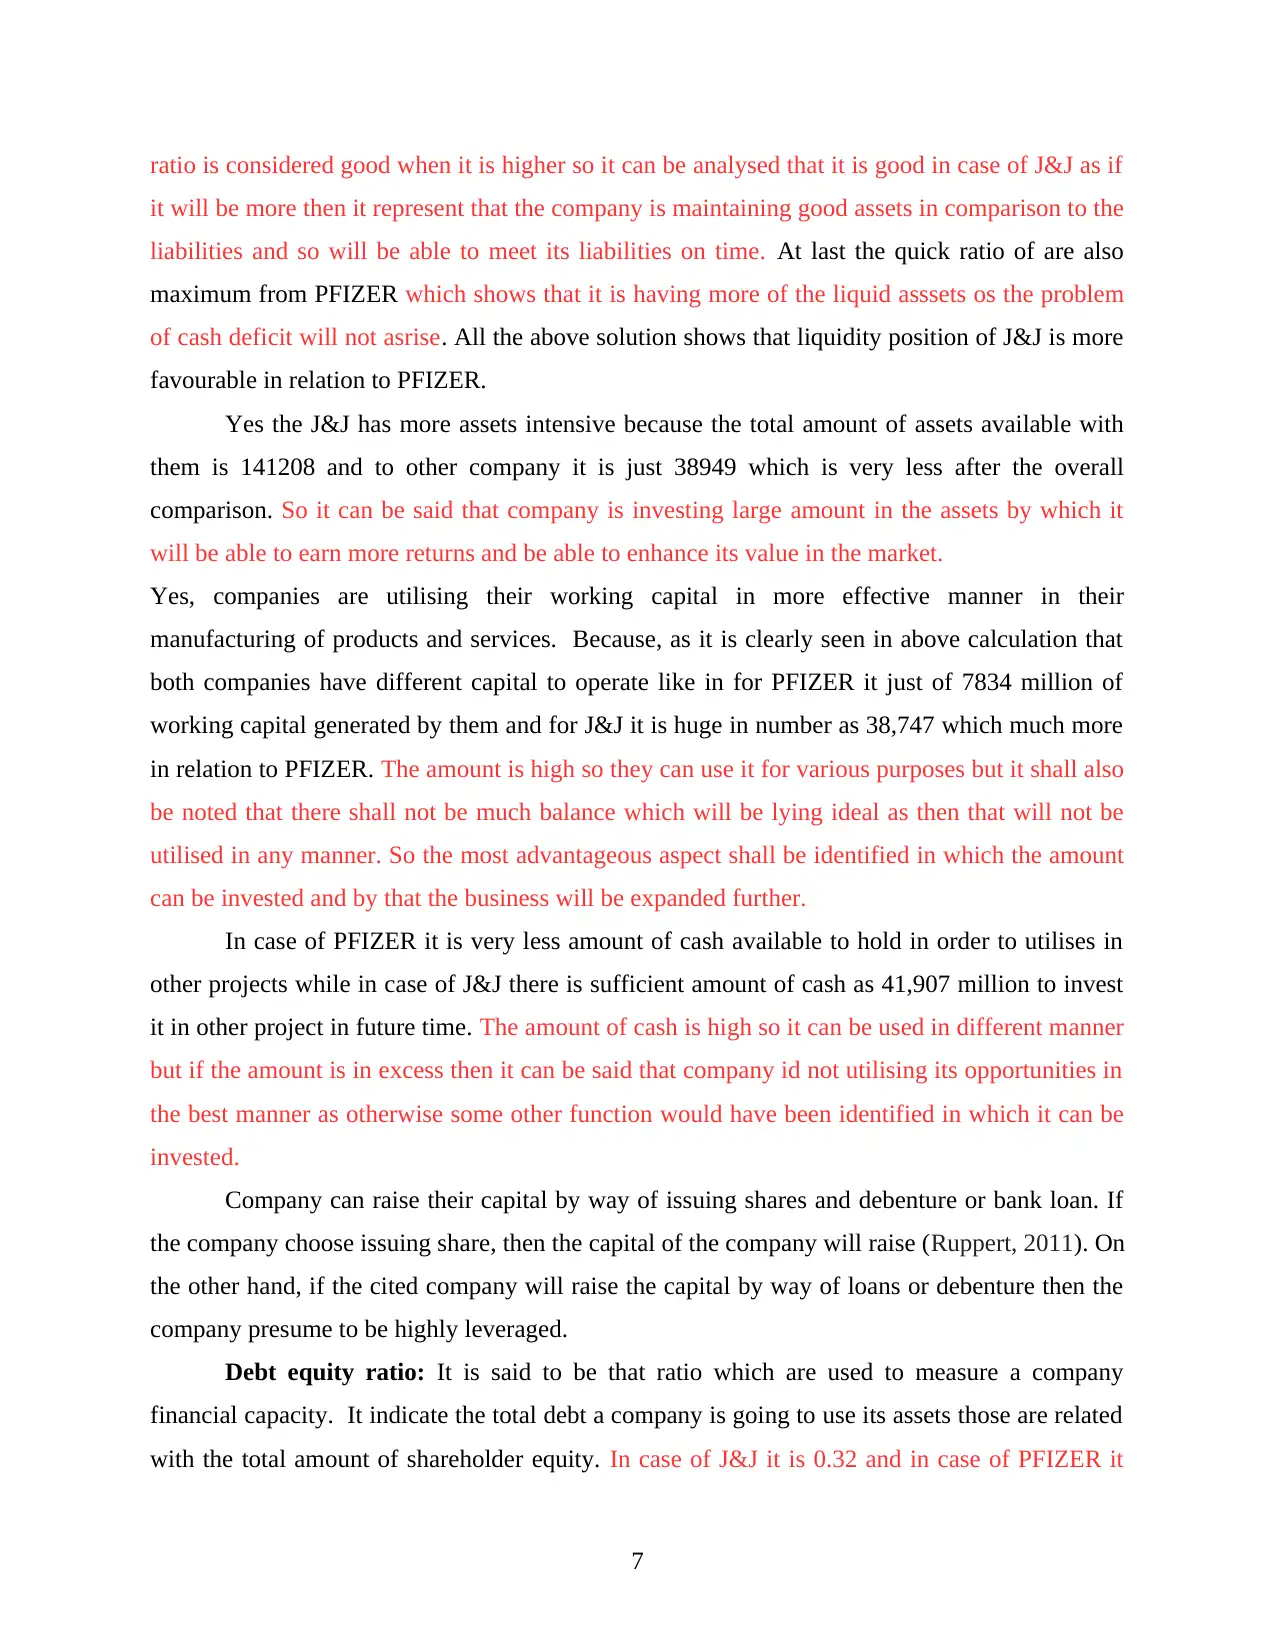
ratio is considered good when it is higher so it can be analysed that it is good in case of J&J as if
it will be more then it represent that the company is maintaining good assets in comparison to the
liabilities and so will be able to meet its liabilities on time. At last the quick ratio of are also
maximum from PFIZER which shows that it is having more of the liquid asssets os the problem
of cash deficit will not asrise. All the above solution shows that liquidity position of J&J is more
favourable in relation to PFIZER.
Yes the J&J has more assets intensive because the total amount of assets available with
them is 141208 and to other company it is just 38949 which is very less after the overall
comparison. So it can be said that company is investing large amount in the assets by which it
will be able to earn more returns and be able to enhance its value in the market.
Yes, companies are utilising their working capital in more effective manner in their
manufacturing of products and services. Because, as it is clearly seen in above calculation that
both companies have different capital to operate like in for PFIZER it just of 7834 million of
working capital generated by them and for J&J it is huge in number as 38,747 which much more
in relation to PFIZER. The amount is high so they can use it for various purposes but it shall also
be noted that there shall not be much balance which will be lying ideal as then that will not be
utilised in any manner. So the most advantageous aspect shall be identified in which the amount
can be invested and by that the business will be expanded further.
In case of PFIZER it is very less amount of cash available to hold in order to utilises in
other projects while in case of J&J there is sufficient amount of cash as 41,907 million to invest
it in other project in future time. The amount of cash is high so it can be used in different manner
but if the amount is in excess then it can be said that company id not utilising its opportunities in
the best manner as otherwise some other function would have been identified in which it can be
invested.
Company can raise their capital by way of issuing shares and debenture or bank loan. If
the company choose issuing share, then the capital of the company will raise (Ruppert, 2011). On
the other hand, if the cited company will raise the capital by way of loans or debenture then the
company presume to be highly leveraged.
Debt equity ratio: It is said to be that ratio which are used to measure a company
financial capacity. It indicate the total debt a company is going to use its assets those are related
with the total amount of shareholder equity. In case of J&J it is 0.32 and in case of PFIZER it
7
⊘ This is a preview!⊘
Do you want full access?
Subscribe today to unlock all pages.
Trusted by 1+ million students worldwide
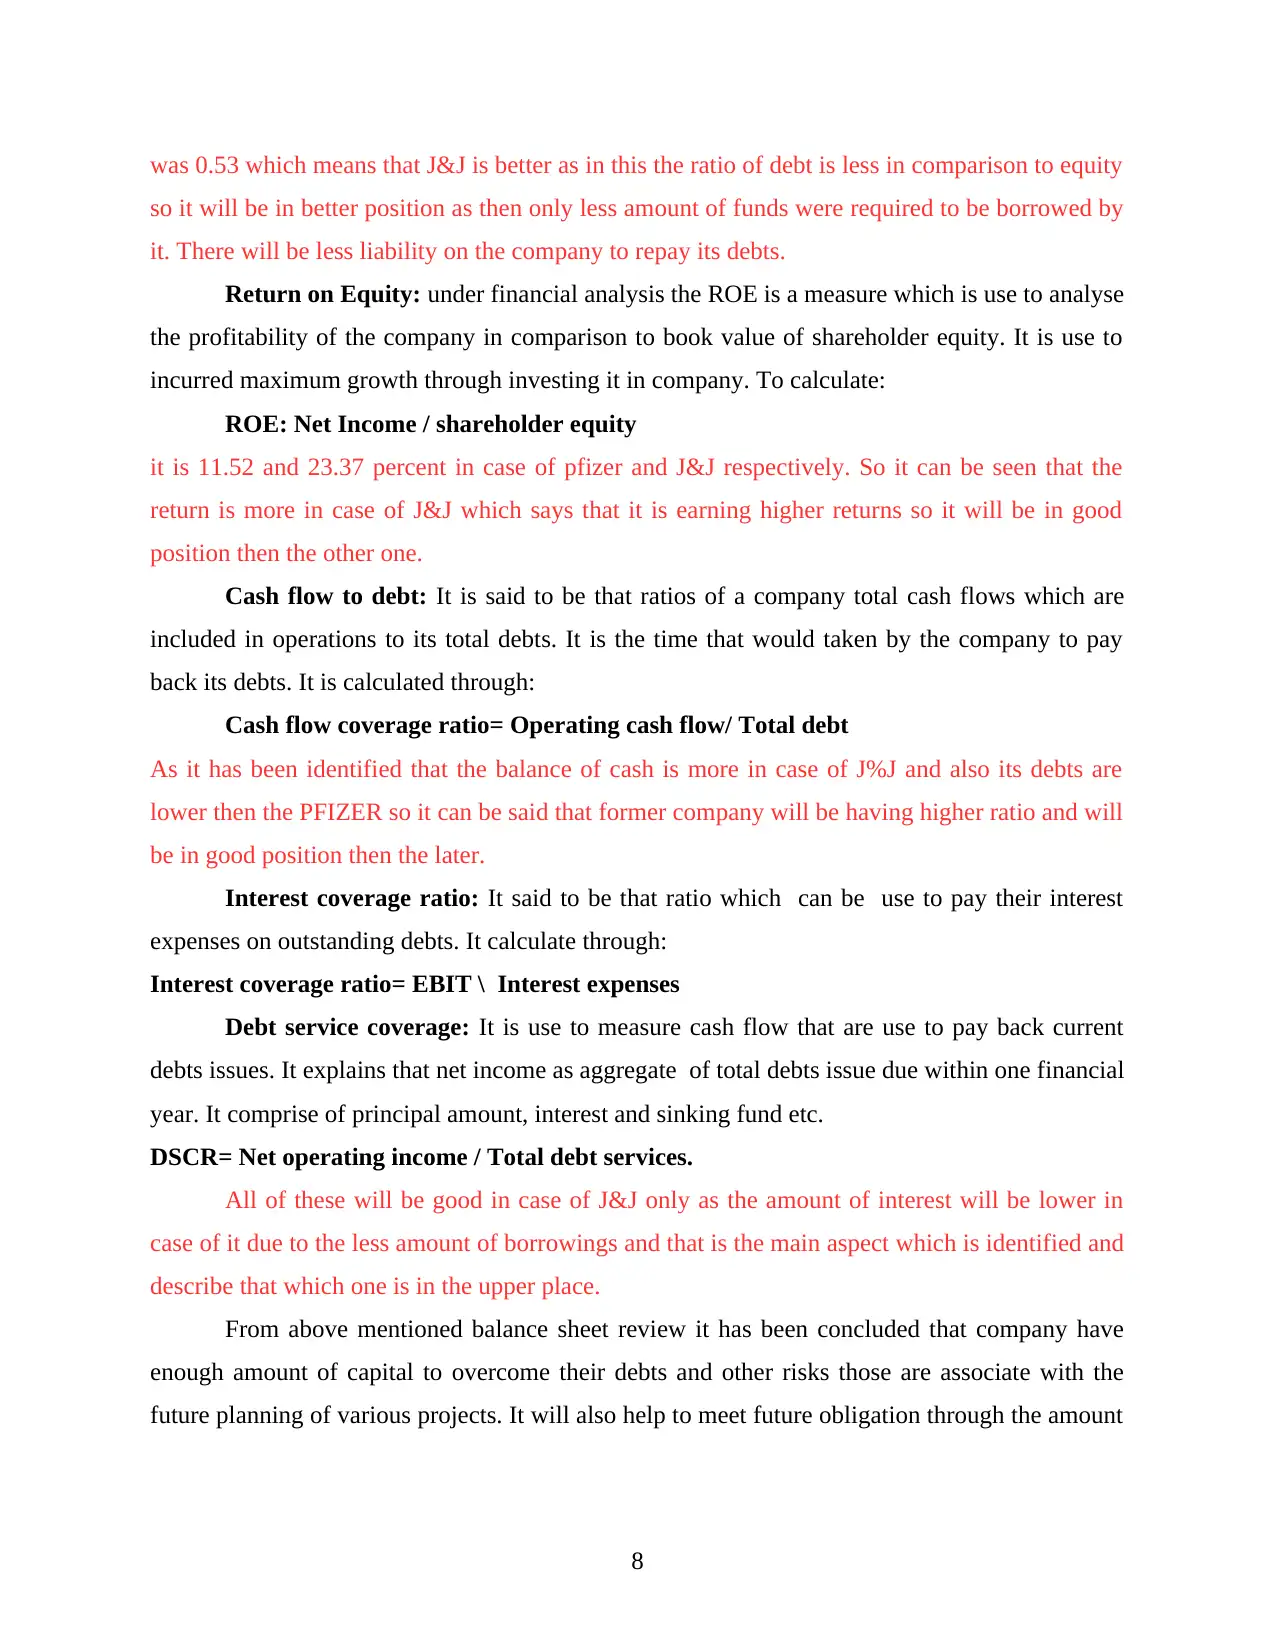
was 0.53 which means that J&J is better as in this the ratio of debt is less in comparison to equity
so it will be in better position as then only less amount of funds were required to be borrowed by
it. There will be less liability on the company to repay its debts.
Return on Equity: under financial analysis the ROE is a measure which is use to analyse
the profitability of the company in comparison to book value of shareholder equity. It is use to
incurred maximum growth through investing it in company. To calculate:
ROE: Net Income / shareholder equity
it is 11.52 and 23.37 percent in case of pfizer and J&J respectively. So it can be seen that the
return is more in case of J&J which says that it is earning higher returns so it will be in good
position then the other one.
Cash flow to debt: It is said to be that ratios of a company total cash flows which are
included in operations to its total debts. It is the time that would taken by the company to pay
back its debts. It is calculated through:
Cash flow coverage ratio= Operating cash flow/ Total debt
As it has been identified that the balance of cash is more in case of J%J and also its debts are
lower then the PFIZER so it can be said that former company will be having higher ratio and will
be in good position then the later.
Interest coverage ratio: It said to be that ratio which can be use to pay their interest
expenses on outstanding debts. It calculate through:
Interest coverage ratio= EBIT \ Interest expenses
Debt service coverage: It is use to measure cash flow that are use to pay back current
debts issues. It explains that net income as aggregate of total debts issue due within one financial
year. It comprise of principal amount, interest and sinking fund etc.
DSCR= Net operating income / Total debt services.
All of these will be good in case of J&J only as the amount of interest will be lower in
case of it due to the less amount of borrowings and that is the main aspect which is identified and
describe that which one is in the upper place.
From above mentioned balance sheet review it has been concluded that company have
enough amount of capital to overcome their debts and other risks those are associate with the
future planning of various projects. It will also help to meet future obligation through the amount
8
Paraphrase This Document
Need a fresh take? Get an instant paraphrase of this document with our AI Paraphraser
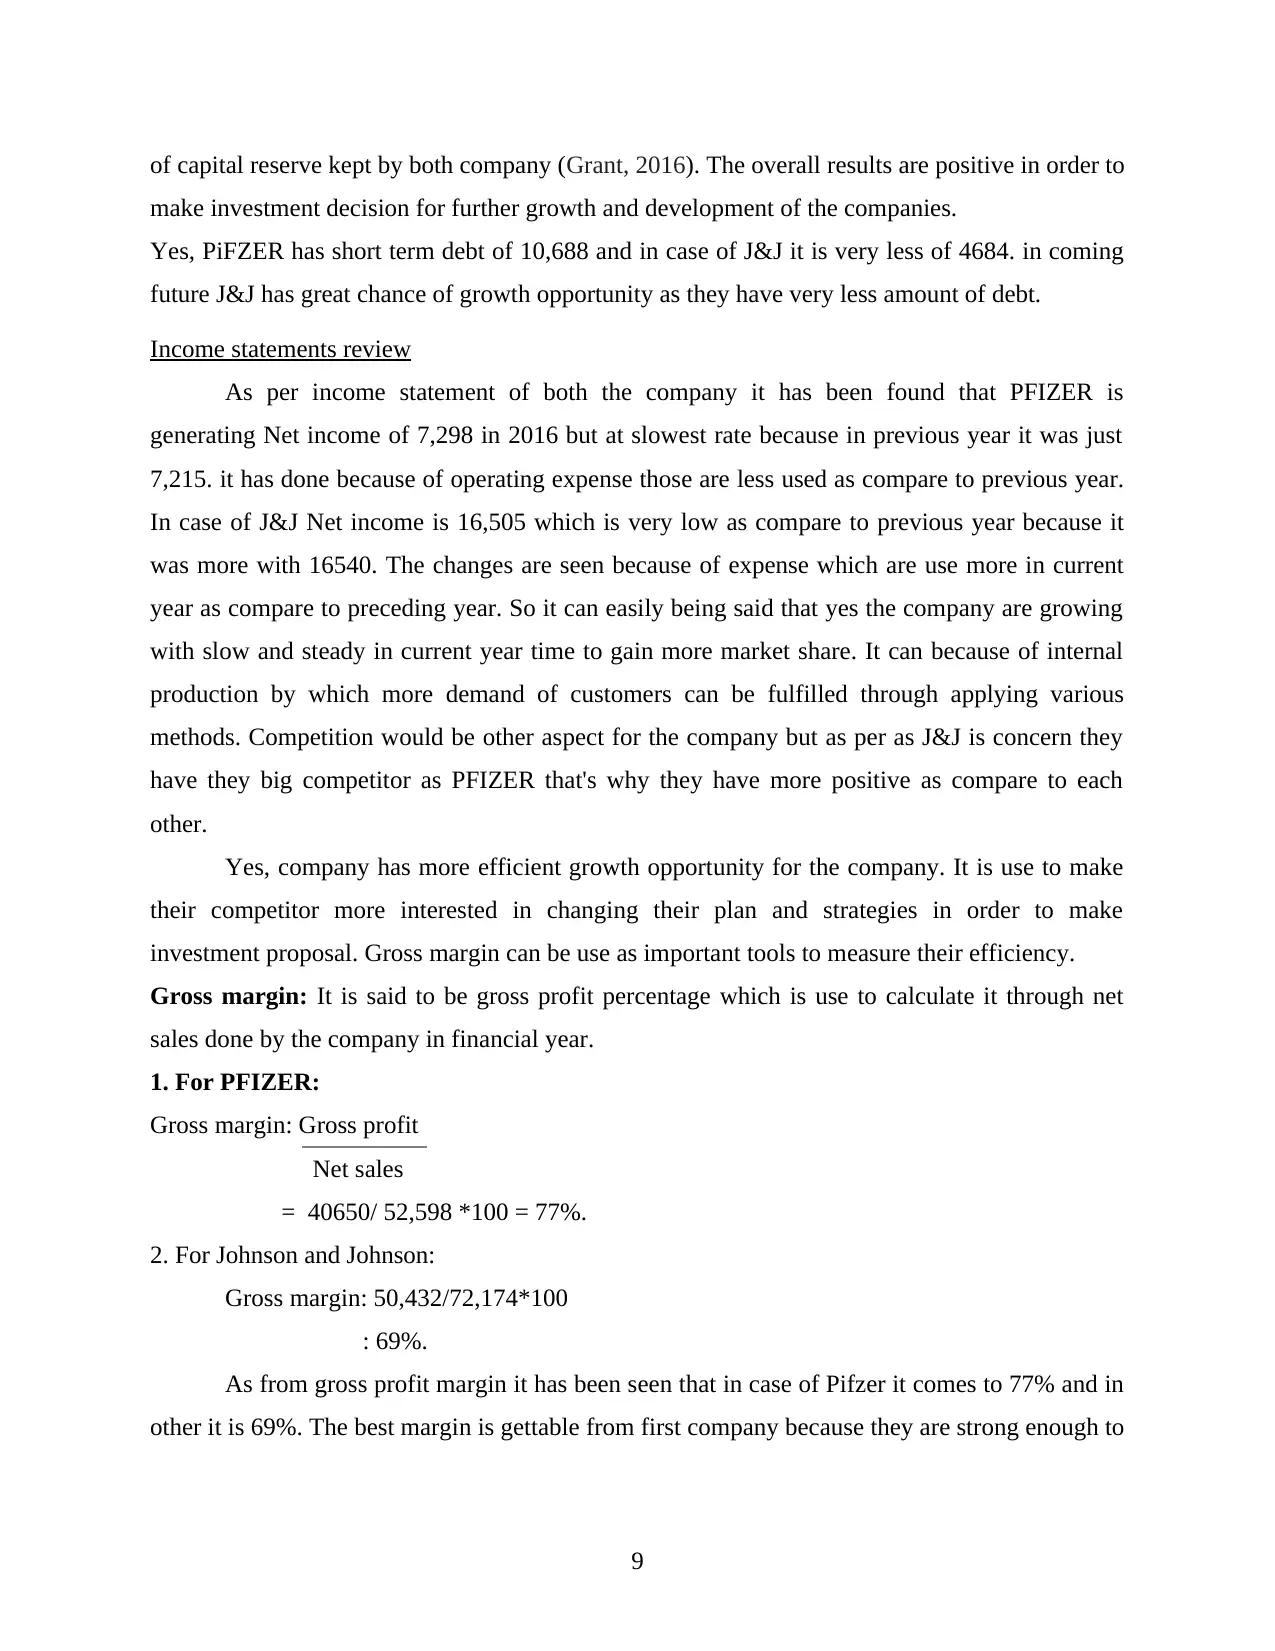
of capital reserve kept by both company (Grant, 2016). The overall results are positive in order to
make investment decision for further growth and development of the companies.
Yes, PiFZER has short term debt of 10,688 and in case of J&J it is very less of 4684. in coming
future J&J has great chance of growth opportunity as they have very less amount of debt.
Income statements review
As per income statement of both the company it has been found that PFIZER is
generating Net income of 7,298 in 2016 but at slowest rate because in previous year it was just
7,215. it has done because of operating expense those are less used as compare to previous year.
In case of J&J Net income is 16,505 which is very low as compare to previous year because it
was more with 16540. The changes are seen because of expense which are use more in current
year as compare to preceding year. So it can easily being said that yes the company are growing
with slow and steady in current year time to gain more market share. It can because of internal
production by which more demand of customers can be fulfilled through applying various
methods. Competition would be other aspect for the company but as per as J&J is concern they
have they big competitor as PFIZER that's why they have more positive as compare to each
other.
Yes, company has more efficient growth opportunity for the company. It is use to make
their competitor more interested in changing their plan and strategies in order to make
investment proposal. Gross margin can be use as important tools to measure their efficiency.
Gross margin: It is said to be gross profit percentage which is use to calculate it through net
sales done by the company in financial year.
1. For PFIZER:
Gross margin: Gross profit
Net sales
= 40650/ 52,598 *100 = 77%.
2. For Johnson and Johnson:
Gross margin: 50,432/72,174*100
: 69%.
As from gross profit margin it has been seen that in case of Pifzer it comes to 77% and in
other it is 69%. The best margin is gettable from first company because they are strong enough to
9
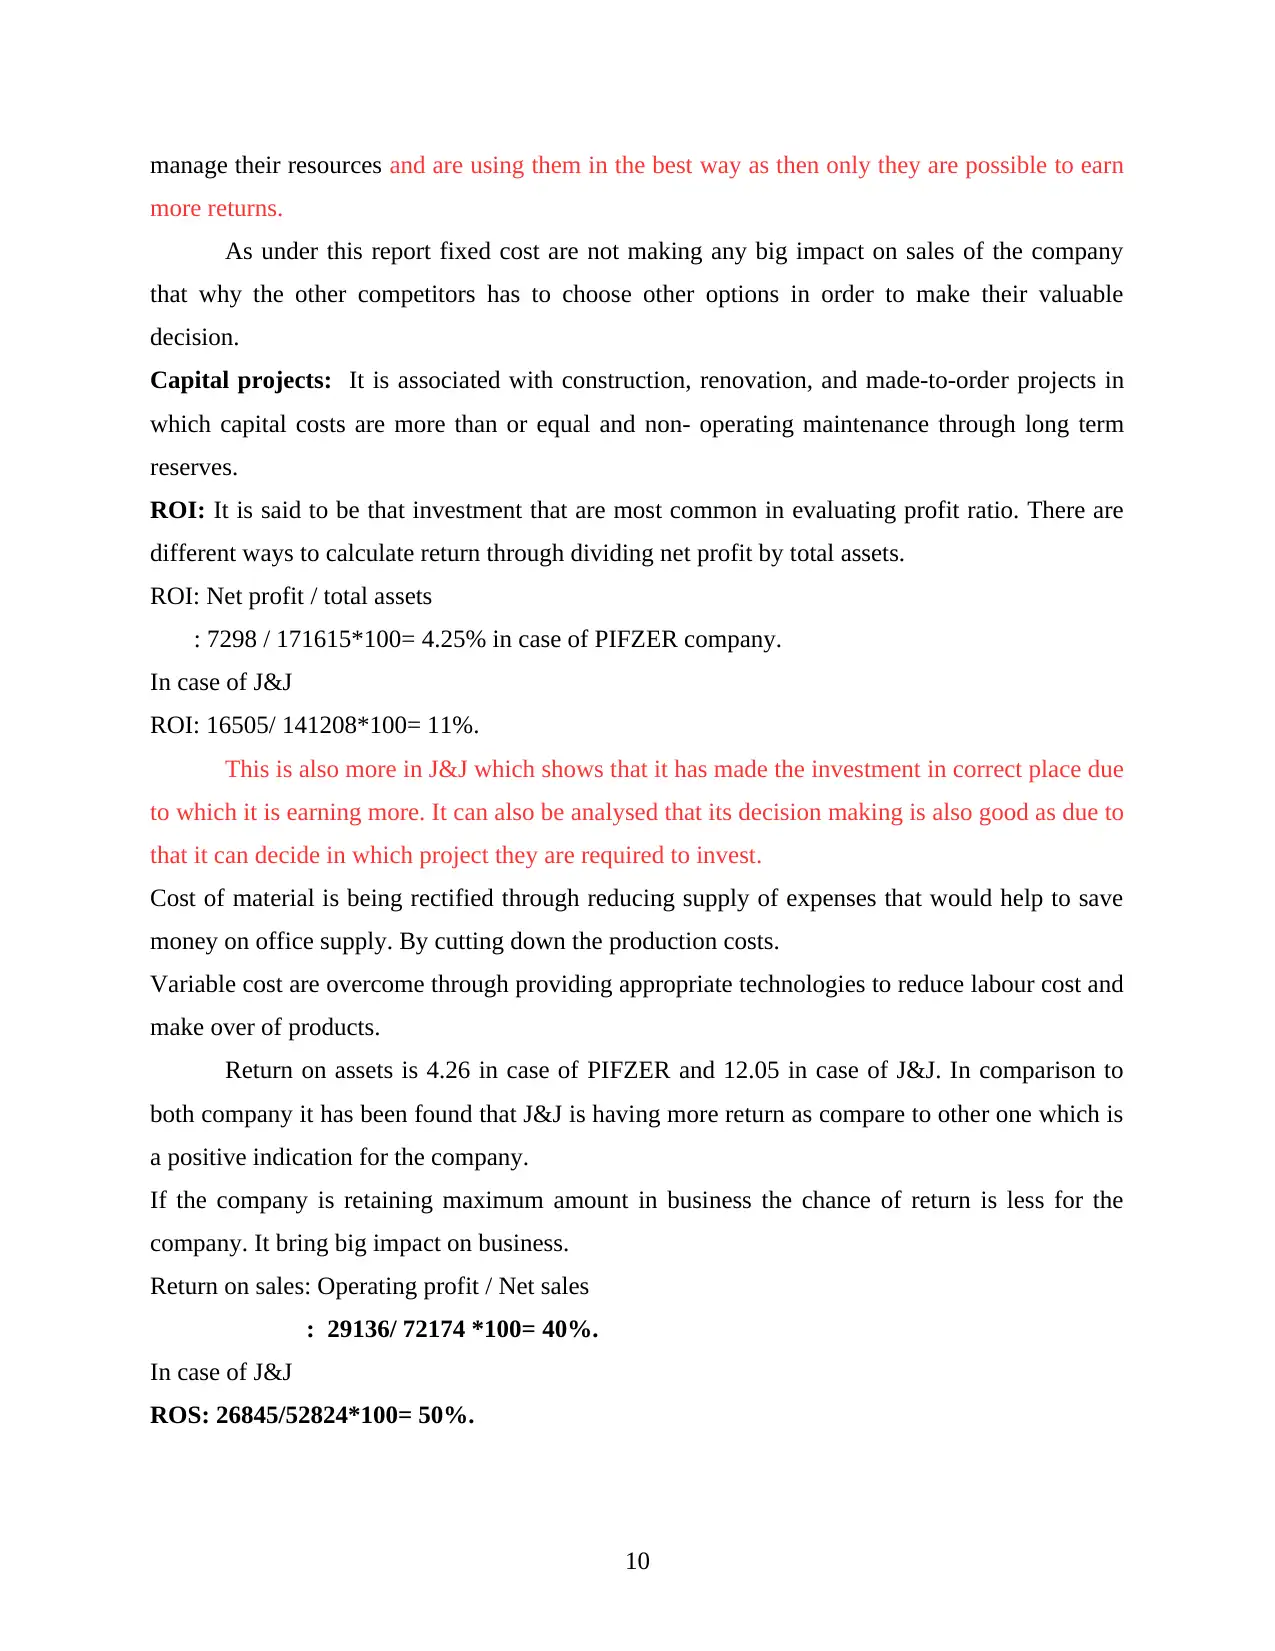
manage their resources and are using them in the best way as then only they are possible to earn
more returns.
As under this report fixed cost are not making any big impact on sales of the company
that why the other competitors has to choose other options in order to make their valuable
decision.
Capital projects: It is associated with construction, renovation, and made-to-order projects in
which capital costs are more than or equal and non- operating maintenance through long term
reserves.
ROI: It is said to be that investment that are most common in evaluating profit ratio. There are
different ways to calculate return through dividing net profit by total assets.
ROI: Net profit / total assets
: 7298 / 171615*100= 4.25% in case of PIFZER company.
In case of J&J
ROI: 16505/ 141208*100= 11%.
This is also more in J&J which shows that it has made the investment in correct place due
to which it is earning more. It can also be analysed that its decision making is also good as due to
that it can decide in which project they are required to invest.
Cost of material is being rectified through reducing supply of expenses that would help to save
money on office supply. By cutting down the production costs.
Variable cost are overcome through providing appropriate technologies to reduce labour cost and
make over of products.
Return on assets is 4.26 in case of PIFZER and 12.05 in case of J&J. In comparison to
both company it has been found that J&J is having more return as compare to other one which is
a positive indication for the company.
If the company is retaining maximum amount in business the chance of return is less for the
company. It bring big impact on business.
Return on sales: Operating profit / Net sales
: 29136/ 72174 *100= 40%.
In case of J&J
ROS: 26845/52824*100= 50%.
10
⊘ This is a preview!⊘
Do you want full access?
Subscribe today to unlock all pages.
Trusted by 1+ million students worldwide
1 out of 14
Related Documents


Your All-in-One AI-Powered Toolkit for Academic Success.
+13062052269
info@desklib.com
Available 24*7 on WhatsApp / Email
![[object Object]](/_next/static/media/star-bottom.7253800d.svg)
Unlock your academic potential
Copyright © 2020–2025 A2Z Services. All Rights Reserved. Developed and managed by ZUCOL.