Comprehensive Financial Analysis of Jones Lang LaSalle (JLL)
VerifiedAdded on 2023/01/16
|17
|4024
|80
Report
AI Summary
This report presents an analysis of the financial statements of Jones Lang LaSalle (JLL), a real estate investment management and professional services company. The analysis covers key financial ratios, including Return on Capital Employed (ROCE), Operating Profit Margin, Assets Turnover, Gross Profit Margin, Debtor Days, Creditor Days, Current Ratio, Quick Ratio, Debt Equity Ratio, Interest Cover, and Earnings per Share (EPS). The report compares JLL's performance against industry and sector averages, highlighting areas of strength and weakness. The company's business strategy, including its digital transformation initiatives, is also discussed, providing context for the financial analysis. The report provides an overview of JLL’s financial health and efficiency in using assets, managing debts, and generating profits. The analysis reveals that while JLL has shown growth, it faces challenges in certain areas compared to industry benchmarks. Overall, the report offers a comprehensive evaluation of JLL’s financial position and performance.
Running Head: ACCOUNTING STATEMENT ANALYSIS
ACCOUNTING STATEMENT ANALYSIS
Name of the Student
Name of the University
Author Note
ACCOUNTING STATEMENT ANALYSIS
Name of the Student
Name of the University
Author Note
Paraphrase This Document
Need a fresh take? Get an instant paraphrase of this document with our AI Paraphraser
1ACCOUNTING STATEMENT ANALYSIS
Table of Contents
Introduction................................................................................................................................2
Company business Strategy.......................................................................................................3
Analysis of Financial Statements...............................................................................................4
Conclusion..................................................................................................................................9
References................................................................................................................................12
2ACCOUNTING STATEMENT ANALYSIS
Introduction
The aim of this assignment is the analysis of the Accounting Statement for the
company Jones Lang LaSalle. It is the American investment management and professional
services company, which is specialized in real estate business. The company is headquartered
in Chicago, United States. Jones Lang LaSalle is engaged in providing services of global real
estate and is specialized in investment management and commercial property, giving services
to the real estate owners and occupiers (Jll.co.in. 2019). This company is recognized as the
world leader in providing the real estate services, which is powered by their entrepreneurial
spirit. Jones Lang LaSalle has shortened its name as JLL for the purposes of marketing. JLL
is committed towards having the clients who are more ambitious. They buy, occupy, build
and does investment in variety of assets which includes retail, commercial, industrial, hotel
real estate and residential. The clients of the company span industries from tech startups to
global firms, which include energy, law, manufacturing, healthcare, life sciences and
technology (Jll.co.in. 2019).
Company business Strategy
JLL aims at delivering exceptional strategic services of fully integrated, innovative
solutions for the owners of the real estate, best practices, investors, occupiers and developers
worldwide. The company delivers a blend of expertise, services and applications of the
technology on the integrated global platform owned by the company. Customer loyalty and
contribution to the service excellence makes the company different from that of the
competitors (Verhetsel 2015).
JLL has designed their business model of creating the value for their clients and
establishing the high-quality relationships with their suppliers and the communities in which
they operate. They create synergistic approach by seeking to derive the benefits of the
⊘ This is a preview!⊘
Do you want full access?
Subscribe today to unlock all pages.
Trusted by 1+ million students worldwide
3ACCOUNTING STATEMENT ANALYSIS
business from interaction and application of human resource, intellectual capital, financial
and technology. On the basis of the company’s established presence and intimate knowledge
of the worldwide real estate and local real estate and well as by the support of the investment
in the thought leadership, use of digital, electronic and technology as a means for gathering,
analyzing and communicating relevant information to their constituencies, the company
creates value for their clients. With the help of addressing them by the creation of value, the
company fulfills its strategically goals and objectives of long-term as well as sustainable
growth (Clements 2015).
JLL has adopted the business strategy of digital transformation, which helps the
company in becoming highly software-driven company and given other companies lesson
that digital transformation changes everything. The company in many ways has become
cloud-based software company. The company’s strategy in order to achieve the value is
digital. JLL have made the strategy in which it has committed for continually enhancing and
developing the best data, technology platform and information-management in the industry of
commercial real estate. In their business, they relied on the innovations in the technology for
serving their clients, supporting their people and connecting their company (Murphy 2017).
The increasing reliance of the company on the cloud for both the users of internal and
external has influenced the network architecture of the JLL. Earlier, the company provided
the connectivity to their offices by connecting to the centers of the regional data through the
technology of older private networking and via links of private MPLS. However, the digital
strategy hasshaken up the network (Wilkinson et al. 2014).
JLL consolidated for cost saving by consolidating their office IT infrastructure such as
print servers and file at the data centers have helped in reducing the need for the IT expertise
at hundreds of their offices and equipment’s. This big benefit of reduction in cost for the
Paraphrase This Document
Need a fresh take? Get an instant paraphrase of this document with our AI Paraphraser
4ACCOUNTING STATEMENT ANALYSIS
digital transformation has resulted in to moving to the cloud. The team of the company strives
in creating strategic model of total cost of ownership every five years (Kern et al. 2015).
The effects of the digital transformation is already be seen by the company. The
company has become provider of SaaS, data to reinvent itself, cloud computing and
leveraging the modern and flexible network (Sawhney, Goodman and Broit 2016).
Analysis of Financial Statements
Following are the ratios, which are calculated in order to do the financial analysis:
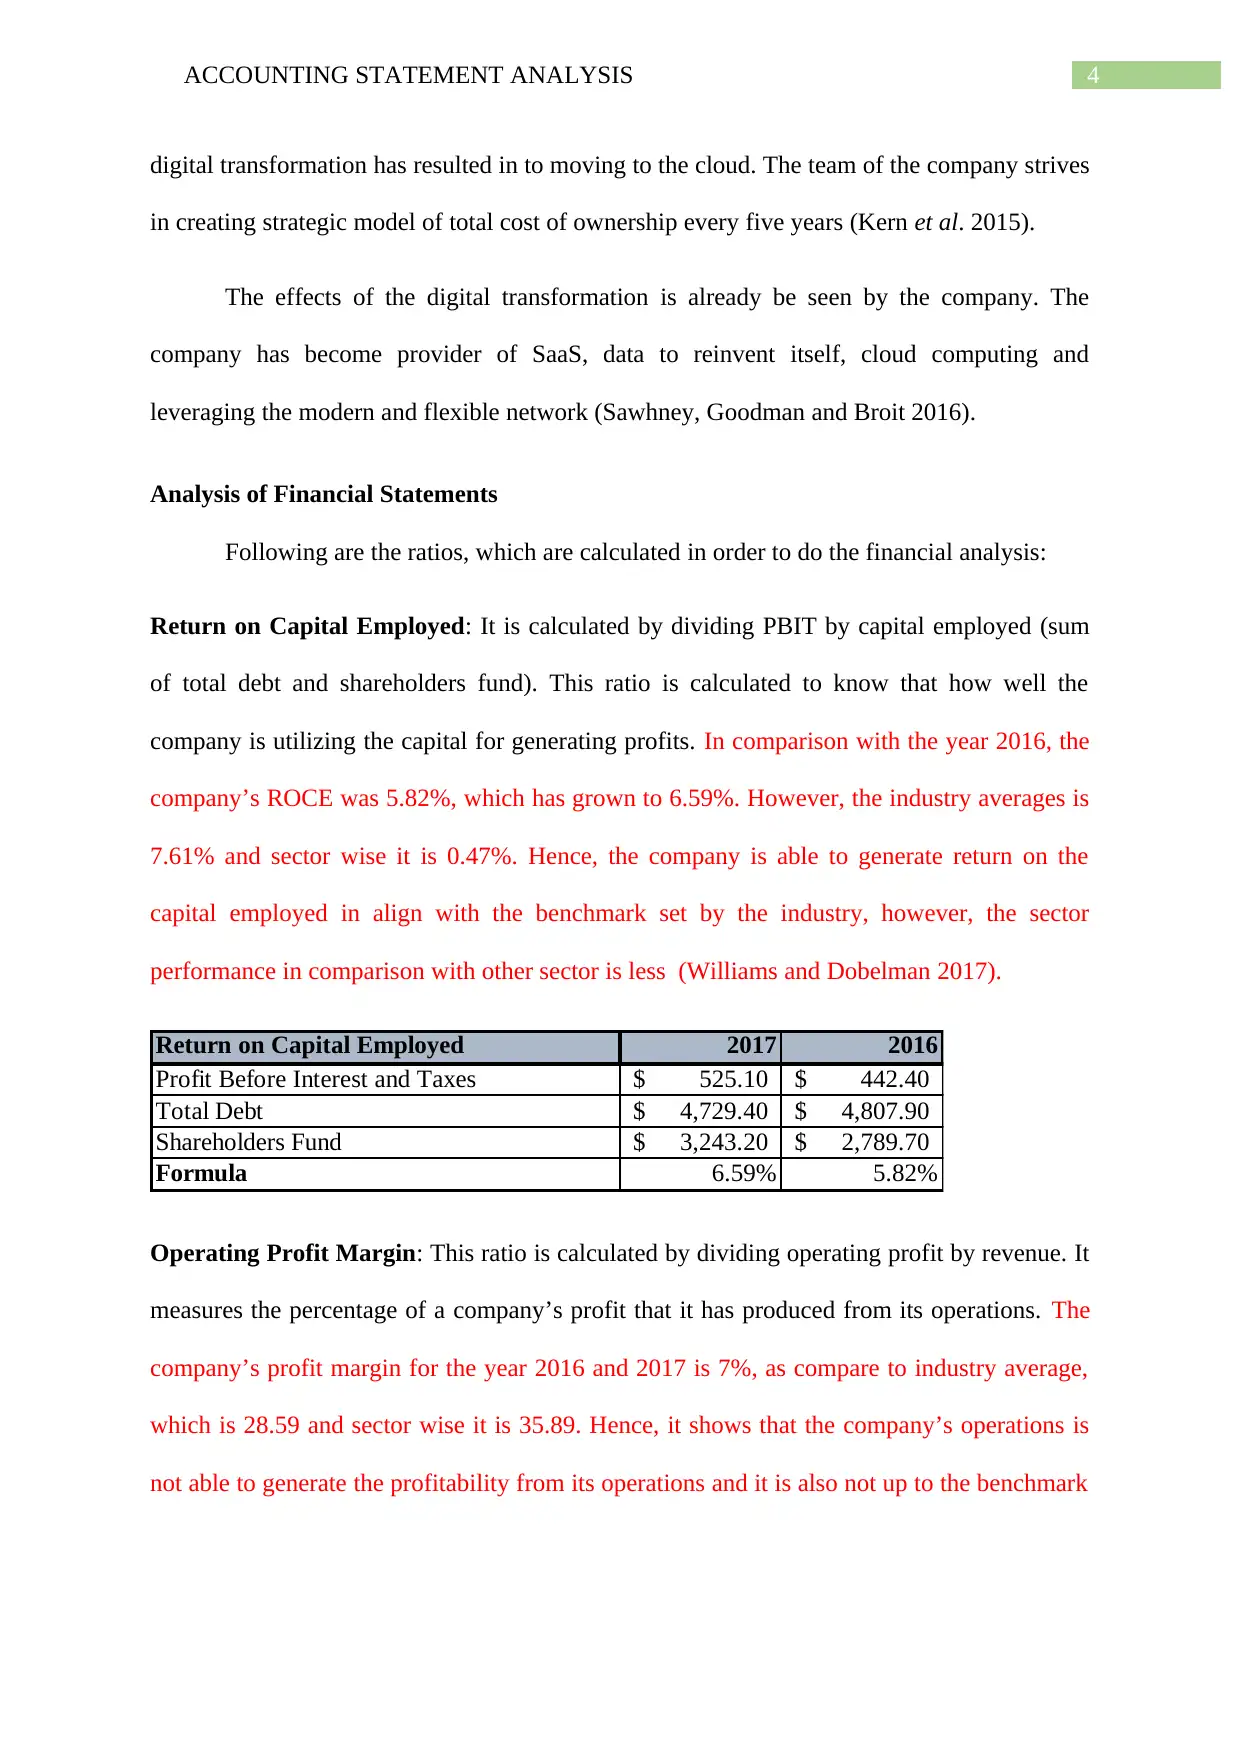
Return on Capital Employed: It is calculated by dividing PBIT by capital employed (sum
of total debt and shareholders fund). This ratio is calculated to know that how well the
company is utilizing the capital for generating profits. In comparison with the year 2016, the
company’s ROCE was 5.82%, which has grown to 6.59%. However, the industry averages is
7.61% and sector wise it is 0.47%. Hence, the company is able to generate return on the
capital employed in align with the benchmark set by the industry, however, the sector
performance in comparison with other sector is less (Williams and Dobelman 2017).
Return on Capital Employed 2017 2016
Profit Before Interest and Taxes 525.10$ 442.40$
Total Debt 4,729.40$ 4,807.90$
Shareholders Fund 3,243.20$ 2,789.70$
Formula 6.59% 5.82%
Operating Profit Margin: This ratio is calculated by dividing operating profit by revenue. It
measures the percentage of a company’s profit that it has produced from its operations. The
company’s profit margin for the year 2016 and 2017 is 7%, as compare to industry average,
which is 28.59 and sector wise it is 35.89. Hence, it shows that the company’s operations is
not able to generate the profitability from its operations and it is also not up to the benchmark
digital transformation has resulted in to moving to the cloud. The team of the company strives
in creating strategic model of total cost of ownership every five years (Kern et al. 2015).
The effects of the digital transformation is already be seen by the company. The
company has become provider of SaaS, data to reinvent itself, cloud computing and
leveraging the modern and flexible network (Sawhney, Goodman and Broit 2016).
Analysis of Financial Statements
Following are the ratios, which are calculated in order to do the financial analysis:
Return on Capital Employed: It is calculated by dividing PBIT by capital employed (sum
of total debt and shareholders fund). This ratio is calculated to know that how well the
company is utilizing the capital for generating profits. In comparison with the year 2016, the
company’s ROCE was 5.82%, which has grown to 6.59%. However, the industry averages is
7.61% and sector wise it is 0.47%. Hence, the company is able to generate return on the
capital employed in align with the benchmark set by the industry, however, the sector
performance in comparison with other sector is less (Williams and Dobelman 2017).
Return on Capital Employed 2017 2016
Profit Before Interest and Taxes 525.10$ 442.40$
Total Debt 4,729.40$ 4,807.90$
Shareholders Fund 3,243.20$ 2,789.70$
Formula 6.59% 5.82%
Operating Profit Margin: This ratio is calculated by dividing operating profit by revenue. It
measures the percentage of a company’s profit that it has produced from its operations. The
company’s profit margin for the year 2016 and 2017 is 7%, as compare to industry average,
which is 28.59 and sector wise it is 35.89. Hence, it shows that the company’s operations is
not able to generate the profitability from its operations and it is also not up to the benchmark
5ACCOUNTING STATEMENT ANALYSIS
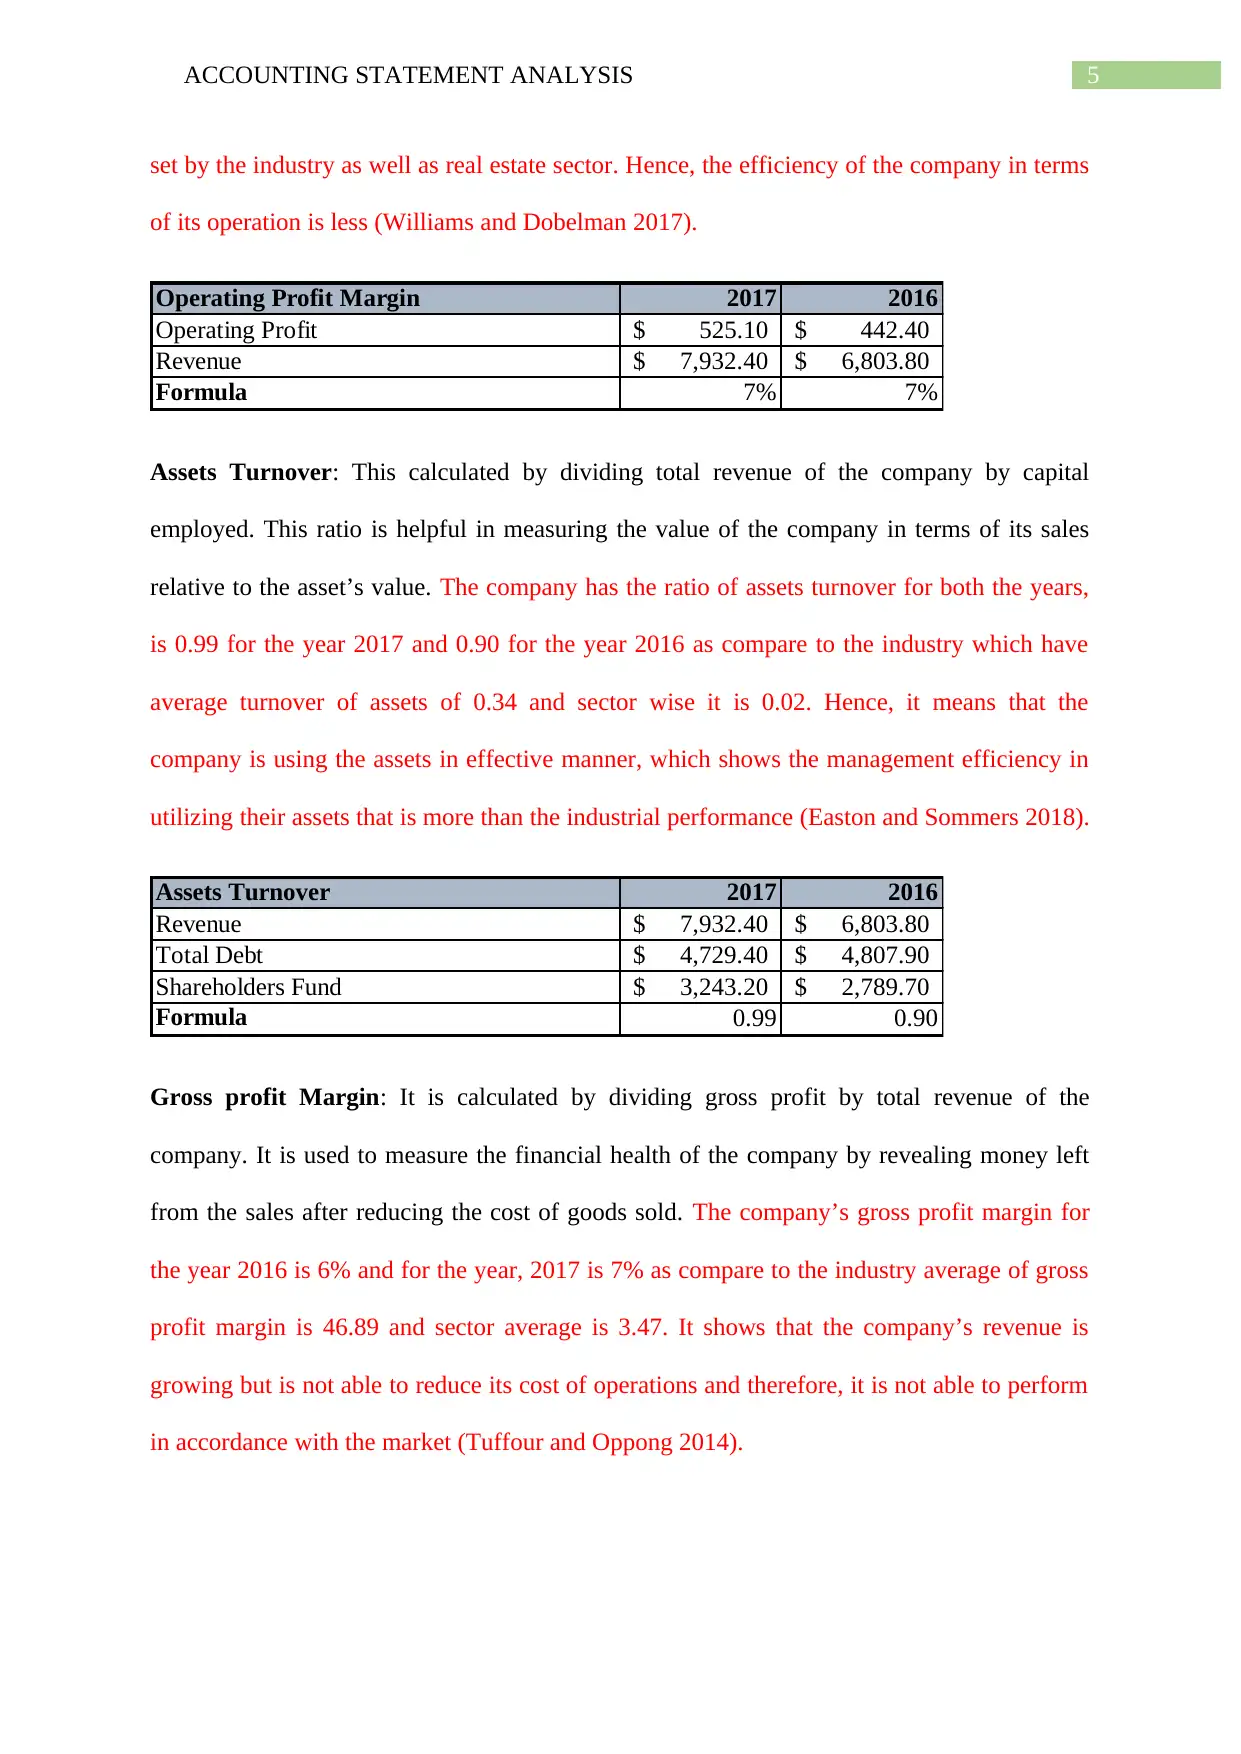
set by the industry as well as real estate sector. Hence, the efficiency of the company in terms
of its operation is less (Williams and Dobelman 2017).
Operating Profit Margin 2017 2016
Operating Profit 525.10$ 442.40$
Revenue 7,932.40$ 6,803.80$
Formula 7% 7%
Assets Turnover: This calculated by dividing total revenue of the company by capital
employed. This ratio is helpful in measuring the value of the company in terms of its sales
relative to the asset’s value. The company has the ratio of assets turnover for both the years,
is 0.99 for the year 2017 and 0.90 for the year 2016 as compare to the industry which have
average turnover of assets of 0.34 and sector wise it is 0.02. Hence, it means that the
company is using the assets in effective manner, which shows the management efficiency in
utilizing their assets that is more than the industrial performance (Easton and Sommers 2018).
Assets Turnover 2017 2016
Revenue 7,932.40$ 6,803.80$
Total Debt 4,729.40$ 4,807.90$
Shareholders Fund 3,243.20$ 2,789.70$
Formula 0.99 0.90
Gross profit Margin: It is calculated by dividing gross profit by total revenue of the
company. It is used to measure the financial health of the company by revealing money left
from the sales after reducing the cost of goods sold. The company’s gross profit margin for
the year 2016 is 6% and for the year, 2017 is 7% as compare to the industry average of gross
profit margin is 46.89 and sector average is 3.47. It shows that the company’s revenue is
growing but is not able to reduce its cost of operations and therefore, it is not able to perform
in accordance with the market (Tuffour and Oppong 2014).
⊘ This is a preview!⊘
Do you want full access?
Subscribe today to unlock all pages.
Trusted by 1+ million students worldwide
6ACCOUNTING STATEMENT ANALYSIS
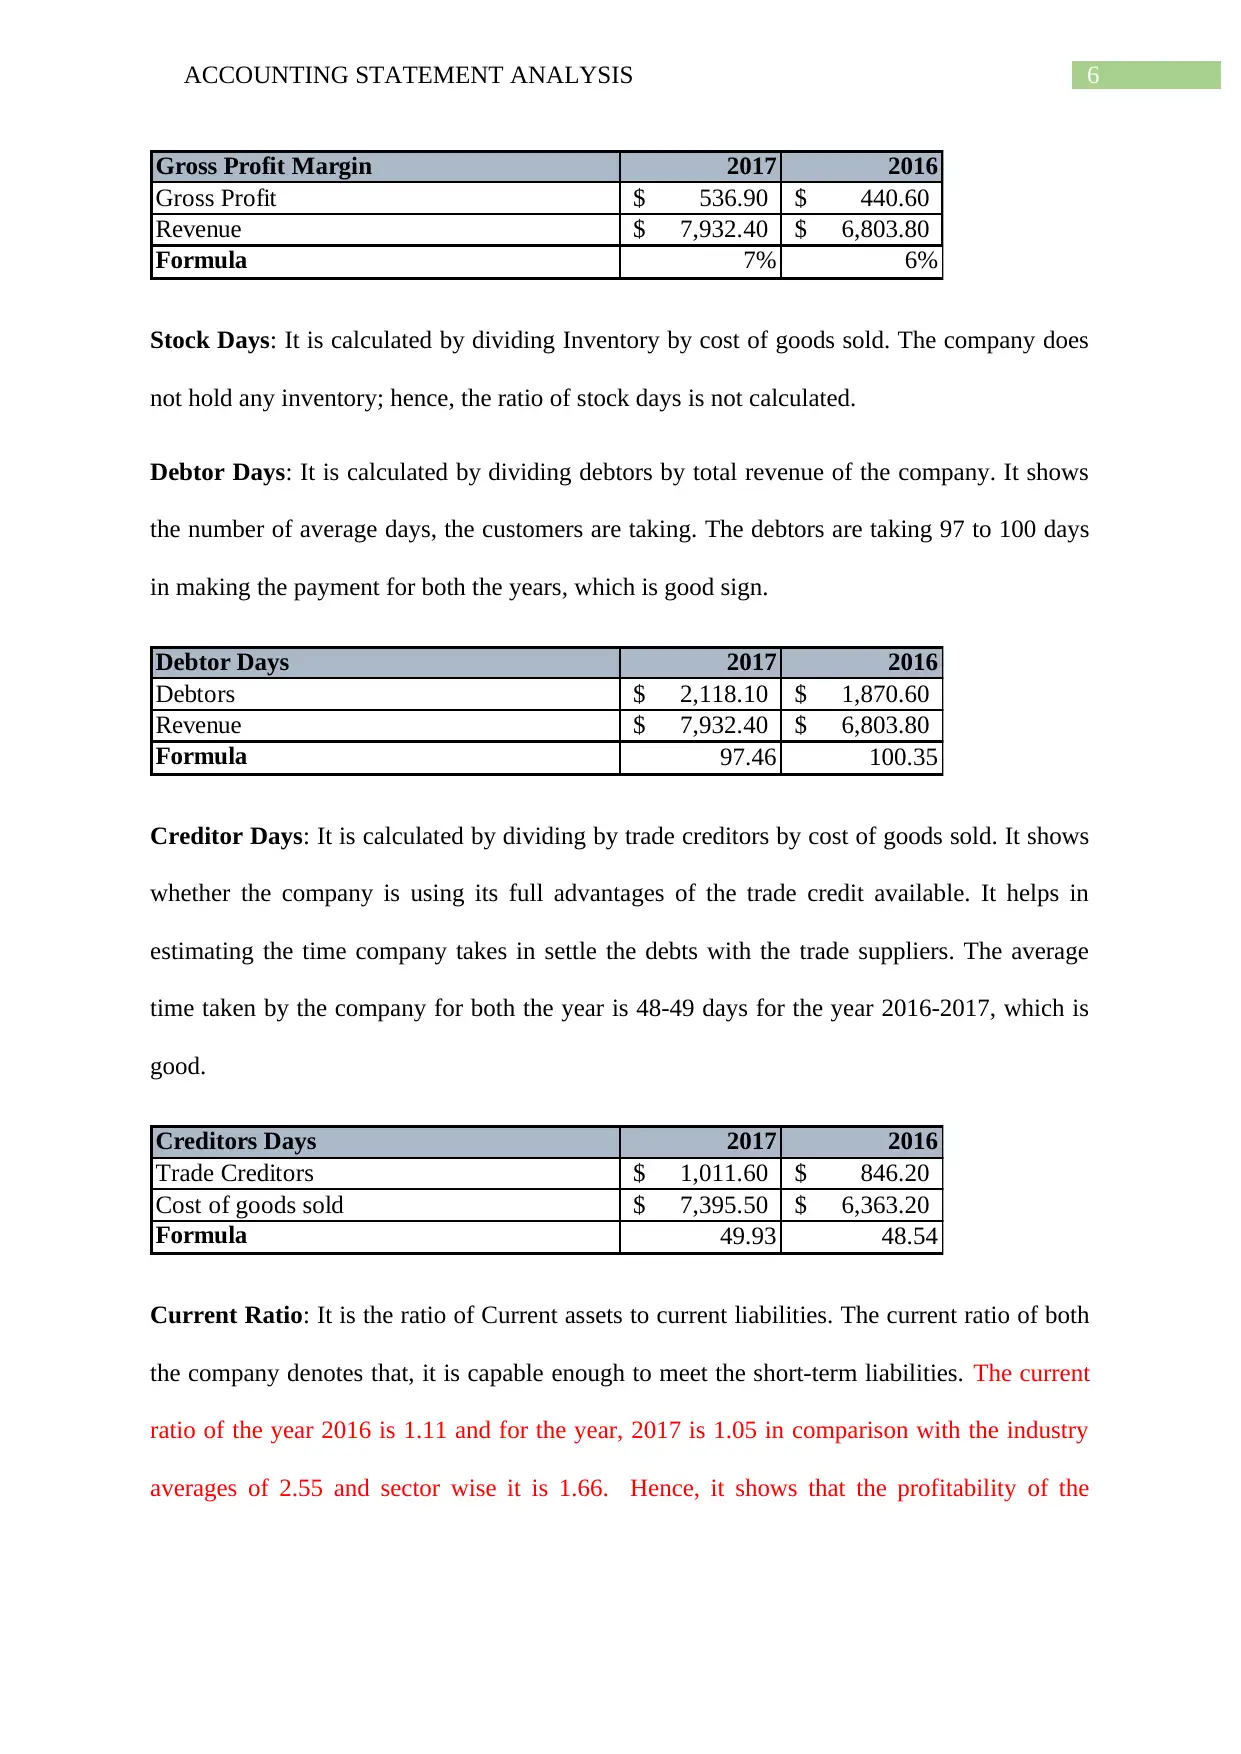
Gross Profit Margin 2017 2016
Gross Profit 536.90$ 440.60$
Revenue 7,932.40$ 6,803.80$
Formula 7% 6%
Stock Days: It is calculated by dividing Inventory by cost of goods sold. The company does
not hold any inventory; hence, the ratio of stock days is not calculated.
Debtor Days: It is calculated by dividing debtors by total revenue of the company. It shows
the number of average days, the customers are taking. The debtors are taking 97 to 100 days
in making the payment for both the years, which is good sign.
Debtor Days 2017 2016
Debtors 2,118.10$ 1,870.60$
Revenue 7,932.40$ 6,803.80$
Formula 97.46 100.35
Creditor Days: It is calculated by dividing by trade creditors by cost of goods sold. It shows
whether the company is using its full advantages of the trade credit available. It helps in
estimating the time company takes in settle the debts with the trade suppliers. The average
time taken by the company for both the year is 48-49 days for the year 2016-2017, which is
good.
Creditors Days 2017 2016
Trade Creditors 1,011.60$ 846.20$
Cost of goods sold 7,395.50$ 6,363.20$
Formula 49.93 48.54
Current Ratio: It is the ratio of Current assets to current liabilities. The current ratio of both
the company denotes that, it is capable enough to meet the short-term liabilities. The current
ratio of the year 2016 is 1.11 and for the year, 2017 is 1.05 in comparison with the industry
averages of 2.55 and sector wise it is 1.66. Hence, it shows that the profitability of the
Paraphrase This Document
Need a fresh take? Get an instant paraphrase of this document with our AI Paraphraser
7ACCOUNTING STATEMENT ANALYSIS
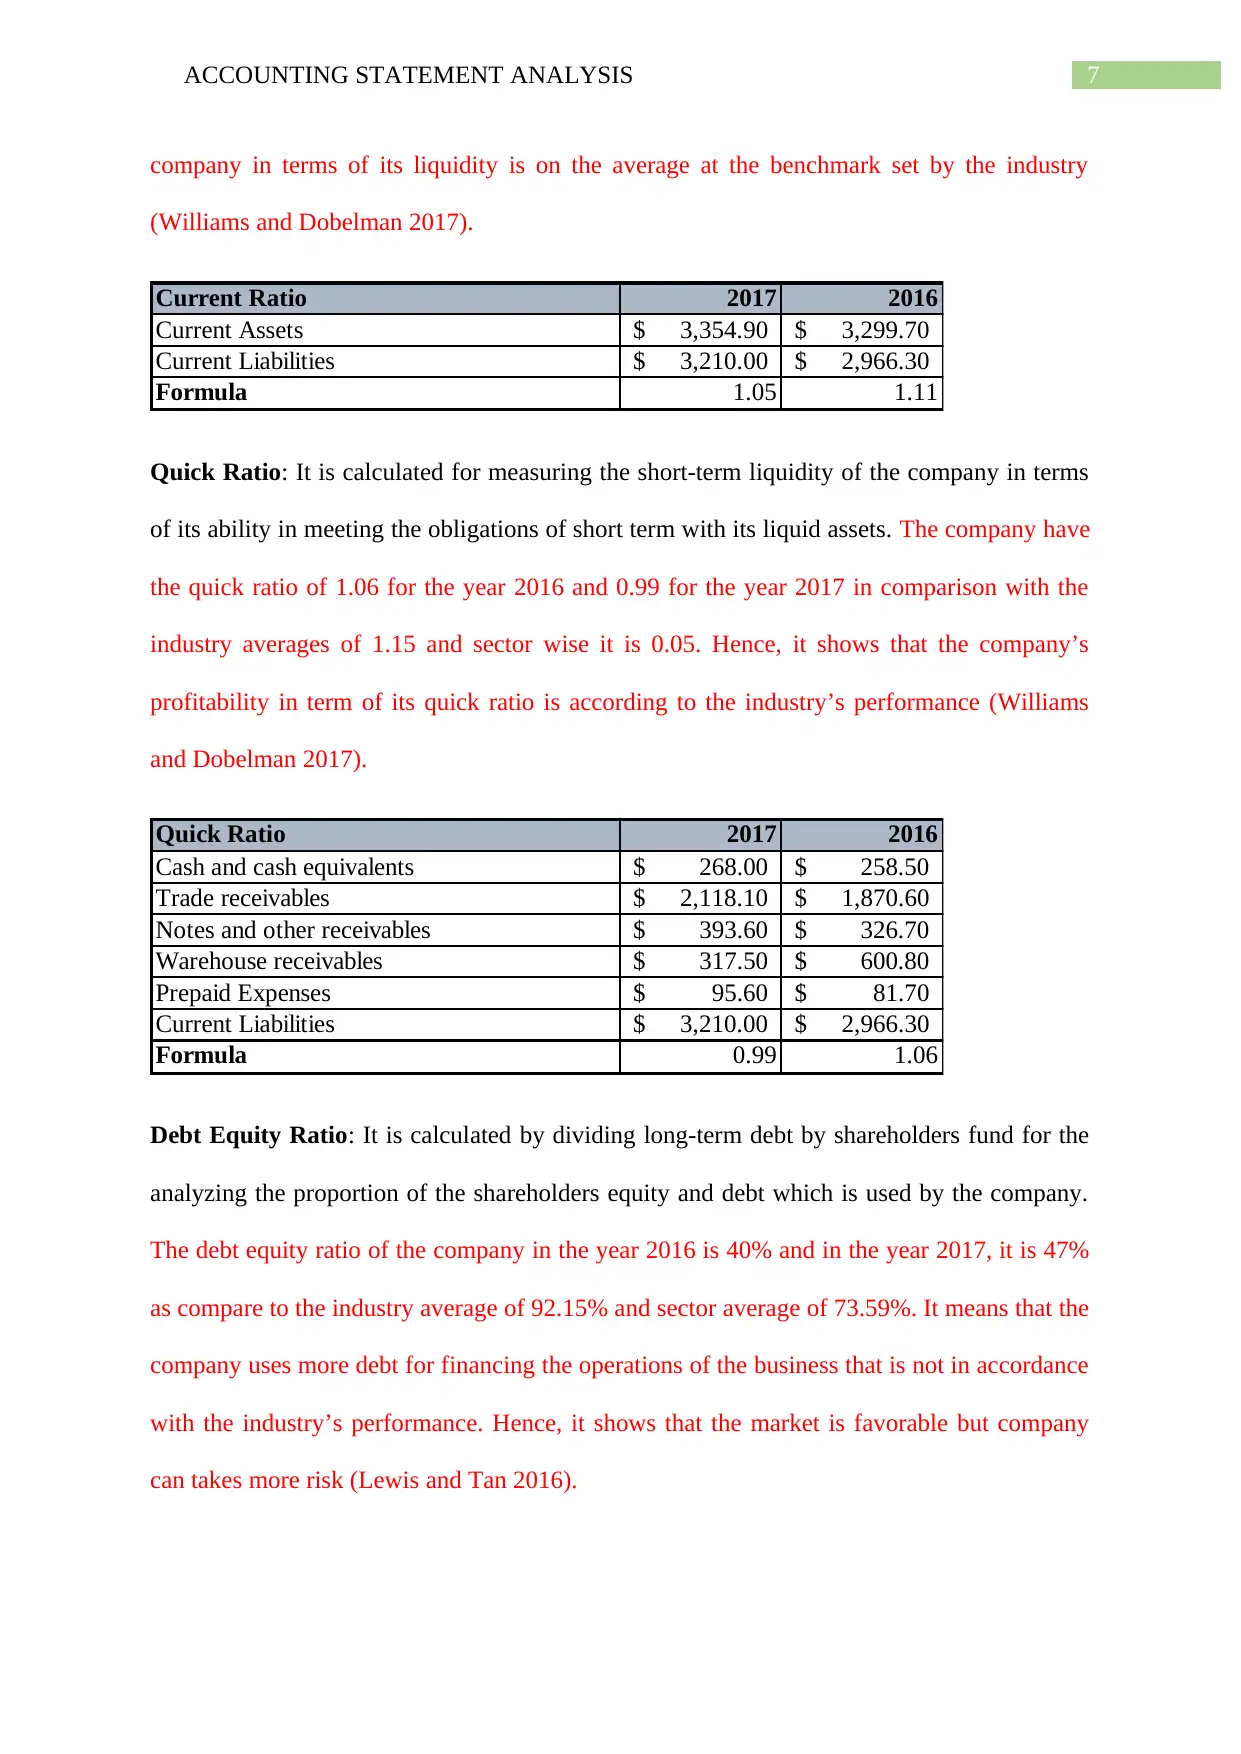
company in terms of its liquidity is on the average at the benchmark set by the industry
(Williams and Dobelman 2017).
Current Ratio 2017 2016
Current Assets 3,354.90$ 3,299.70$
Current Liabilities 3,210.00$ 2,966.30$
Formula 1.05 1.11
Quick Ratio: It is calculated for measuring the short-term liquidity of the company in terms
of its ability in meeting the obligations of short term with its liquid assets. The company have
the quick ratio of 1.06 for the year 2016 and 0.99 for the year 2017 in comparison with the
industry averages of 1.15 and sector wise it is 0.05. Hence, it shows that the company’s
profitability in term of its quick ratio is according to the industry’s performance (Williams
and Dobelman 2017).
Quick Ratio 2017 2016
Cash and cash equivalents 268.00$ 258.50$
Trade receivables 2,118.10$ 1,870.60$
Notes and other receivables 393.60$ 326.70$
Warehouse receivables 317.50$ 600.80$
Prepaid Expenses 95.60$ 81.70$
Current Liabilities 3,210.00$ 2,966.30$
Formula 0.99 1.06
Debt Equity Ratio: It is calculated by dividing long-term debt by shareholders fund for the
analyzing the proportion of the shareholders equity and debt which is used by the company.
The debt equity ratio of the company in the year 2016 is 40% and in the year 2017, it is 47%
as compare to the industry average of 92.15% and sector average of 73.59%. It means that the
company uses more debt for financing the operations of the business that is not in accordance
with the industry’s performance. Hence, it shows that the market is favorable but company
can takes more risk (Lewis and Tan 2016).
8ACCOUNTING STATEMENT ANALYSIS
Debt Equity Ratio 2017 2016
Long Term Debt 1,519.40$ 1,841.60$
Shareholders' Funds 3,243.20$ 2,789.70$
Formula 47% 40%
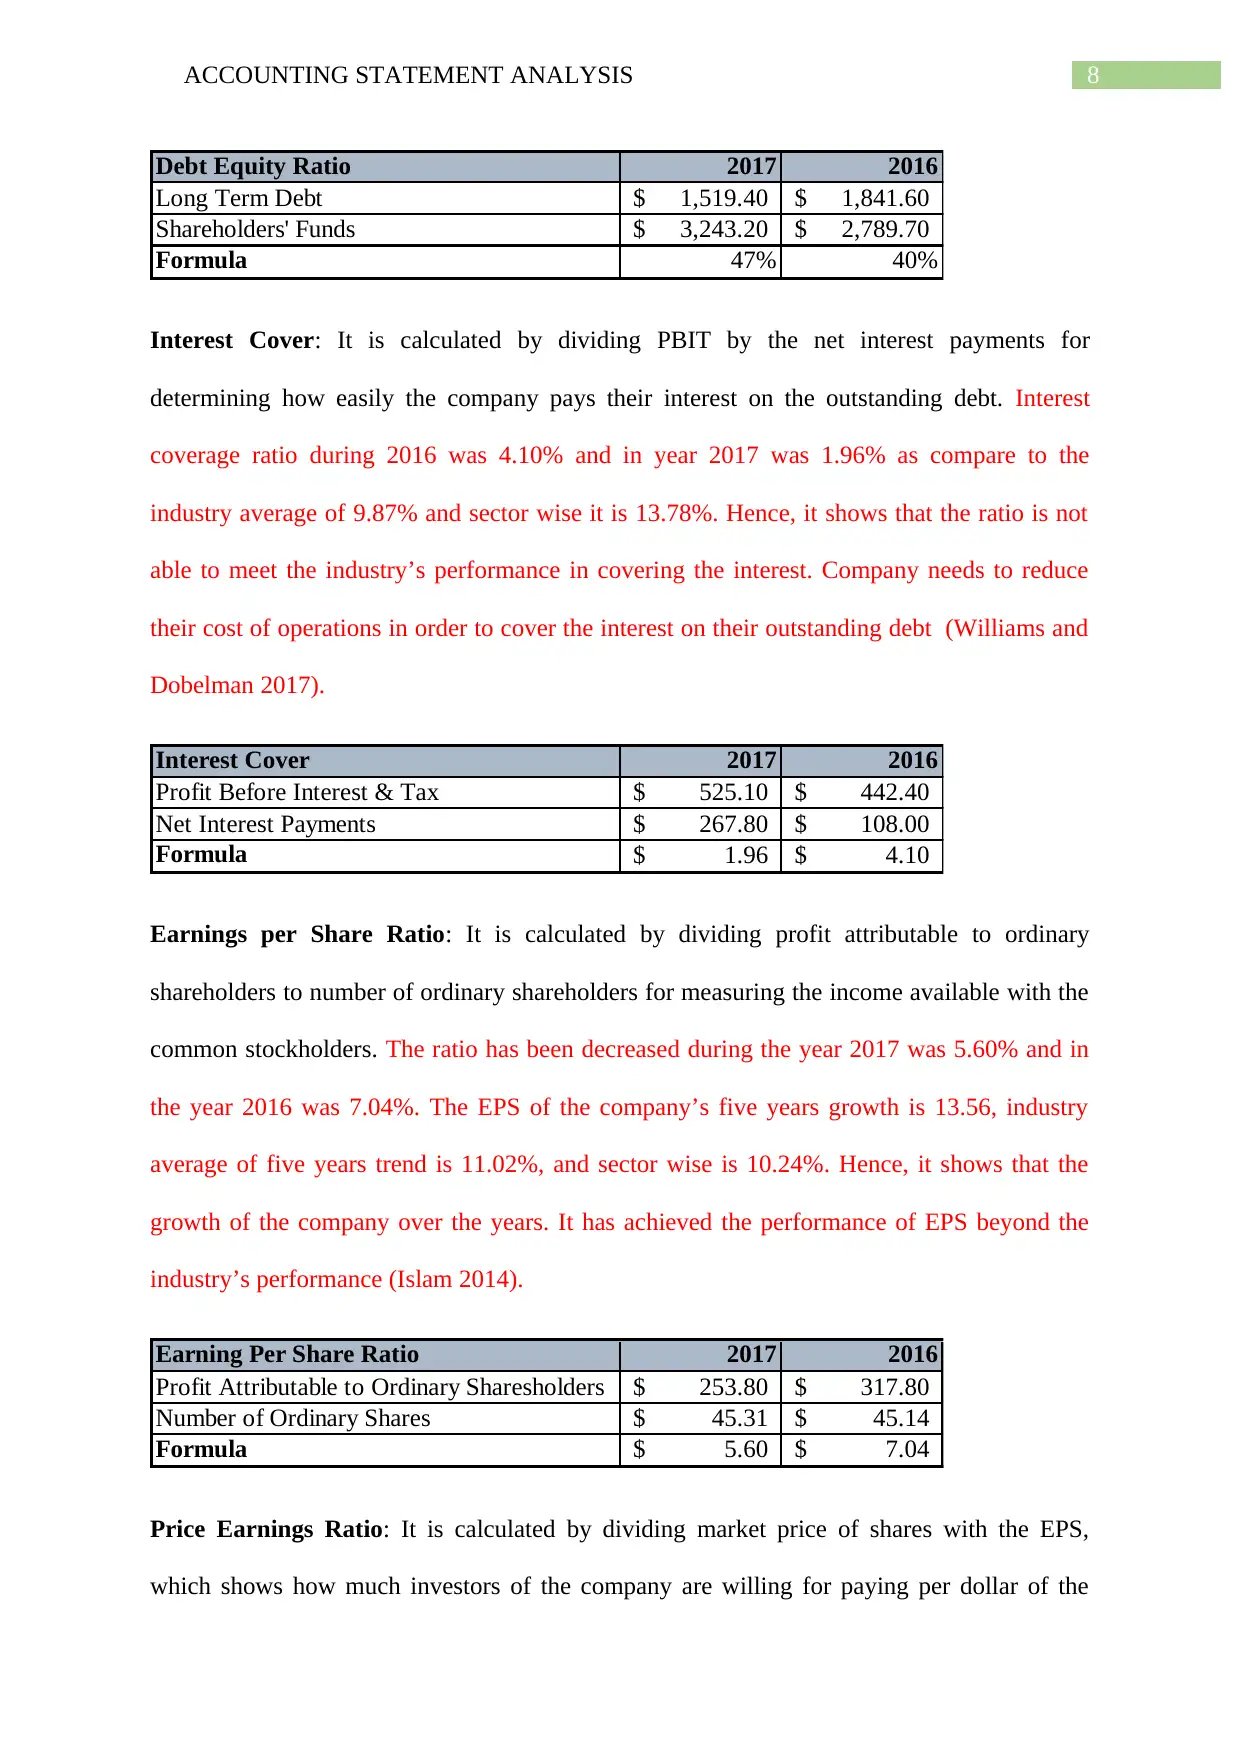
Interest Cover: It is calculated by dividing PBIT by the net interest payments for
determining how easily the company pays their interest on the outstanding debt. Interest
coverage ratio during 2016 was 4.10% and in year 2017 was 1.96% as compare to the
industry average of 9.87% and sector wise it is 13.78%. Hence, it shows that the ratio is not
able to meet the industry’s performance in covering the interest. Company needs to reduce
their cost of operations in order to cover the interest on their outstanding debt (Williams and
Dobelman 2017).
Interest Cover 2017 2016
Profit Before Interest & Tax 525.10$ 442.40$
Net Interest Payments 267.80$ 108.00$
Formula 1.96$ 4.10$
Earnings per Share Ratio: It is calculated by dividing profit attributable to ordinary
shareholders to number of ordinary shareholders for measuring the income available with the
common stockholders. The ratio has been decreased during the year 2017 was 5.60% and in
the year 2016 was 7.04%. The EPS of the company’s five years growth is 13.56, industry
average of five years trend is 11.02%, and sector wise is 10.24%. Hence, it shows that the
growth of the company over the years. It has achieved the performance of EPS beyond the
industry’s performance (Islam 2014).
Earning Per Share Ratio 2017 2016
Profit Attributable to Ordinary Sharesholders 253.80$ 317.80$
Number of Ordinary Shares 45.31$ 45.14$
Formula 5.60$ 7.04$
Price Earnings Ratio: It is calculated by dividing market price of shares with the EPS,
which shows how much investors of the company are willing for paying per dollar of the
Debt Equity Ratio 2017 2016
Long Term Debt 1,519.40$ 1,841.60$
Shareholders' Funds 3,243.20$ 2,789.70$
Formula 47% 40%
Interest Cover: It is calculated by dividing PBIT by the net interest payments for
determining how easily the company pays their interest on the outstanding debt. Interest
coverage ratio during 2016 was 4.10% and in year 2017 was 1.96% as compare to the
industry average of 9.87% and sector wise it is 13.78%. Hence, it shows that the ratio is not
able to meet the industry’s performance in covering the interest. Company needs to reduce
their cost of operations in order to cover the interest on their outstanding debt (Williams and
Dobelman 2017).
Interest Cover 2017 2016
Profit Before Interest & Tax 525.10$ 442.40$
Net Interest Payments 267.80$ 108.00$
Formula 1.96$ 4.10$
Earnings per Share Ratio: It is calculated by dividing profit attributable to ordinary
shareholders to number of ordinary shareholders for measuring the income available with the
common stockholders. The ratio has been decreased during the year 2017 was 5.60% and in
the year 2016 was 7.04%. The EPS of the company’s five years growth is 13.56, industry
average of five years trend is 11.02%, and sector wise is 10.24%. Hence, it shows that the
growth of the company over the years. It has achieved the performance of EPS beyond the
industry’s performance (Islam 2014).
Earning Per Share Ratio 2017 2016
Profit Attributable to Ordinary Sharesholders 253.80$ 317.80$
Number of Ordinary Shares 45.31$ 45.14$
Formula 5.60$ 7.04$
Price Earnings Ratio: It is calculated by dividing market price of shares with the EPS,
which shows how much investors of the company are willing for paying per dollar of the
⊘ This is a preview!⊘
Do you want full access?
Subscribe today to unlock all pages.
Trusted by 1+ million students worldwide
9ACCOUNTING STATEMENT ANALYSIS
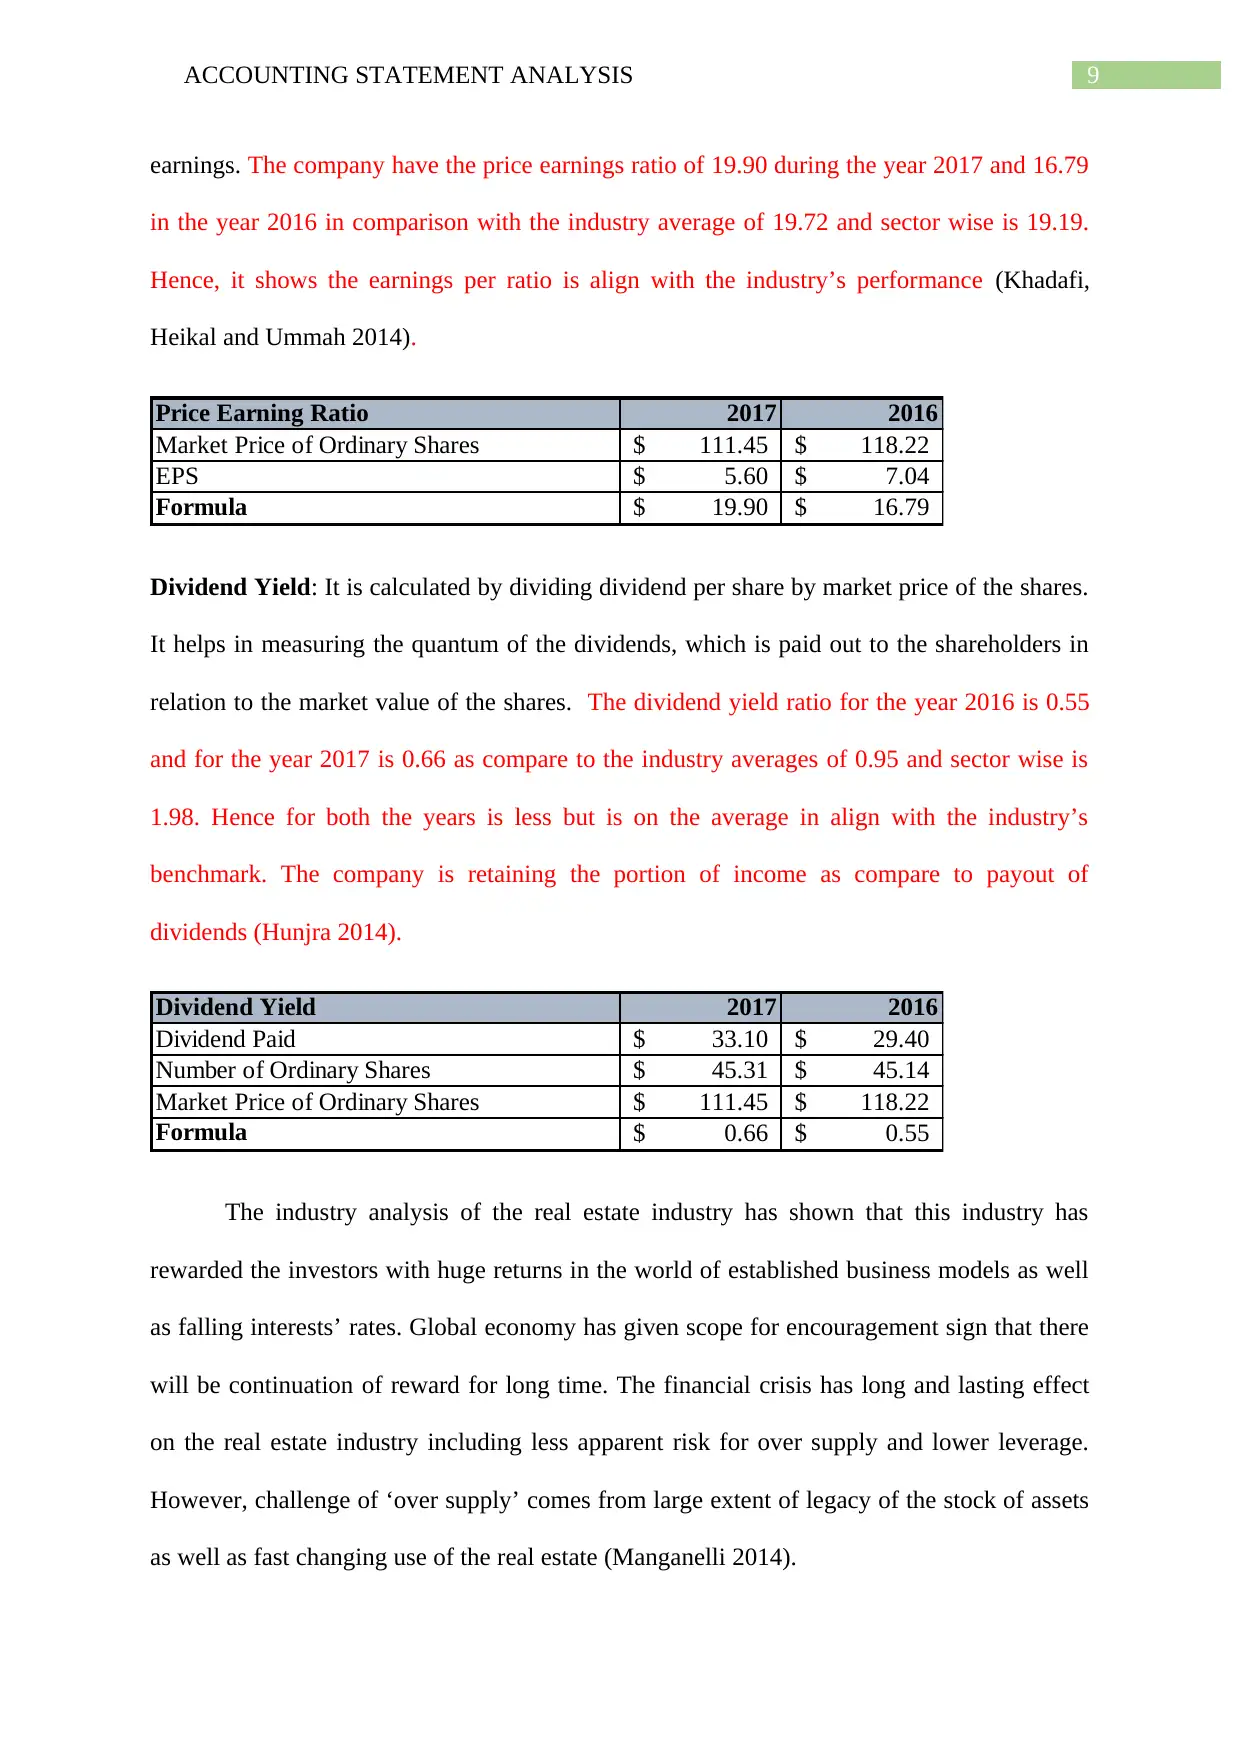
earnings. The company have the price earnings ratio of 19.90 during the year 2017 and 16.79
in the year 2016 in comparison with the industry average of 19.72 and sector wise is 19.19.
Hence, it shows the earnings per ratio is align with the industry’s performance (Khadafi,
Heikal and Ummah 2014).
Price Earning Ratio 2017 2016
Market Price of Ordinary Shares 111.45$ 118.22$
EPS 5.60$ 7.04$
Formula 19.90$ 16.79$
Dividend Yield: It is calculated by dividing dividend per share by market price of the shares.
It helps in measuring the quantum of the dividends, which is paid out to the shareholders in
relation to the market value of the shares. The dividend yield ratio for the year 2016 is 0.55
and for the year 2017 is 0.66 as compare to the industry averages of 0.95 and sector wise is
1.98. Hence for both the years is less but is on the average in align with the industry’s
benchmark. The company is retaining the portion of income as compare to payout of
dividends (Hunjra 2014).
Dividend Yield 2017 2016
Dividend Paid 33.10$ 29.40$
Number of Ordinary Shares 45.31$ 45.14$
Market Price of Ordinary Shares 111.45$ 118.22$
Formula 0.66$ 0.55$
The industry analysis of the real estate industry has shown that this industry has
rewarded the investors with huge returns in the world of established business models as well
as falling interests’ rates. Global economy has given scope for encouragement sign that there
will be continuation of reward for long time. The financial crisis has long and lasting effect
on the real estate industry including less apparent risk for over supply and lower leverage.
However, challenge of ‘over supply’ comes from large extent of legacy of the stock of assets
as well as fast changing use of the real estate (Manganelli 2014).
Paraphrase This Document
Need a fresh take? Get an instant paraphrase of this document with our AI Paraphraser
10ACCOUNTING STATEMENT ANALYSIS
Recommendations
The recommendations that will be as investors for the investment in the company is
that overall performance of the company arevery good both in terms of business and
financial. From the analysis of business strategy of the company it is assessed that the
business model of the company has depicted best practices, innovation and fully integrated
services. The business strategy adopted by the company will lead to increase the value of the
company’s shares, which is ultimately beneficial for investment. From the analysis of
financial statement of the company, it has been assessed that the performance of the company
in term of profitability, liquidity as well as solvency is very good for both the year. However,
company should try to increase the current ratio, earning per shares and interest coverage
ratio. Therefore, it is highly recommended for doing investment in this company because it
has greater prospect for growth of the company in future.
Conclusion
Hence, it can be concluded that the ability of the company in creating and delivering
the value to the clients globally has driven the revenue and profits of the company, which in
turn is invested in the business and the clients in order to improve productivity and
shareholders value. It has been accessed that the company is dedicated to adapt to the new
opportunities and challenges by their long-term approach towards business, strong
intellectual capital as well as ability to anticipate, interpret and respond to the trends, which
affect the industry sector.

11ACCOUNTING STATEMENT ANALYSIS
⊘ This is a preview!⊘
Do you want full access?
Subscribe today to unlock all pages.
Trusted by 1+ million students worldwide
1 out of 17
Related Documents


Your All-in-One AI-Powered Toolkit for Academic Success.
+13062052269
info@desklib.com
Available 24*7 on WhatsApp / Email
![[object Object]](/_next/static/media/star-bottom.7253800d.svg)
Unlock your academic potential
Copyright © 2020–2026 A2Z Services. All Rights Reserved. Developed and managed by ZUCOL.