Financial Analysis of John Lewis: ACC336 Report and Recommendations
VerifiedAdded on 2023/04/20
|19
|3900
|266
Report
AI Summary
This report provides a detailed financial analysis of John Lewis, a prominent UK department store chain. The analysis, conducted using ratio analysis techniques, evaluates the company's profitability, efficiency, liquidity, and leverage positions over a four-year period. The report begins with an executive summary, followed by an introduction providing general information about the company, including its history, market position, and competitors, supported by SWOT and Porter's Five Forces analyses. The core of the report focuses on key financial ratios, including profitability (net profit margin, return on equity, return on capital employed), liquidity (current ratio, quick ratio), efficiency (inventory turnover), and leverage (gearing ratio), with graphical representations for clarity. The analysis reveals positive trends and strong financial performance, leading to a conclusion and recommendations for potential investors. The report aims to assist investors in making informed decisions regarding the company's investment potential.
1
Financial Analysis in Business
ACC336
Financial Analysis in Business
ACC336
Paraphrase This Document
Need a fresh take? Get an instant paraphrase of this document with our AI Paraphraser
2
Executive Summary
John Lewis is a recognized chain of department stores operating across the UK offering
diverse range of products through both offline and online challenges to its target customers. The
report as such has conducted financial analysis of the company to provide recommendations for a
potential investor. The financial analysis has been conducted with the use of ratio analysis
technique which has analyzed profitability, efficiency, liquidity and leverage position of the
company. It has been depicted through the financial ratio analysis that the company has good
future growth prospects on account of its strong financial performance.
3
Contents
Executive Summary.........................................................................................................................2
Introduction......................................................................................................................................4
General Information of Company....................................................................................................4
Brief History................................................................................................................................4
Market Position and Information about its competitors...............................................................4
Swot Analysis...........................................................................................................................4
Porte five forces Analysis.........................................................................................................5
Comparison of John Lewis performance with its competitor......................................................6
Key aspects of the company performance through using ratio analysis as an important tool.........7
Profitability Ratio.........................................................................................................................7
Liquidity Ratios..........................................................................................................................10
Asset management ratio or efficiency ratio...............................................................................12
Gearing Ratio or Leverage Ratio...............................................................................................13
Conclusion & Recommendation....................................................................................................15
References......................................................................................................................................17
Appendix........................................................................................................................................19
⊘ This is a preview!⊘
Do you want full access?
Subscribe today to unlock all pages.
Trusted by 1+ million students worldwide
4
Introduction
The present report is developed for undertaking financial analysis of a selected UK public
listed company in order to provide support to potential investors for taking accurate investment
decisions having very little knowledge. In this context, it has specifically provided a general
description of the company including details about its market performance and key competitors.
This is followed by conducting an analysis of the financial performance of the company through
the use of ratio analysis technique. Lastly, it provides an overall summary of the key findings
generated from the report for facilitating the investment taking decisions of a potential investor.
General Information of Company
Brief History
John Lewis and Partners is an established chain of department stores operating within the
UK. The chain of department stores of the company is owned by John Lewis Partnership and at
present known to operate about 51 stores across England, Scotland and Wales. It has been
established within the year 1929 and since then has achieved a distinctive position in the
competitive retail market of the UK. The company operates within the retail sector of the UK
and is regarded to be the third largest company by sales within the retail sector of the country.
The company deals in with retailing large number of products such as clothing, watches, jewelry,
electrical, cosmetics, furniture and financial services (John Lewis & Partners, 2019).
Market Position and Information about its competitors
John Lewis has achieved a dominant position within the retail market of the UK has also
outperformed the market within the year 2017 by enhancing its sales by about 2.8%. The sales
growth is mainly driven by the online platform that accounts for about 22% of the overall
merchandise sales. It has achieved sales growth mainly in the sectors such as Fashion, Home,
Electricals and Home Technology and thus reported higher profits. It has achieved distinctive
competitive advantage within the retail sector on account of its product quality, value and
product innovation (Voinea, 2016). The SWOT and Porter five force analysis of the company is
carried out as follows to gain an insight into its current market position:
Paraphrase This Document
Need a fresh take? Get an instant paraphrase of this document with our AI Paraphraser
5
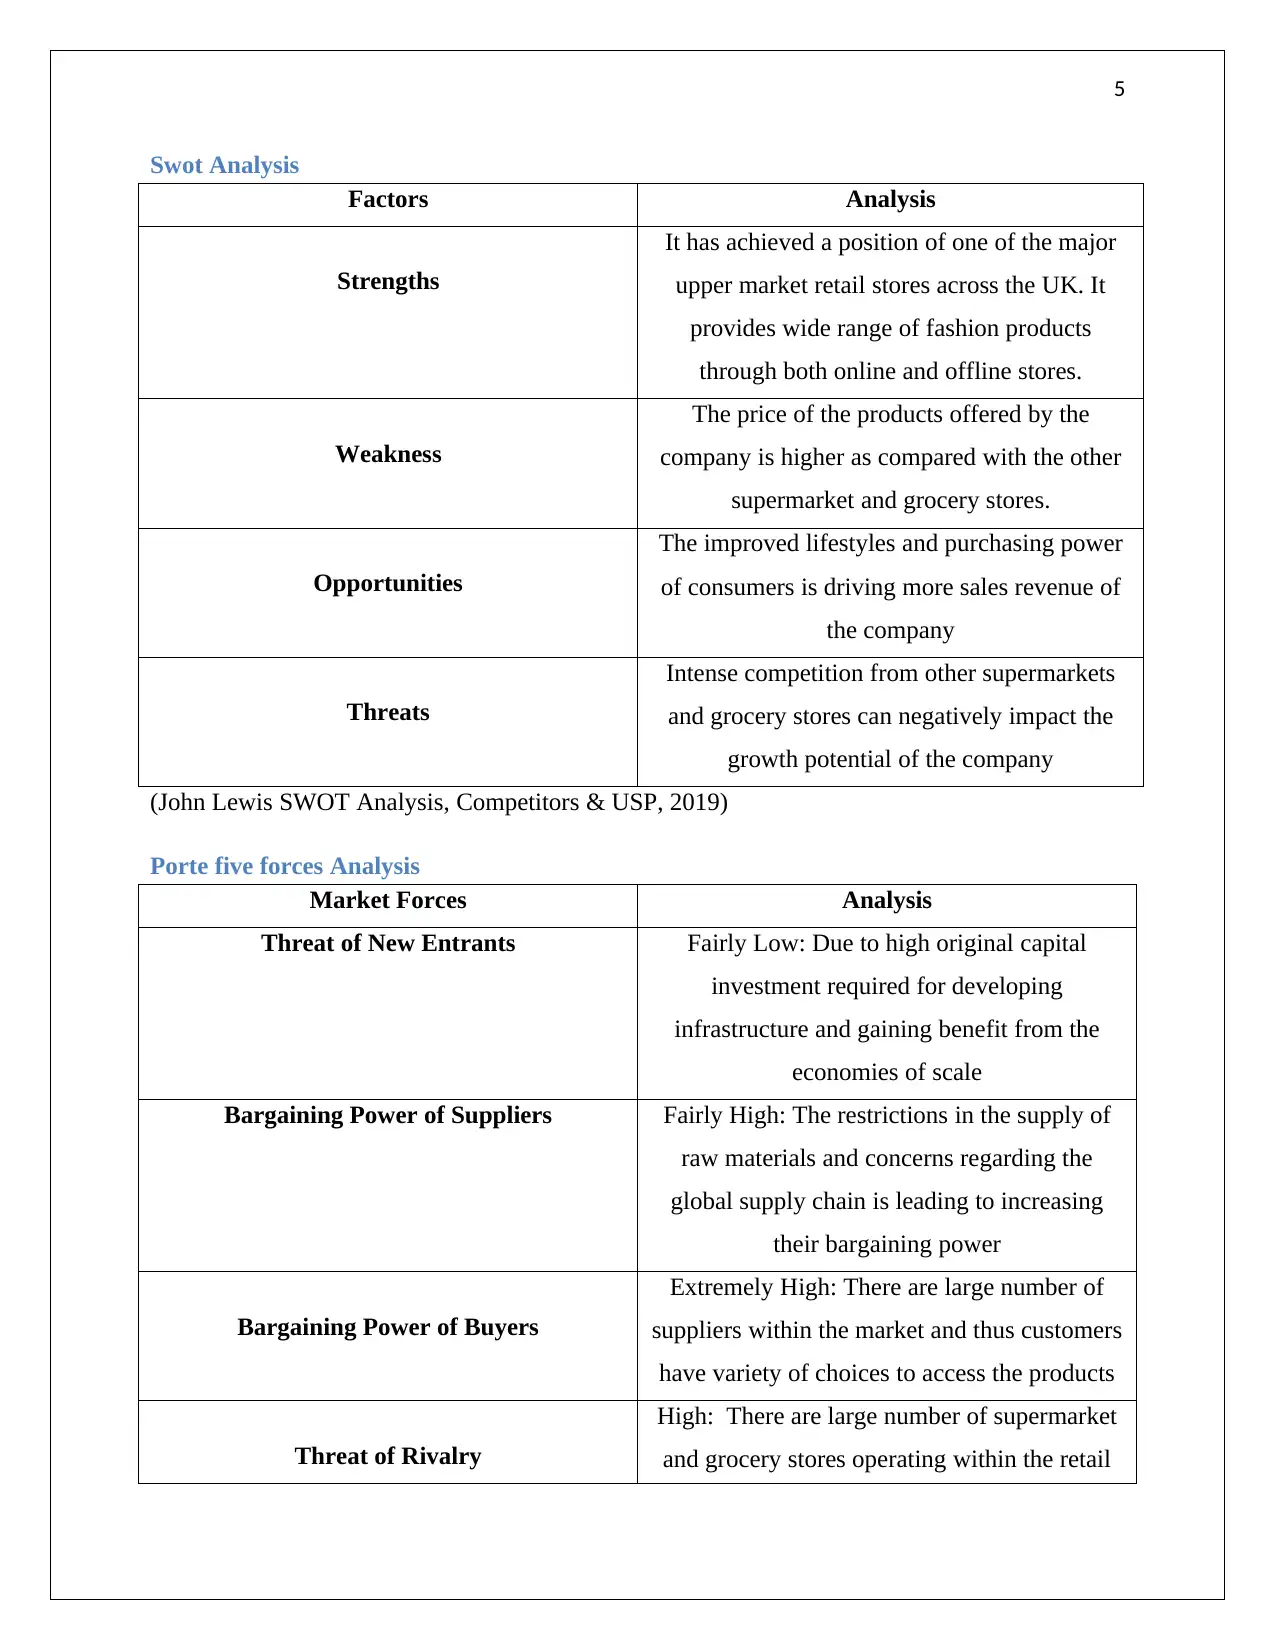
Swot Analysis
Factors Analysis
Strengths
It has achieved a position of one of the major
upper market retail stores across the UK. It
provides wide range of fashion products
through both online and offline stores.
Weakness
The price of the products offered by the
company is higher as compared with the other
supermarket and grocery stores.
Opportunities
The improved lifestyles and purchasing power
of consumers is driving more sales revenue of
the company
Threats
Intense competition from other supermarkets
and grocery stores can negatively impact the
growth potential of the company
(John Lewis SWOT Analysis, Competitors & USP, 2019)
Porte five forces Analysis
Market Forces Analysis
Threat of New Entrants Fairly Low: Due to high original capital
investment required for developing
infrastructure and gaining benefit from the
economies of scale
Bargaining Power of Suppliers Fairly High: The restrictions in the supply of
raw materials and concerns regarding the
global supply chain is leading to increasing
their bargaining power
Bargaining Power of Buyers
Extremely High: There are large number of
suppliers within the market and thus customers
have variety of choices to access the products
Threat of Rivalry
High: There are large number of supermarket
and grocery stores operating within the retail
6
sector of the UK and thus making level of
competition too high
Threat of Substitutes
Low: The threat of substitutes is very low in
terms of specific retail product requirements by
the customers
(Bäder, 2016)
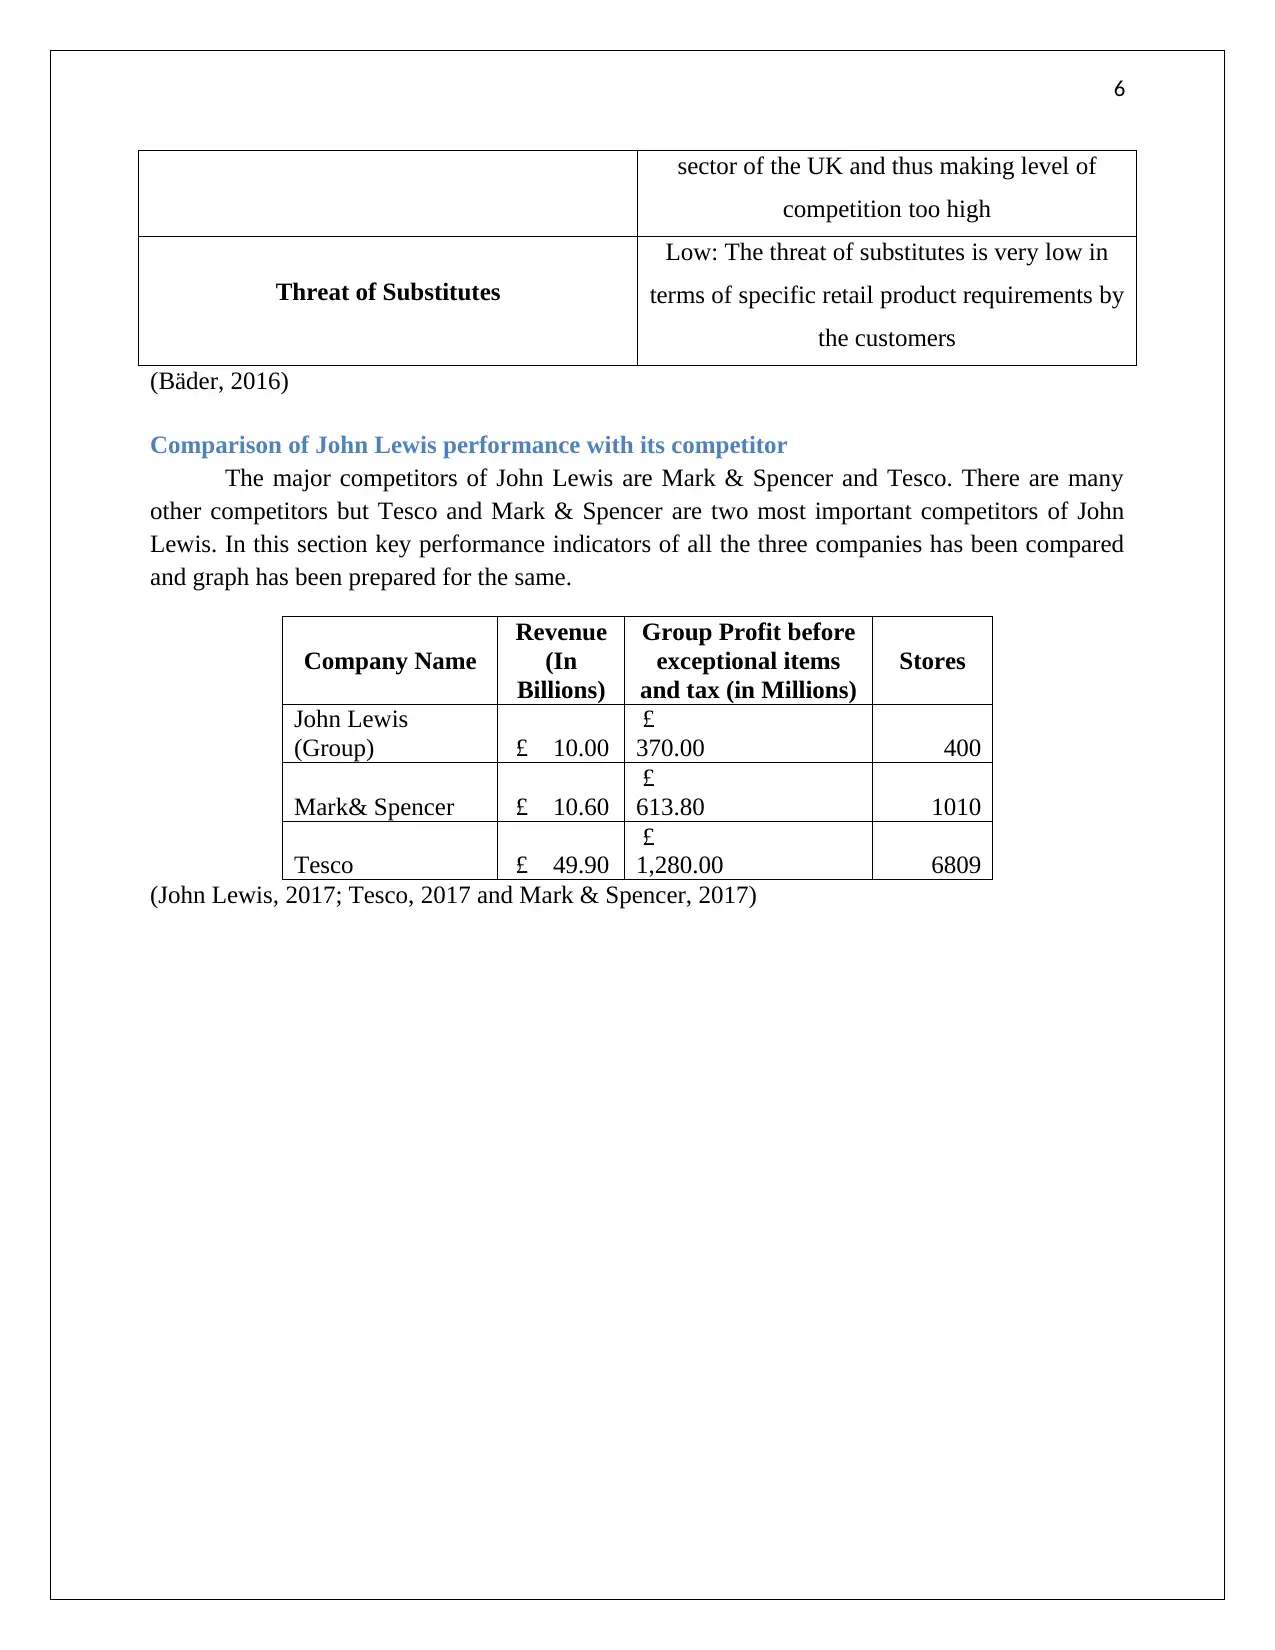
Comparison of John Lewis performance with its competitor
The major competitors of John Lewis are Mark & Spencer and Tesco. There are many
other competitors but Tesco and Mark & Spencer are two most important competitors of John
Lewis. In this section key performance indicators of all the three companies has been compared
and graph has been prepared for the same.
Company Name
Revenue
(In
Billions)
Group Profit before
exceptional items
and tax (in Millions)
Stores
John Lewis
(Group) £ 10.00
£
370.00 400
Mark& Spencer £ 10.60
£
613.80 1010
Tesco £ 49.90
£
1,280.00 6809
(John Lewis, 2017; Tesco, 2017 and Mark & Spencer, 2017)
sector of the UK and thus making level of
competition too high
Threat of Substitutes
Low: The threat of substitutes is very low in
terms of specific retail product requirements by
the customers
(Bäder, 2016)
Comparison of John Lewis performance with its competitor
The major competitors of John Lewis are Mark & Spencer and Tesco. There are many
other competitors but Tesco and Mark & Spencer are two most important competitors of John
Lewis. In this section key performance indicators of all the three companies has been compared
and graph has been prepared for the same.
Company Name
Revenue
(In
Billions)
Group Profit before
exceptional items
and tax (in Millions)
Stores
John Lewis
(Group) £ 10.00
£
370.00 400
Mark& Spencer £ 10.60
£
613.80 1010
Tesco £ 49.90
£
1,280.00 6809
(John Lewis, 2017; Tesco, 2017 and Mark & Spencer, 2017)
⊘ This is a preview!⊘
Do you want full access?
Subscribe today to unlock all pages.
Trusted by 1+ million students worldwide
7
Revenue (In Billion) Group Profit before
expectional items and tax
(in Million)
Stores
£-
£1,000.00
£2,000.00
£3,000.00
£4,000.00
£5,000.00
£6,000.00
£7,000.00
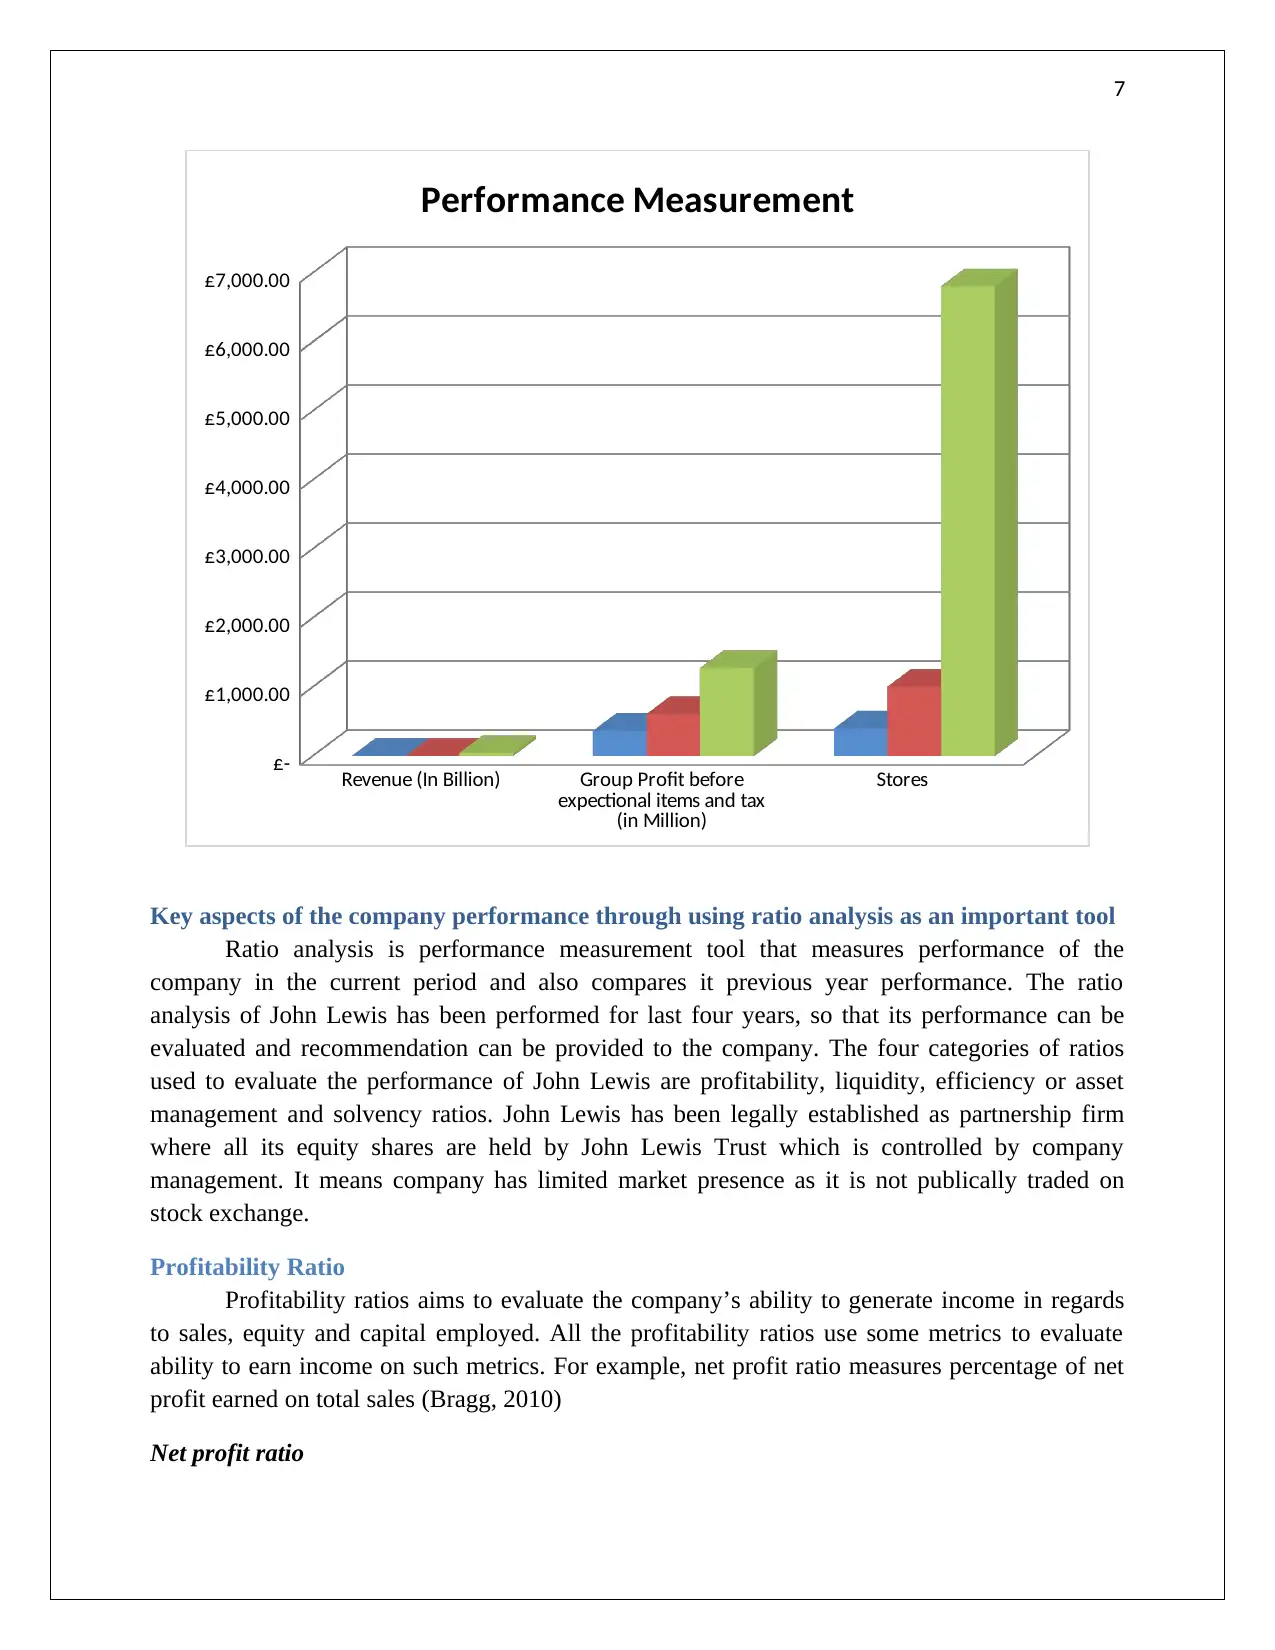
Performance Measurement
Key aspects of the company performance through using ratio analysis as an important tool
Ratio analysis is performance measurement tool that measures performance of the
company in the current period and also compares it previous year performance. The ratio
analysis of John Lewis has been performed for last four years, so that its performance can be
evaluated and recommendation can be provided to the company. The four categories of ratios
used to evaluate the performance of John Lewis are profitability, liquidity, efficiency or asset
management and solvency ratios. John Lewis has been legally established as partnership firm
where all its equity shares are held by John Lewis Trust which is controlled by company
management. It means company has limited market presence as it is not publically traded on
stock exchange.
Profitability Ratio
Profitability ratios aims to evaluate the company’s ability to generate income in regards
to sales, equity and capital employed. All the profitability ratios use some metrics to evaluate
ability to earn income on such metrics. For example, net profit ratio measures percentage of net
profit earned on total sales (Bragg, 2010)
Net profit ratio
Revenue (In Billion) Group Profit before
expectional items and tax
(in Million)
Stores
£-
£1,000.00
£2,000.00
£3,000.00
£4,000.00
£5,000.00
£6,000.00
£7,000.00
Performance Measurement
Key aspects of the company performance through using ratio analysis as an important tool
Ratio analysis is performance measurement tool that measures performance of the
company in the current period and also compares it previous year performance. The ratio
analysis of John Lewis has been performed for last four years, so that its performance can be
evaluated and recommendation can be provided to the company. The four categories of ratios
used to evaluate the performance of John Lewis are profitability, liquidity, efficiency or asset
management and solvency ratios. John Lewis has been legally established as partnership firm
where all its equity shares are held by John Lewis Trust which is controlled by company
management. It means company has limited market presence as it is not publically traded on
stock exchange.
Profitability Ratio
Profitability ratios aims to evaluate the company’s ability to generate income in regards
to sales, equity and capital employed. All the profitability ratios use some metrics to evaluate
ability to earn income on such metrics. For example, net profit ratio measures percentage of net
profit earned on total sales (Bragg, 2010)
Net profit ratio
Paraphrase This Document
Need a fresh take? Get an instant paraphrase of this document with our AI Paraphraser
8
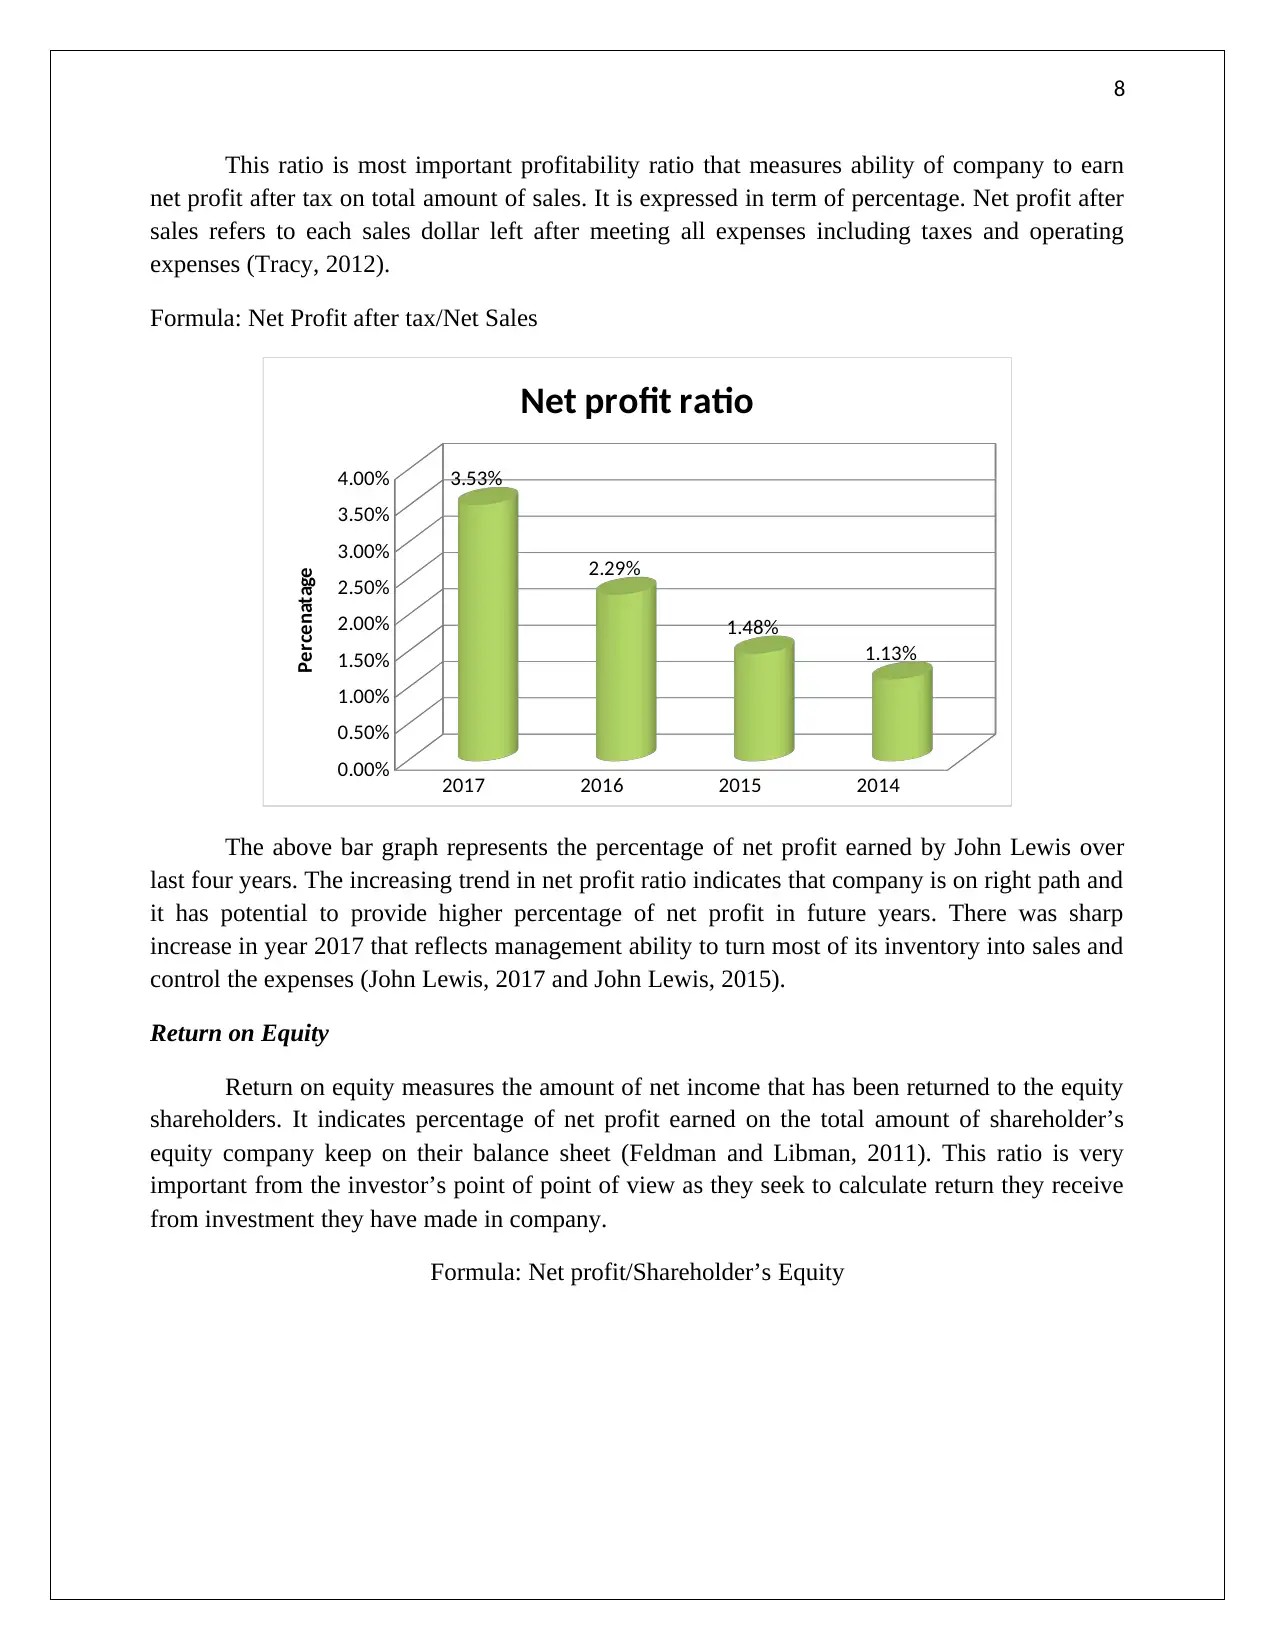
This ratio is most important profitability ratio that measures ability of company to earn
net profit after tax on total amount of sales. It is expressed in term of percentage. Net profit after
sales refers to each sales dollar left after meeting all expenses including taxes and operating
expenses (Tracy, 2012).
Formula: Net Profit after tax/Net Sales
2017 2016 2015 2014
0.00%
0.50%
1.00%
1.50%
2.00%
2.50%
3.00%
3.50%
4.00% 3.53%
2.29%
1.48%
1.13%
Net profit ratio
Percenatage
The above bar graph represents the percentage of net profit earned by John Lewis over
last four years. The increasing trend in net profit ratio indicates that company is on right path and
it has potential to provide higher percentage of net profit in future years. There was sharp
increase in year 2017 that reflects management ability to turn most of its inventory into sales and
control the expenses (John Lewis, 2017 and John Lewis, 2015).
Return on Equity
Return on equity measures the amount of net income that has been returned to the equity
shareholders. It indicates percentage of net profit earned on the total amount of shareholder’s
equity company keep on their balance sheet (Feldman and Libman, 2011). This ratio is very
important from the investor’s point of point of view as they seek to calculate return they receive
from investment they have made in company.
Formula: Net profit/Shareholder’s Equity
9
2017 2016 2015 2014
0.00%
2.00%
4.00%
6.00%
8.00%
10.00%
12.00%
14.00%
16.00%
18.00%
Return on equity
Percentage
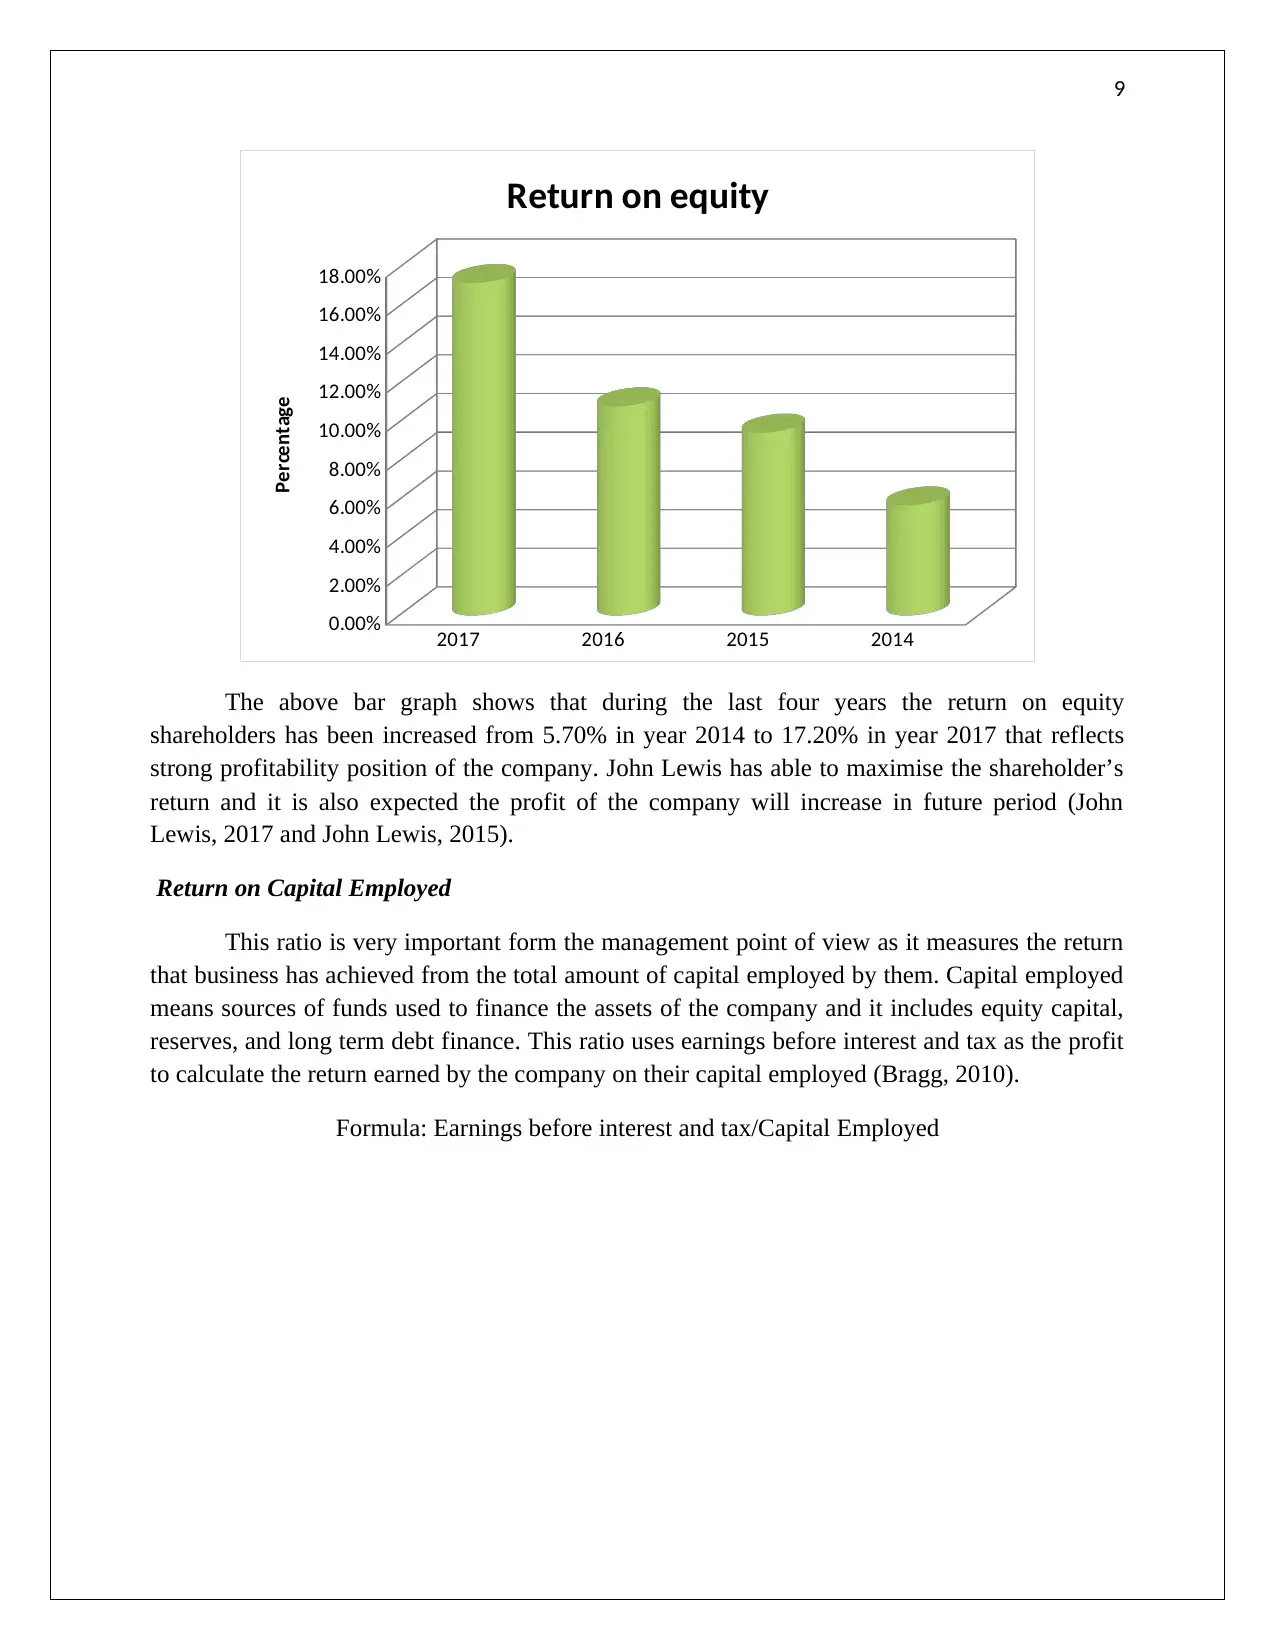
The above bar graph shows that during the last four years the return on equity
shareholders has been increased from 5.70% in year 2014 to 17.20% in year 2017 that reflects
strong profitability position of the company. John Lewis has able to maximise the shareholder’s
return and it is also expected the profit of the company will increase in future period (John
Lewis, 2017 and John Lewis, 2015).
Return on Capital Employed
This ratio is very important form the management point of view as it measures the return
that business has achieved from the total amount of capital employed by them. Capital employed
means sources of funds used to finance the assets of the company and it includes equity capital,
reserves, and long term debt finance. This ratio uses earnings before interest and tax as the profit
to calculate the return earned by the company on their capital employed (Bragg, 2010).
Formula: Earnings before interest and tax/Capital Employed
2017 2016 2015 2014
0.00%
2.00%
4.00%
6.00%
8.00%
10.00%
12.00%
14.00%
16.00%
18.00%
Return on equity
Percentage
The above bar graph shows that during the last four years the return on equity
shareholders has been increased from 5.70% in year 2014 to 17.20% in year 2017 that reflects
strong profitability position of the company. John Lewis has able to maximise the shareholder’s
return and it is also expected the profit of the company will increase in future period (John
Lewis, 2017 and John Lewis, 2015).
Return on Capital Employed
This ratio is very important form the management point of view as it measures the return
that business has achieved from the total amount of capital employed by them. Capital employed
means sources of funds used to finance the assets of the company and it includes equity capital,
reserves, and long term debt finance. This ratio uses earnings before interest and tax as the profit
to calculate the return earned by the company on their capital employed (Bragg, 2010).
Formula: Earnings before interest and tax/Capital Employed
⊘ This is a preview!⊘
Do you want full access?
Subscribe today to unlock all pages.
Trusted by 1+ million students worldwide
10
2017 2016 2015 2014
0.00%
2.00%
4.00%
6.00%
8.00%
10.00%
12.00% 10.33%
8.55%
10.82% 11.09%
Return on Capital Employed
Percentage
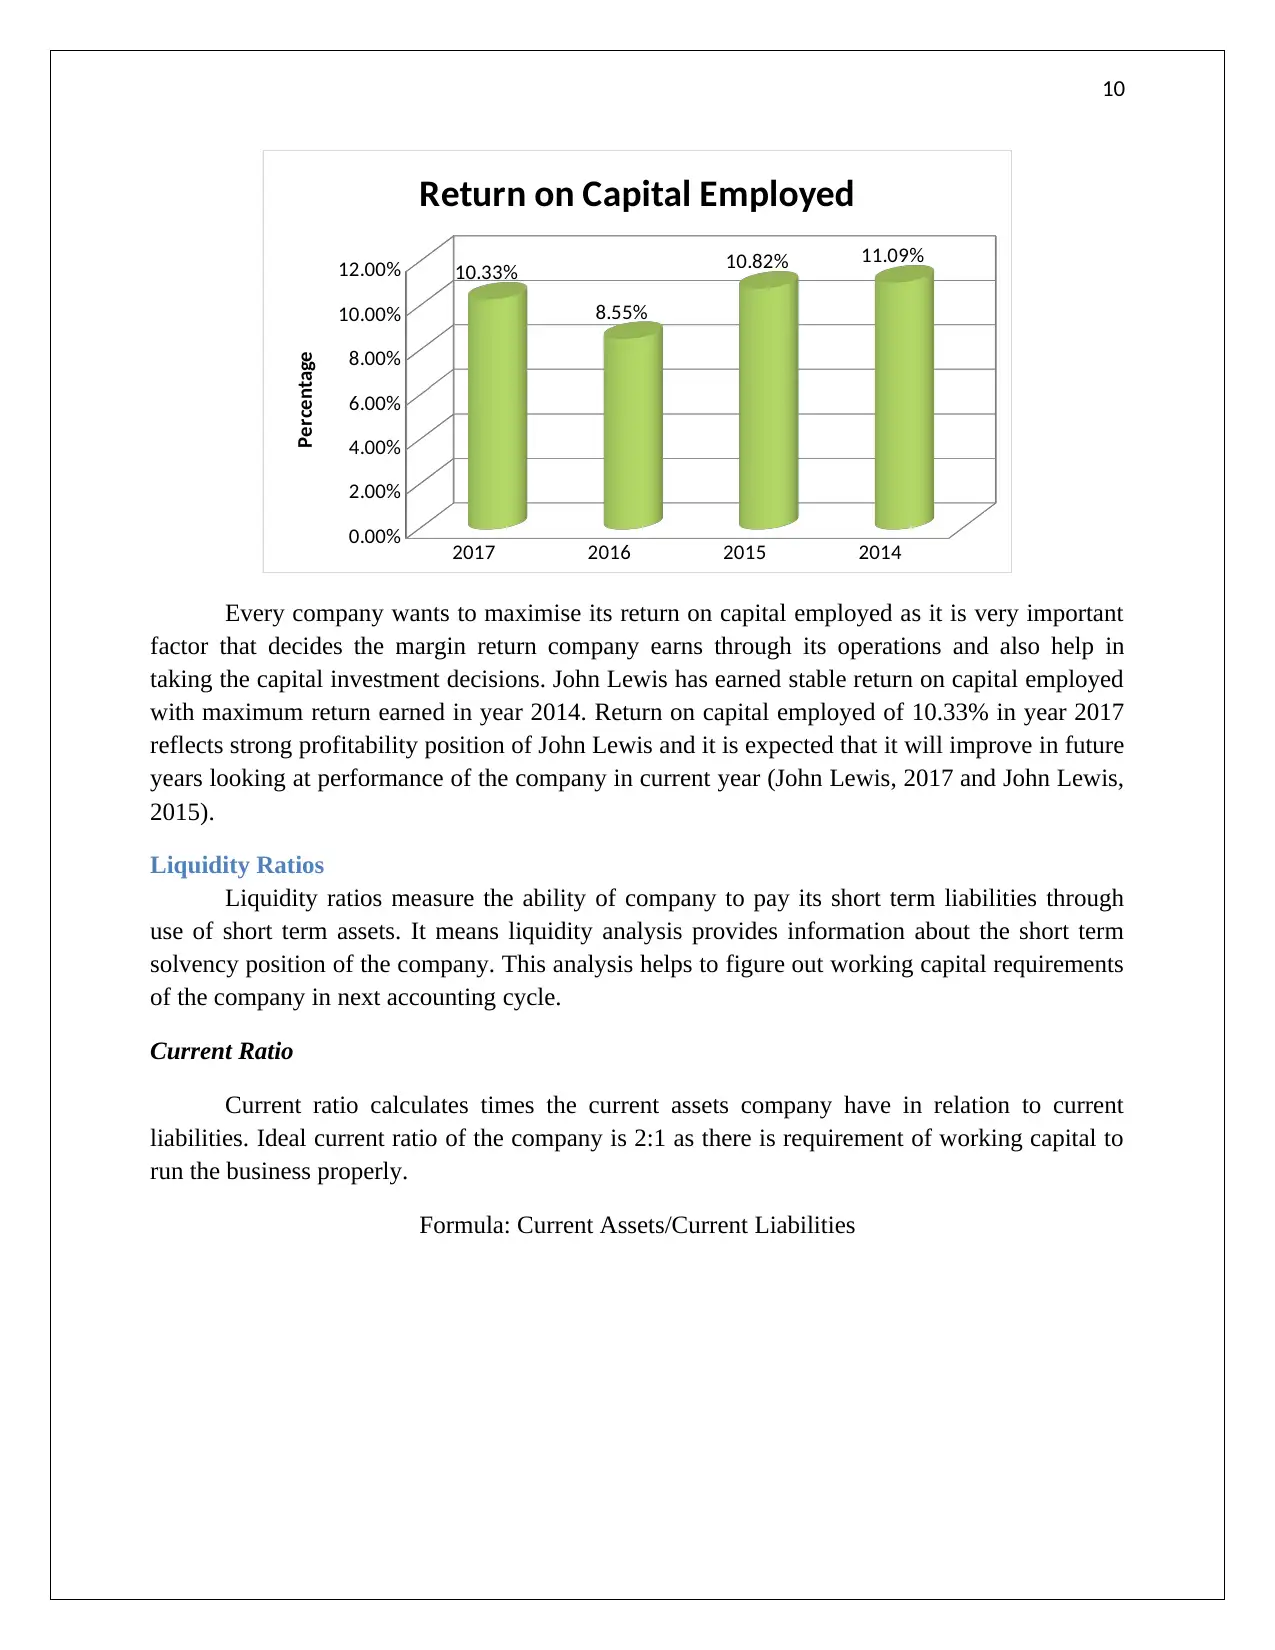
Every company wants to maximise its return on capital employed as it is very important
factor that decides the margin return company earns through its operations and also help in
taking the capital investment decisions. John Lewis has earned stable return on capital employed
with maximum return earned in year 2014. Return on capital employed of 10.33% in year 2017
reflects strong profitability position of John Lewis and it is expected that it will improve in future
years looking at performance of the company in current year (John Lewis, 2017 and John Lewis,
2015).
Liquidity Ratios
Liquidity ratios measure the ability of company to pay its short term liabilities through
use of short term assets. It means liquidity analysis provides information about the short term
solvency position of the company. This analysis helps to figure out working capital requirements
of the company in next accounting cycle.
Current Ratio
Current ratio calculates times the current assets company have in relation to current
liabilities. Ideal current ratio of the company is 2:1 as there is requirement of working capital to
run the business properly.
Formula: Current Assets/Current Liabilities
2017 2016 2015 2014
0.00%
2.00%
4.00%
6.00%
8.00%
10.00%
12.00% 10.33%
8.55%
10.82% 11.09%
Return on Capital Employed
Percentage
Every company wants to maximise its return on capital employed as it is very important
factor that decides the margin return company earns through its operations and also help in
taking the capital investment decisions. John Lewis has earned stable return on capital employed
with maximum return earned in year 2014. Return on capital employed of 10.33% in year 2017
reflects strong profitability position of John Lewis and it is expected that it will improve in future
years looking at performance of the company in current year (John Lewis, 2017 and John Lewis,
2015).
Liquidity Ratios
Liquidity ratios measure the ability of company to pay its short term liabilities through
use of short term assets. It means liquidity analysis provides information about the short term
solvency position of the company. This analysis helps to figure out working capital requirements
of the company in next accounting cycle.
Current Ratio
Current ratio calculates times the current assets company have in relation to current
liabilities. Ideal current ratio of the company is 2:1 as there is requirement of working capital to
run the business properly.
Formula: Current Assets/Current Liabilities
Paraphrase This Document
Need a fresh take? Get an instant paraphrase of this document with our AI Paraphraser
11
2017 2016 2015 2014
0.00
0.10
0.20
0.30
0.40
0.50
0.60
0.70
0.80
0.90
Current Ratio
Times
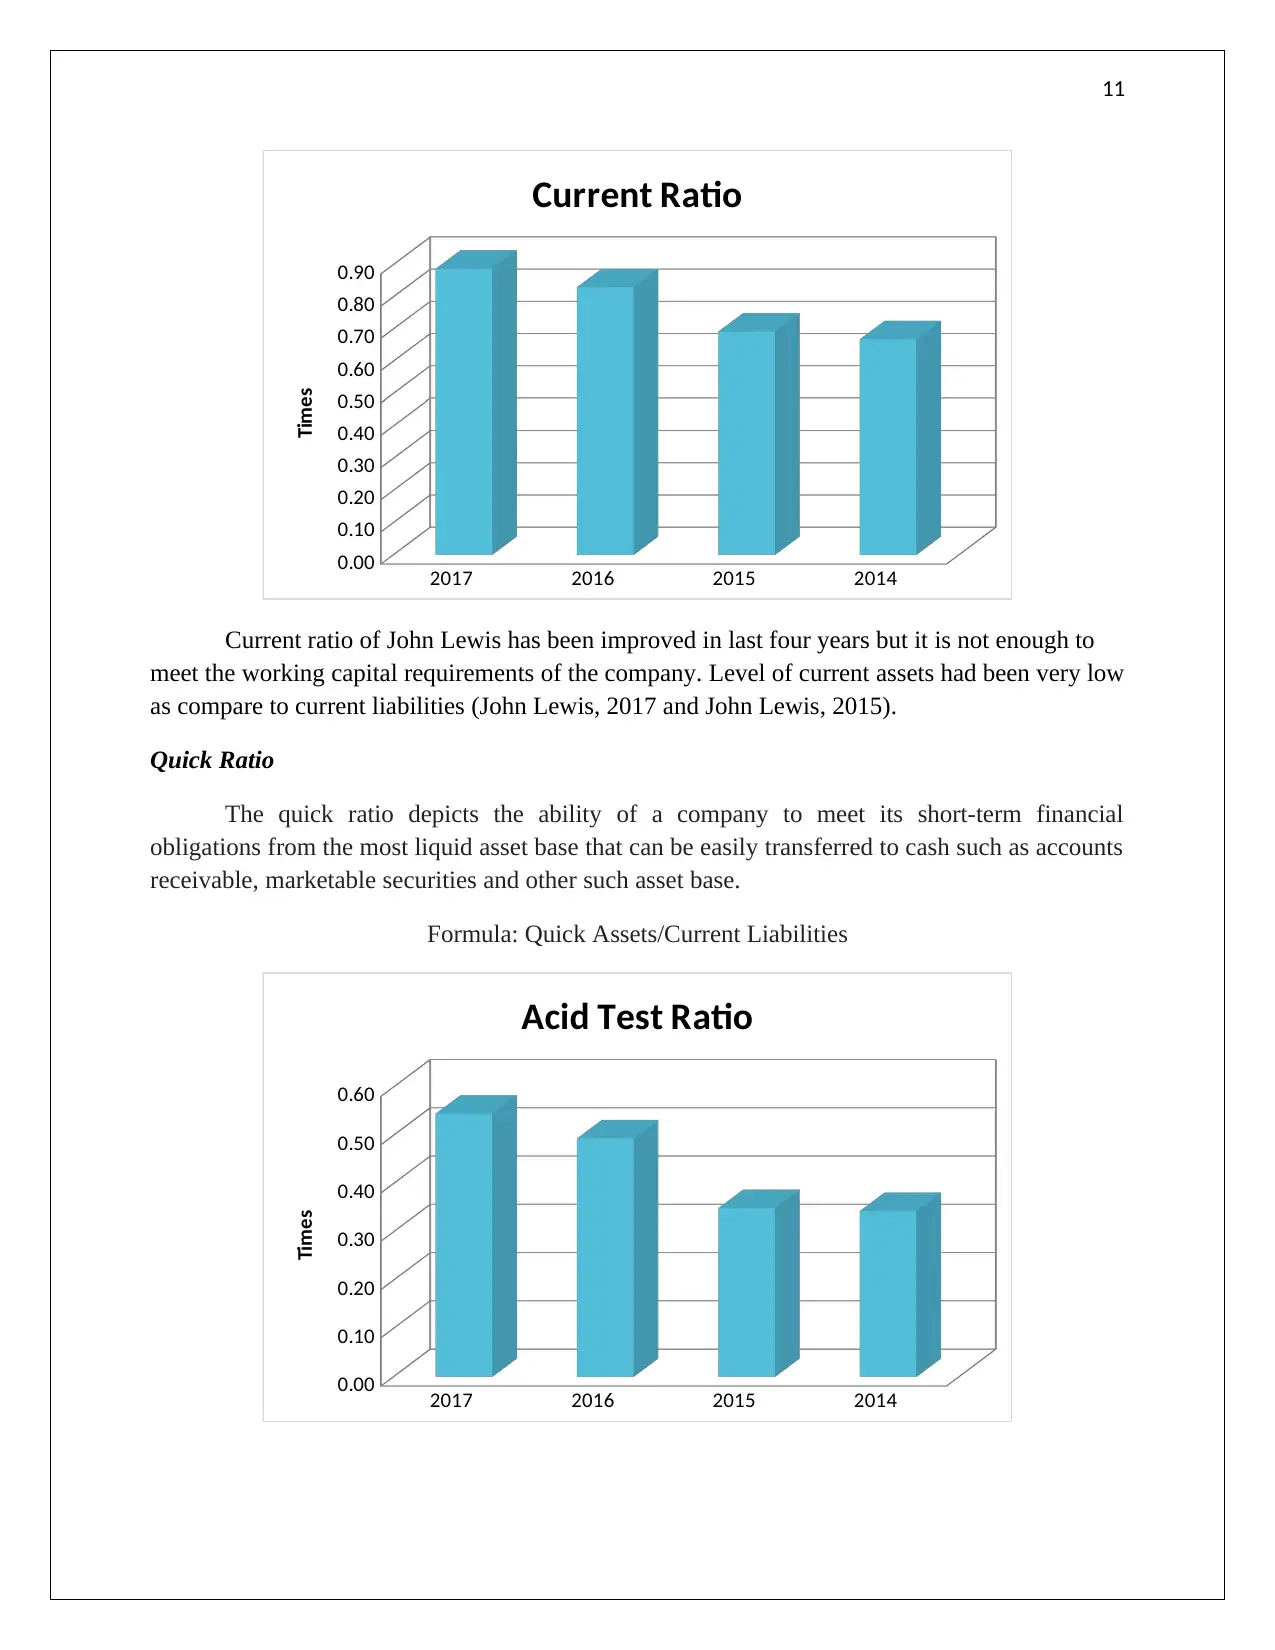
Current ratio of John Lewis has been improved in last four years but it is not enough to
meet the working capital requirements of the company. Level of current assets had been very low
as compare to current liabilities (John Lewis, 2017 and John Lewis, 2015).
Quick Ratio
The quick ratio depicts the ability of a company to meet its short-term financial
obligations from the most liquid asset base that can be easily transferred to cash such as accounts
receivable, marketable securities and other such asset base.
Formula: Quick Assets/Current Liabilities
2017 2016 2015 2014
0.00
0.10
0.20
0.30
0.40
0.50
0.60
Acid Test Ratio
Times
2017 2016 2015 2014
0.00
0.10
0.20
0.30
0.40
0.50
0.60
0.70
0.80
0.90
Current Ratio
Times
Current ratio of John Lewis has been improved in last four years but it is not enough to
meet the working capital requirements of the company. Level of current assets had been very low
as compare to current liabilities (John Lewis, 2017 and John Lewis, 2015).
Quick Ratio
The quick ratio depicts the ability of a company to meet its short-term financial
obligations from the most liquid asset base that can be easily transferred to cash such as accounts
receivable, marketable securities and other such asset base.
Formula: Quick Assets/Current Liabilities
2017 2016 2015 2014
0.00
0.10
0.20
0.30
0.40
0.50
0.60
Acid Test Ratio
Times
12
The quick ratio of the company has improved significantly over the selected financial
period 2014-2017 from 0.34 to 0.55. This depicts that the ability of company to meet its short-
term financial obligations from the asset base has been strengthened during the past few
years. However, the ratio for the company over the selected financial period is less than 1 which
means that there is liquidity risk present within the company that can negatively impacts its
future growth prospects (John Lewis, 2017 and John Lewis, 2015).
Asset management ratio or efficiency ratio
The ratios are used for analyzing the ability of a company to manage its asset base and
realize sales. It has been analyzed fro the company through calculation of the following ratios:
Inventory turnover ratio
The ratio is used for depicting the effectiveness of a company to manage its inventory
base and is calculated by the use of following formula:
Inventory turnover ratio=Cost of goods sold/Average inventory
2017 2016 2015 2014
10.20
10.40
10.60
10.80
11.00
11.20
11.40
10.62
10.71
11.33
10.85
Inventory turnover ratio
Times
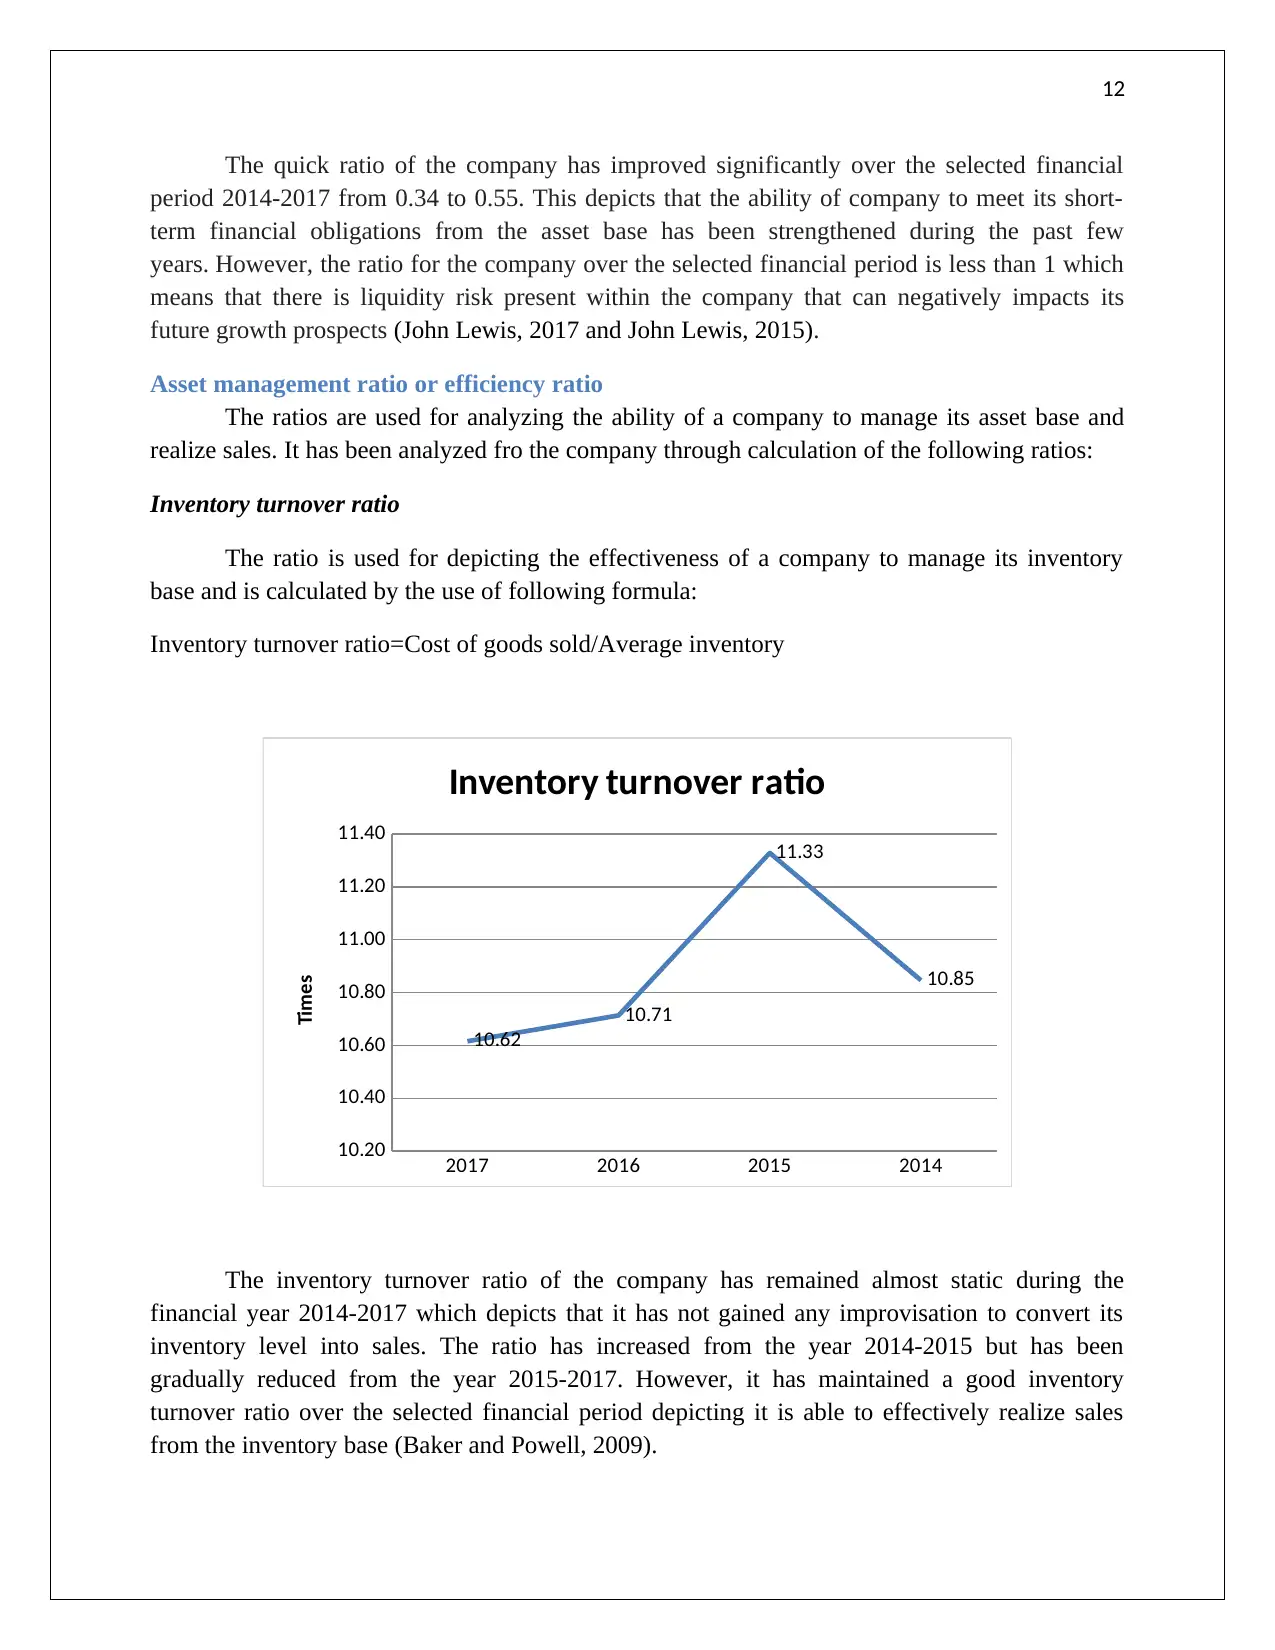
The inventory turnover ratio of the company has remained almost static during the
financial year 2014-2017 which depicts that it has not gained any improvisation to convert its
inventory level into sales. The ratio has increased from the year 2014-2015 but has been
gradually reduced from the year 2015-2017. However, it has maintained a good inventory
turnover ratio over the selected financial period depicting it is able to effectively realize sales
from the inventory base (Baker and Powell, 2009).
The quick ratio of the company has improved significantly over the selected financial
period 2014-2017 from 0.34 to 0.55. This depicts that the ability of company to meet its short-
term financial obligations from the asset base has been strengthened during the past few
years. However, the ratio for the company over the selected financial period is less than 1 which
means that there is liquidity risk present within the company that can negatively impacts its
future growth prospects (John Lewis, 2017 and John Lewis, 2015).
Asset management ratio or efficiency ratio
The ratios are used for analyzing the ability of a company to manage its asset base and
realize sales. It has been analyzed fro the company through calculation of the following ratios:
Inventory turnover ratio
The ratio is used for depicting the effectiveness of a company to manage its inventory
base and is calculated by the use of following formula:
Inventory turnover ratio=Cost of goods sold/Average inventory
2017 2016 2015 2014
10.20
10.40
10.60
10.80
11.00
11.20
11.40
10.62
10.71
11.33
10.85
Inventory turnover ratio
Times
The inventory turnover ratio of the company has remained almost static during the
financial year 2014-2017 which depicts that it has not gained any improvisation to convert its
inventory level into sales. The ratio has increased from the year 2014-2015 but has been
gradually reduced from the year 2015-2017. However, it has maintained a good inventory
turnover ratio over the selected financial period depicting it is able to effectively realize sales
from the inventory base (Baker and Powell, 2009).
⊘ This is a preview!⊘
Do you want full access?
Subscribe today to unlock all pages.
Trusted by 1+ million students worldwide
1 out of 19
Related Documents


Your All-in-One AI-Powered Toolkit for Academic Success.
+13062052269
info@desklib.com
Available 24*7 on WhatsApp / Email
![[object Object]](/_next/static/media/star-bottom.7253800d.svg)
Unlock your academic potential
Copyright © 2020–2026 A2Z Services. All Rights Reserved. Developed and managed by ZUCOL.