Comprehensive Financial Analysis of Kairos Minerals Limited Report
VerifiedAdded on  2020/05/28
|10
|1484
|85
Report
AI Summary
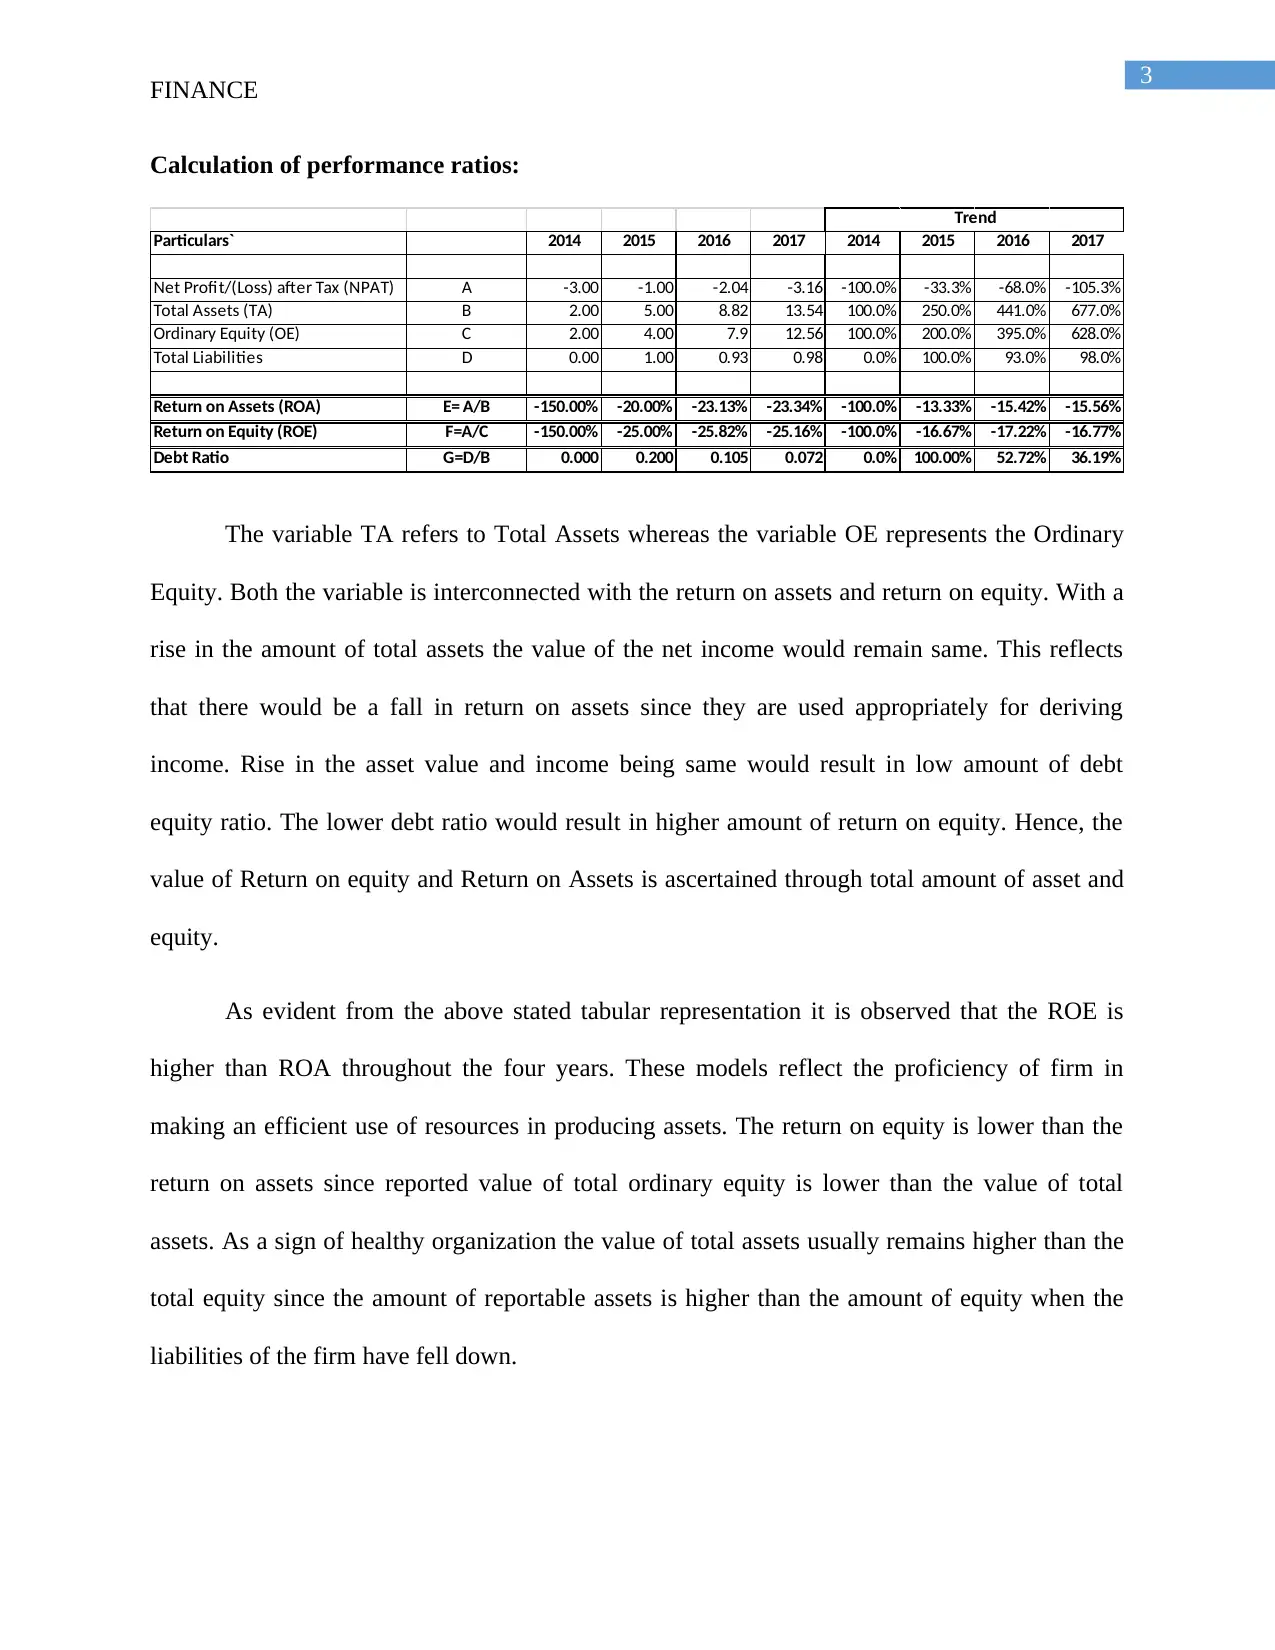
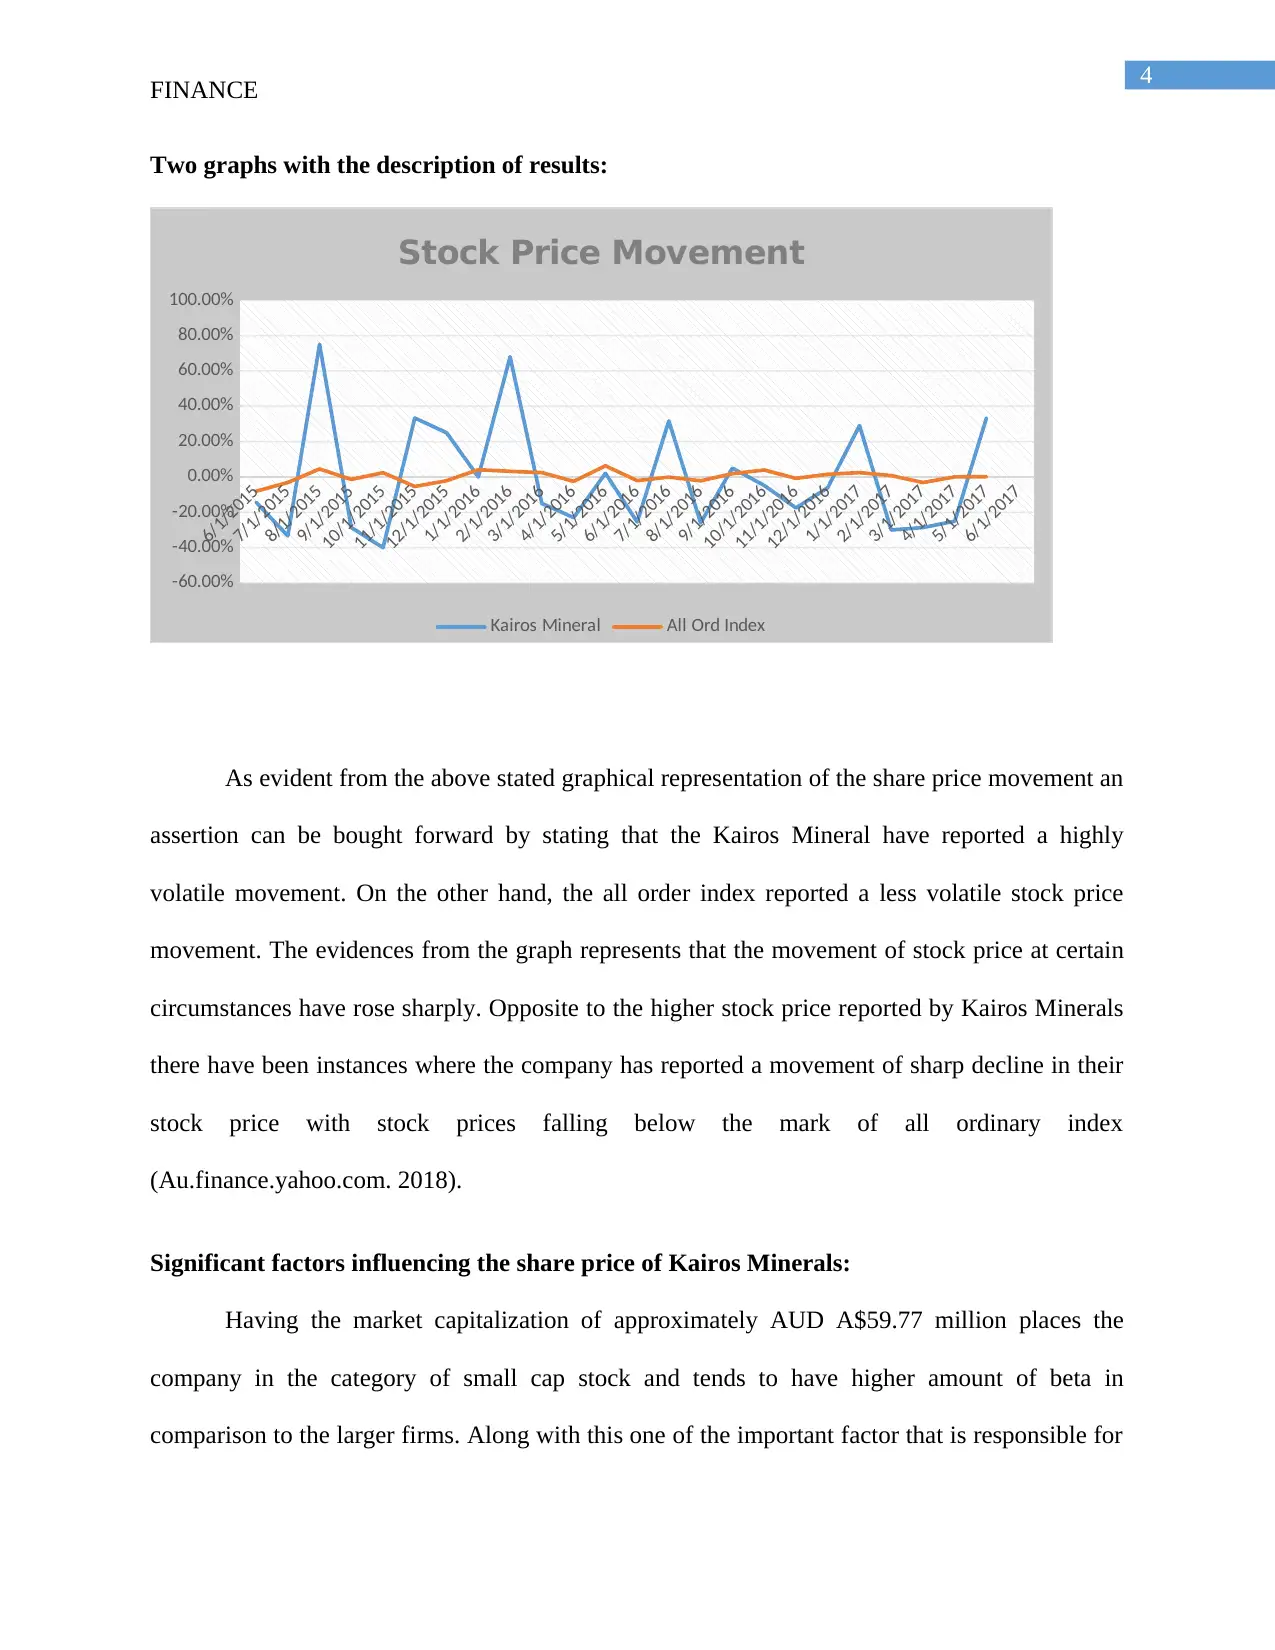
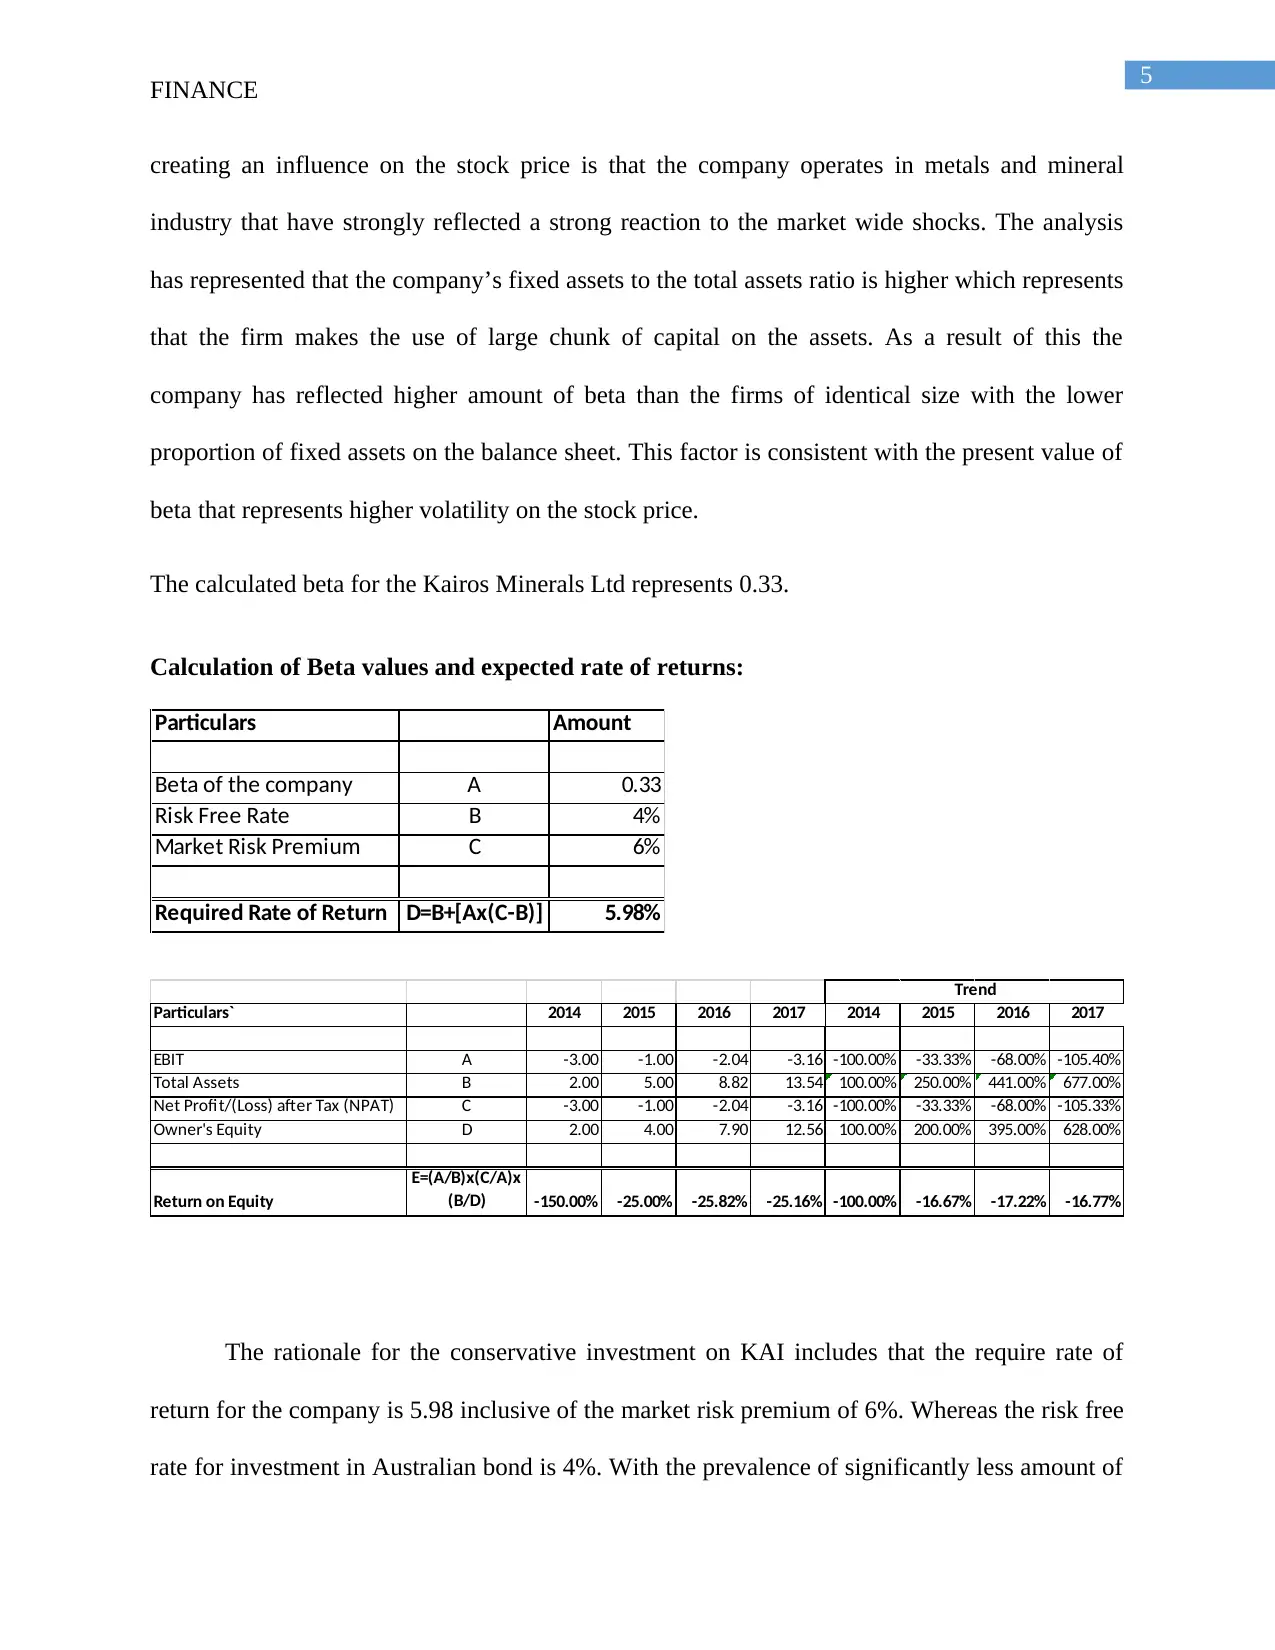
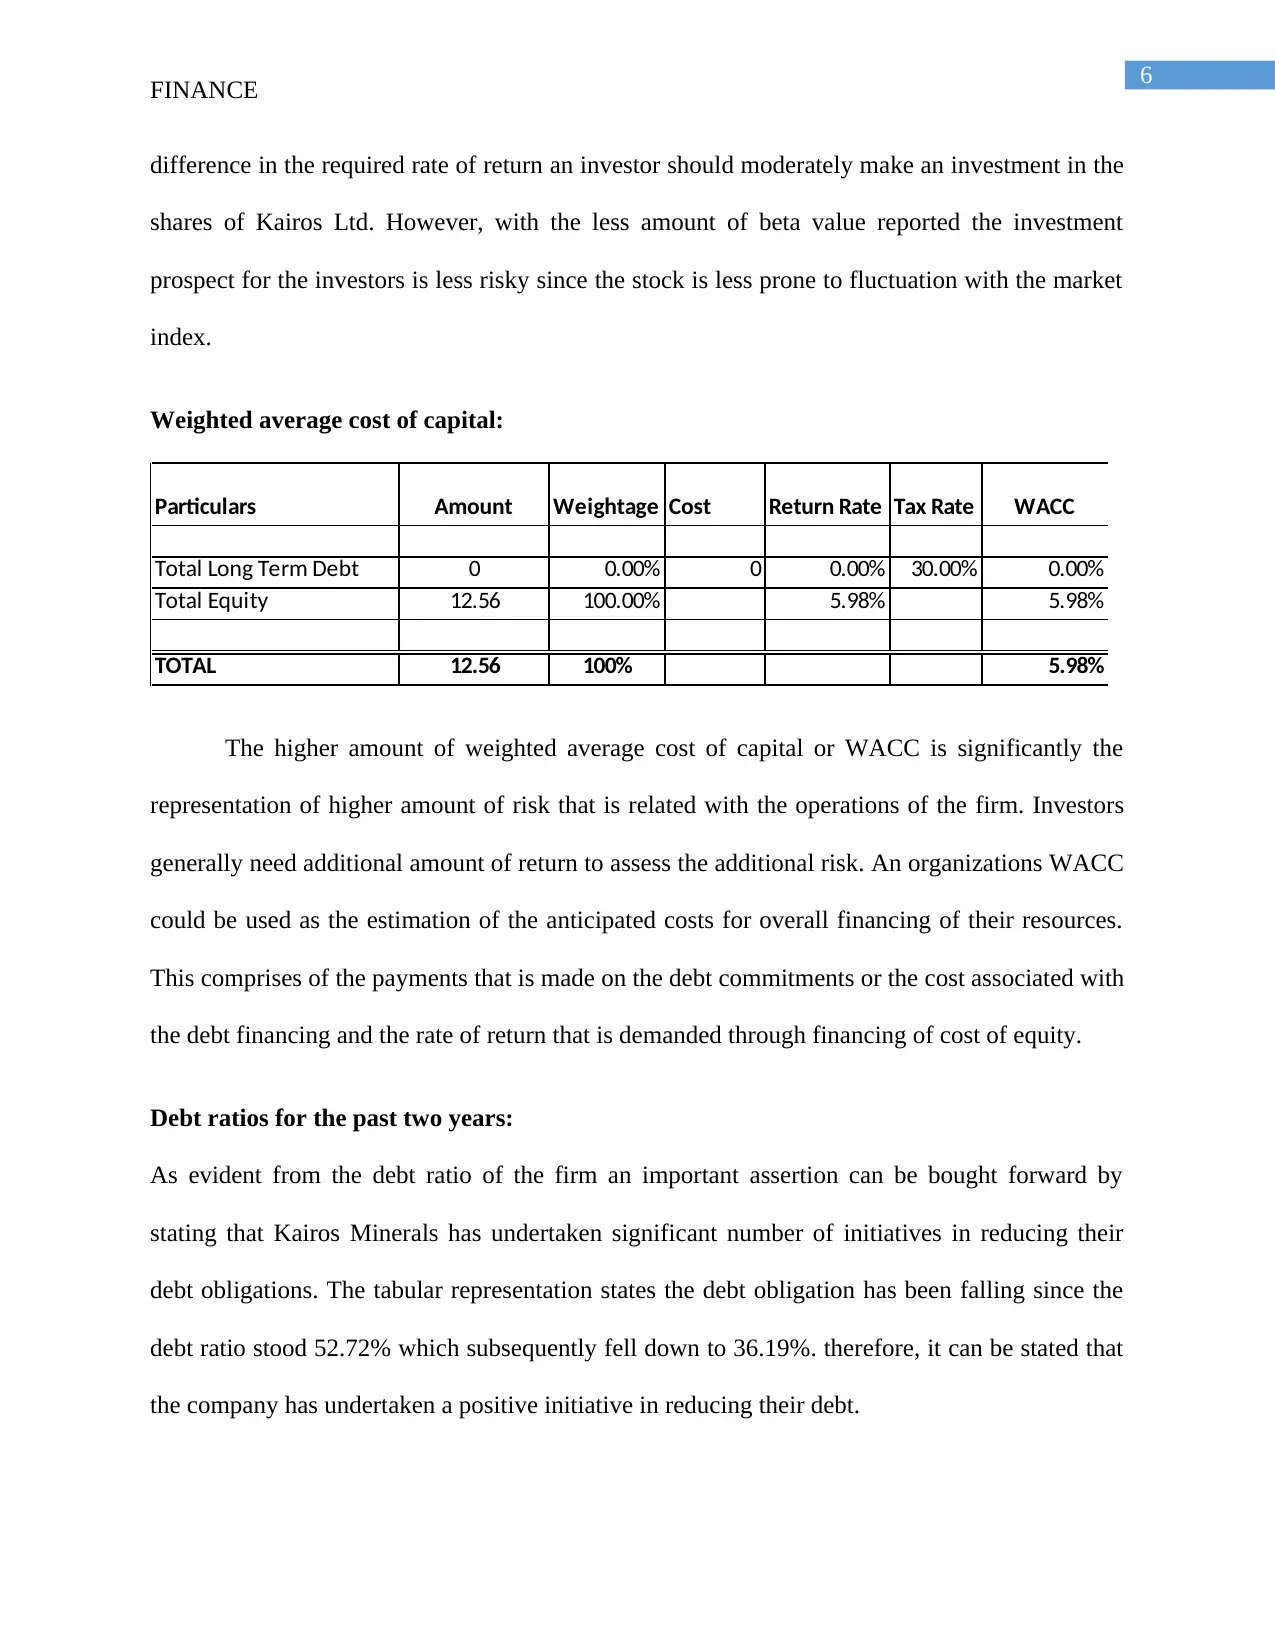
This report provides a detailed financial analysis of Kairos Minerals Limited, an Australian nickel exploration company. It examines the company's ownership and governance structure, including its executive chairman and non-executive directors. The report calculates key performance ratios such as Return on Assets (ROA) and Return on Equity (ROE), comparing their values over a four-year period and highlighting the company's efficiency in utilizing resources. Two graphs illustrate the volatility of Kairos Minerals' share price compared to the All Ordinaries index. The report identifies significant factors influencing the share price, including market capitalization and the company's operation in the metals and minerals industry. It calculates beta values, the weighted average cost of capital (WACC), and analyzes debt ratios and dividend policies. The analysis concludes with a letter of recommendation advising against investment due to the lack of dividends and high volatility, along with a list of references.
Contribute Materials
Your contribution can guide someone’s learning journey. Share your
documents today.

Running head: FINANCE
Finance
Name of the university
Name of the student
Authors note
Finance
Name of the university
Name of the student
Authors note
Secure Best Marks with AI Grader
Need help grading? Try our AI Grader for instant feedback on your assignments.

1
FINANCE
Table of Contents
Description of company:..................................................................................................................2
Ownership and governance structure of company:.........................................................................2
Calculation of performance ratios:..................................................................................................3
Two graphs with the description of results:.....................................................................................4
Significant factors influencing the share price of Kairos Minerals:................................................4
Calculation of Beta values and expected rate of returns:................................................................5
Weighted average cost of capital:....................................................................................................6
Debt ratios for the past two years:...................................................................................................6
Dividend policy:..............................................................................................................................7
References list:.................................................................................................................................9
Description of company:

2
FINANCE
Kairos Minerals Limited is regarded as the Australian Nickel exploration organization.
The portfolio of the Kairos Minerals consists of the three core entirely owned projects that is
strategically situated in the nickel districts of Australia. The company maintains the long run
strategy of constantly striving the process of exploration having counter-cyclical approach to the
expansion (Kairos Minerals 2018). The company chiefly remains engrossed on the creation of
shareholder’s value by conducting exploration activities with greater focus on the Western
Australia.
Ownership and governance structure of company:
The ownership structure of Kairos Minerals comprises of the executive chairman, Non-
Executive Directors and Company Secretary. Kairos Minerals is well organized with leading
technical teams of the industry working under one unit. The governance structure of the
company includes the team with greater than 140 years of exploration experience in mining with
pivotal role in the areas of innovation, delineation and expansion of mineral resources. In
identifying the need for the top most standard of corporate behavior and responsibility the
directors of the Kairos Minerals support and promotes the highest practices of corporate
governance.

3
FINANCE
Calculation of performance ratios:
Particulars` 2014 2015 2016 2017 2014 2015 2016 2017
Net Profit/(Loss) after Tax (NPAT) A -3.00 -1.00 -2.04 -3.16 -100.0% -33.3% -68.0% -105.3%
Total Assets (TA) B 2.00 5.00 8.82 13.54 100.0% 250.0% 441.0% 677.0%
Ordinary Equity (OE) C 2.00 4.00 7.9 12.56 100.0% 200.0% 395.0% 628.0%
Total Liabilities D 0.00 1.00 0.93 0.98 0.0% 100.0% 93.0% 98.0%
Return on Assets (ROA) E= A/B -150.00% -20.00% -23.13% -23.34% -100.0% -13.33% -15.42% -15.56%
Return on Equity (ROE) F=A/C -150.00% -25.00% -25.82% -25.16% -100.0% -16.67% -17.22% -16.77%
Debt Ratio G=D/B 0.000 0.200 0.105 0.072 0.0% 100.00% 52.72% 36.19%
Trend
The variable TA refers to Total Assets whereas the variable OE represents the Ordinary
Equity. Both the variable is interconnected with the return on assets and return on equity. With a
rise in the amount of total assets the value of the net income would remain same. This reflects
that there would be a fall in return on assets since they are used appropriately for deriving
income. Rise in the asset value and income being same would result in low amount of debt
equity ratio. The lower debt ratio would result in higher amount of return on equity. Hence, the
value of Return on equity and Return on Assets is ascertained through total amount of asset and
equity.
As evident from the above stated tabular representation it is observed that the ROE is
higher than ROA throughout the four years. These models reflect the proficiency of firm in
making an efficient use of resources in producing assets. The return on equity is lower than the
return on assets since reported value of total ordinary equity is lower than the value of total
assets. As a sign of healthy organization the value of total assets usually remains higher than the
total equity since the amount of reportable assets is higher than the amount of equity when the
liabilities of the firm have fell down.
Secure Best Marks with AI Grader
Need help grading? Try our AI Grader for instant feedback on your assignments.

4
FINANCE
Two graphs with the description of results:
6/1/2015
7/1/2015
8/1/2015
9/1/2015
10/1/2015
11/1/2015
12/1/2015
1/1/2016
2/1/2016
3/1/2016
4/1/2016
5/1/2016
6/1/2016
7/1/2016
8/1/2016
9/1/2016
10/1/2016
11/1/2016
12/1/2016
1/1/2017
2/1/2017
3/1/2017
4/1/2017
5/1/2017
6/1/2017
-60.00%
-40.00%
-20.00%
0.00%
20.00%
40.00%
60.00%
80.00%
100.00%
Stock Price Movement
Kairos Mineral All Ord Index
As evident from the above stated graphical representation of the share price movement an
assertion can be bought forward by stating that the Kairos Mineral have reported a highly
volatile movement. On the other hand, the all order index reported a less volatile stock price
movement. The evidences from the graph represents that the movement of stock price at certain
circumstances have rose sharply. Opposite to the higher stock price reported by Kairos Minerals
there have been instances where the company has reported a movement of sharp decline in their
stock price with stock prices falling below the mark of all ordinary index
(Au.finance.yahoo.com. 2018).
Significant factors influencing the share price of Kairos Minerals:
Having the market capitalization of approximately AUD A$59.77 million places the
company in the category of small cap stock and tends to have higher amount of beta in
comparison to the larger firms. Along with this one of the important factor that is responsible for

5
FINANCE
creating an influence on the stock price is that the company operates in metals and mineral
industry that have strongly reflected a strong reaction to the market wide shocks. The analysis
has represented that the company’s fixed assets to the total assets ratio is higher which represents
that the firm makes the use of large chunk of capital on the assets. As a result of this the
company has reflected higher amount of beta than the firms of identical size with the lower
proportion of fixed assets on the balance sheet. This factor is consistent with the present value of
beta that represents higher volatility on the stock price.
The calculated beta for the Kairos Minerals Ltd represents 0.33.
Calculation of Beta values and expected rate of returns:
Particulars Amount
Beta of the company A 0.33
Risk Free Rate B 4%
Market Risk Premium C 6%
Required Rate of Return D=B+[Ax(C-B)] 5.98%
Particulars` 2014 2015 2016 2017 2014 2015 2016 2017
EBIT A -3.00 -1.00 -2.04 -3.16 -100.00% -33.33% -68.00% -105.40%
Total Assets B 2.00 5.00 8.82 13.54 100.00% 250.00% 441.00% 677.00%
Net Profit/(Loss) after Tax (NPAT) C -3.00 -1.00 -2.04 -3.16 -100.00% -33.33% -68.00% -105.33%
Owner's Equity D 2.00 4.00 7.90 12.56 100.00% 200.00% 395.00% 628.00%
Return on Equity
E=(A/B)x(C/A)x
(B/D) -150.00% -25.00% -25.82% -25.16% -100.00% -16.67% -17.22% -16.77%
Trend
The rationale for the conservative investment on KAI includes that the require rate of
return for the company is 5.98 inclusive of the market risk premium of 6%. Whereas the risk free
rate for investment in Australian bond is 4%. With the prevalence of significantly less amount of

6
FINANCE
difference in the required rate of return an investor should moderately make an investment in the
shares of Kairos Ltd. However, with the less amount of beta value reported the investment
prospect for the investors is less risky since the stock is less prone to fluctuation with the market
index.
Weighted average cost of capital:
Particulars Amount Weightage Cost Return Rate Tax Rate WACC
Total Long Term Debt 0 0.00% 0 0.00% 30.00% 0.00%
Total Equity 12.56 100.00% 5.98% 5.98%
TOTAL 12.56 100% 5.98%
The higher amount of weighted average cost of capital or WACC is significantly the
representation of higher amount of risk that is related with the operations of the firm. Investors
generally need additional amount of return to assess the additional risk. An organizations WACC
could be used as the estimation of the anticipated costs for overall financing of their resources.
This comprises of the payments that is made on the debt commitments or the cost associated with
the debt financing and the rate of return that is demanded through financing of cost of equity.
Debt ratios for the past two years:
As evident from the debt ratio of the firm an important assertion can be bought forward by
stating that Kairos Minerals has undertaken significant number of initiatives in reducing their
debt obligations. The tabular representation states the debt obligation has been falling since the
debt ratio stood 52.72% which subsequently fell down to 36.19%. therefore, it can be stated that
the company has undertaken a positive initiative in reducing their debt.
Paraphrase This Document
Need a fresh take? Get an instant paraphrase of this document with our AI Paraphraser

7
FINANCE
During the year 2017 in the month of June the company has issued 47,619 of fully paid
ordinary shares at $0.021 each share to the sophisticated and institutional investors. Considering
the gearing of Kairos Minerals an assertion can be bought forward by stating that a large part of
the capital for the company comprises of the share capital.
Dividend policy:
The directors of Kairos Minerals have not reported any dividend during the financial year.
Letter of recommendation:
Dear ABC,
Queensland
Australia
Respected Sir,
I would like to draw your kind attention towards my recommendations that it would not be wise
to invest in Kairos Minerals Ltd since the company has not reported any payment of dividends to
the shareholders. Additionally the Kairos Mineral’s five year beta stood 2.81 which represents
that the value of the company would swing up more that the anticipated market when the market
hit prosperous times. However, the company has reported a higher fall in terms of downturn.
Such kind of volatility reflects higher risk for the investors and it would not be ideal for investors
in making an investment in such fluctuating stock.
I hope that the above stated recommendations have successfully been able to provide you with
sufficient information regarding investment and it is advised that you make an wise investment
decision.

8
FINANCE
Thanking you,
ABC
Investment Company
FINANCE
Thanking you,
ABC
Investment Company

9
FINANCE
References list:
Au.finance.yahoo.com. (2018). ^AORD Historical prices | ALL ORDINARIES Stock - Yahoo
Finance. [online] Available at: https://au.finance.yahoo.com/quote/%5EAORD/history?
period1=1432751400&period2=1501353000&interval=1mo&filter=history&frequency=1mo
[Accessed 23 Jan. 2018].
Kairos Minerals. (2018). Company Profile - Kairos Minerals. [online] Available at:
http://www.kairosminerals.com.au/company-profile/ [Accessed 23 Jan. 2018].
1 out of 10
Related Documents

Your All-in-One AI-Powered Toolkit for Academic Success.
 +13062052269
info@desklib.com
Available 24*7 on WhatsApp / Email
Unlock your academic potential
© 2024  |  Zucol Services PVT LTD  |  All rights reserved.