Financial Analysis Report: Performance of Katrina Group & ABR Holdings
VerifiedAdded on 2021/04/21
|21
|4628
|72
Report
AI Summary
This report presents a comprehensive financial analysis of Katrina Group Ltd and ABR Holdings Ltd, two Singapore-based companies. The analysis encompasses various aspects, including a description and SWOT analysis of each company, followed by vertical and horizontal analysis of their financial statements. Ratio analysis, covering liquidity, profitability, capital structure, and efficiency ratios, is conducted to assess their financial health. The report also includes a cash flow analysis and segment analysis, providing a detailed understanding of their financial performance. The findings are summarized, and recommendations are provided, concluding the report with a comprehensive overview of the companies' financial positions and performance, based on the available financial data.
RUNNING HEAD: FINANCIAL REPORTING
Financial analysis
Financial analysis
Paraphrase This Document
Need a fresh take? Get an instant paraphrase of this document with our AI Paraphraser
Financial reporting 1
Contents
Introduction...........................................................................................................................................2
Description and Swot analysis...............................................................................................................2
Vertical and Horizontal Analysis...........................................................................................................4
Ratio Analysis.......................................................................................................................................6
Cash flow Analysis................................................................................................................................8
Segment analysis...................................................................................................................................8
Recommendation and conclusion..........................................................................................................9
References...........................................................................................................................................10
Appendix 1..........................................................................................................................................12
Financial reporting 2
Introduction
Financial analysis means evaluating and analysing the financial performance of a company.
For an investor, it is very important to know about the profitability of the company, in which
he is going to invest his funds (Bragg, 2012). The report contains an analysis of performance
and position of the two companies named as Katrina Group Ltd and ABR Holdings Ltd. It
includes SWOT analysis, vertical, horizontal and ratio analysis. The cash flow statement and
segment analysis of the both the companies is also done in the report. The findings of the
analysis are stated in the last part of the report followed by recommendation and conclusion.
Description and Swot analysis
Katrina Group Ltd is a Singapore based investment holding company that owns and operates
a chain of restaurants and cafes under nine food and beverages brand including Bali Thai,
Muchos, Indobox and many more. The company is listed on Singapore Stock Exchange as
SGX: 1A0 (Katrinagroup.com., 2018).
ABR Holdings Limited is a food and beverages company, having its headquarters in
Singapore. The company, along with its subsidiaries manufactures ice-creams in Malaysia,
Singapore and all over the Asia. Listed in Singapore exchange, it is traded as SGX: 533
(Abr.com.sg., 2018).
Basis Katrina Group ABR Holdings
⊘ This is a preview!⊘
Do you want full access?
Subscribe today to unlock all pages.
Trusted by 1+ million students worldwide
Financial reporting 3
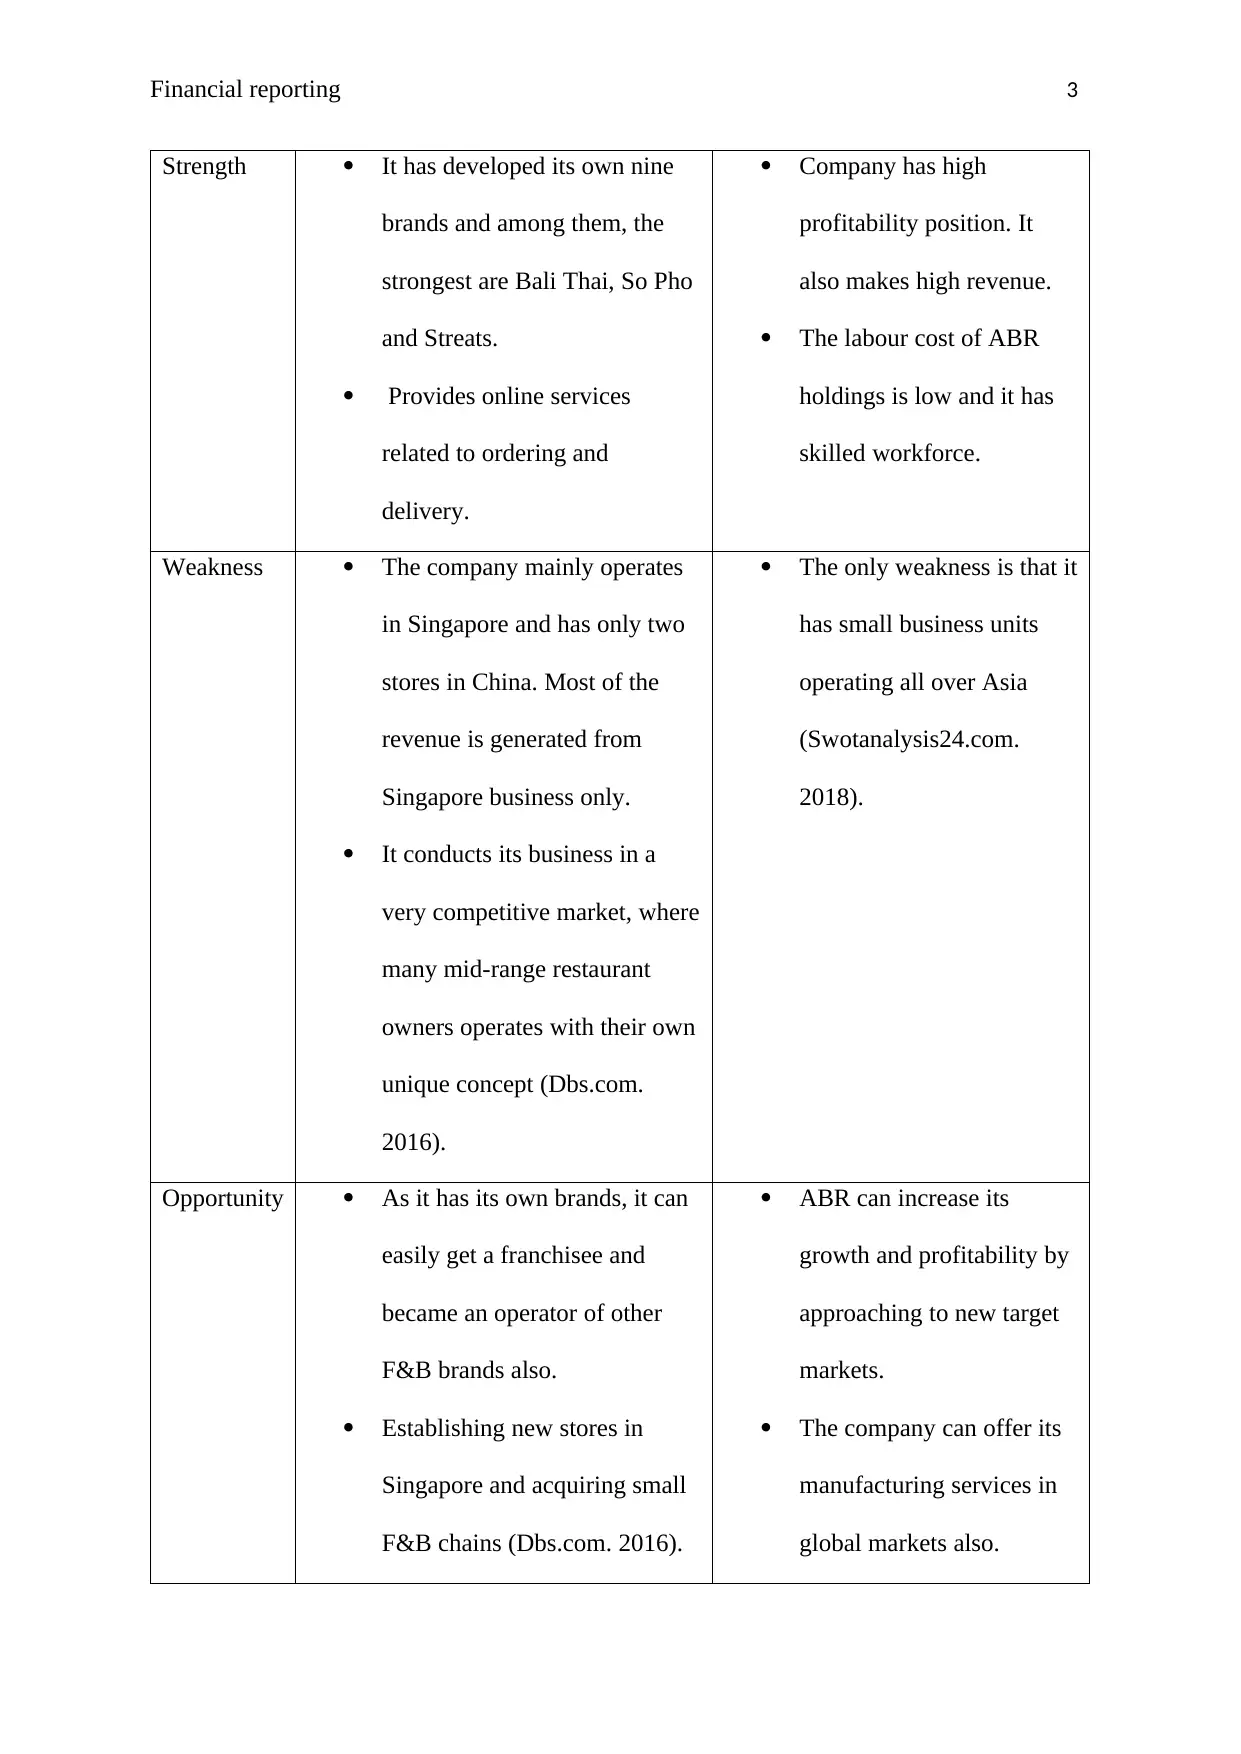
Strength It has developed its own nine
brands and among them, the
strongest are Bali Thai, So Pho
and Streats.
Provides online services
related to ordering and
delivery.
Company has high
profitability position. It
also makes high revenue.
The labour cost of ABR
holdings is low and it has
skilled workforce.
Weakness The company mainly operates
in Singapore and has only two
stores in China. Most of the
revenue is generated from
Singapore business only.
It conducts its business in a
very competitive market, where
many mid-range restaurant
owners operates with their own
unique concept (Dbs.com.
2016).
The only weakness is that it
has small business units
operating all over Asia
(Swotanalysis24.com.
2018).
Opportunity As it has its own brands, it can
easily get a franchisee and
became an operator of other
F&B brands also.
Establishing new stores in
Singapore and acquiring small
F&B chains (Dbs.com. 2016).
ABR can increase its
growth and profitability by
approaching to new target
markets.
The company can offer its
manufacturing services in
global markets also.
Paraphrase This Document
Need a fresh take? Get an instant paraphrase of this document with our AI Paraphraser
Financial reporting 4
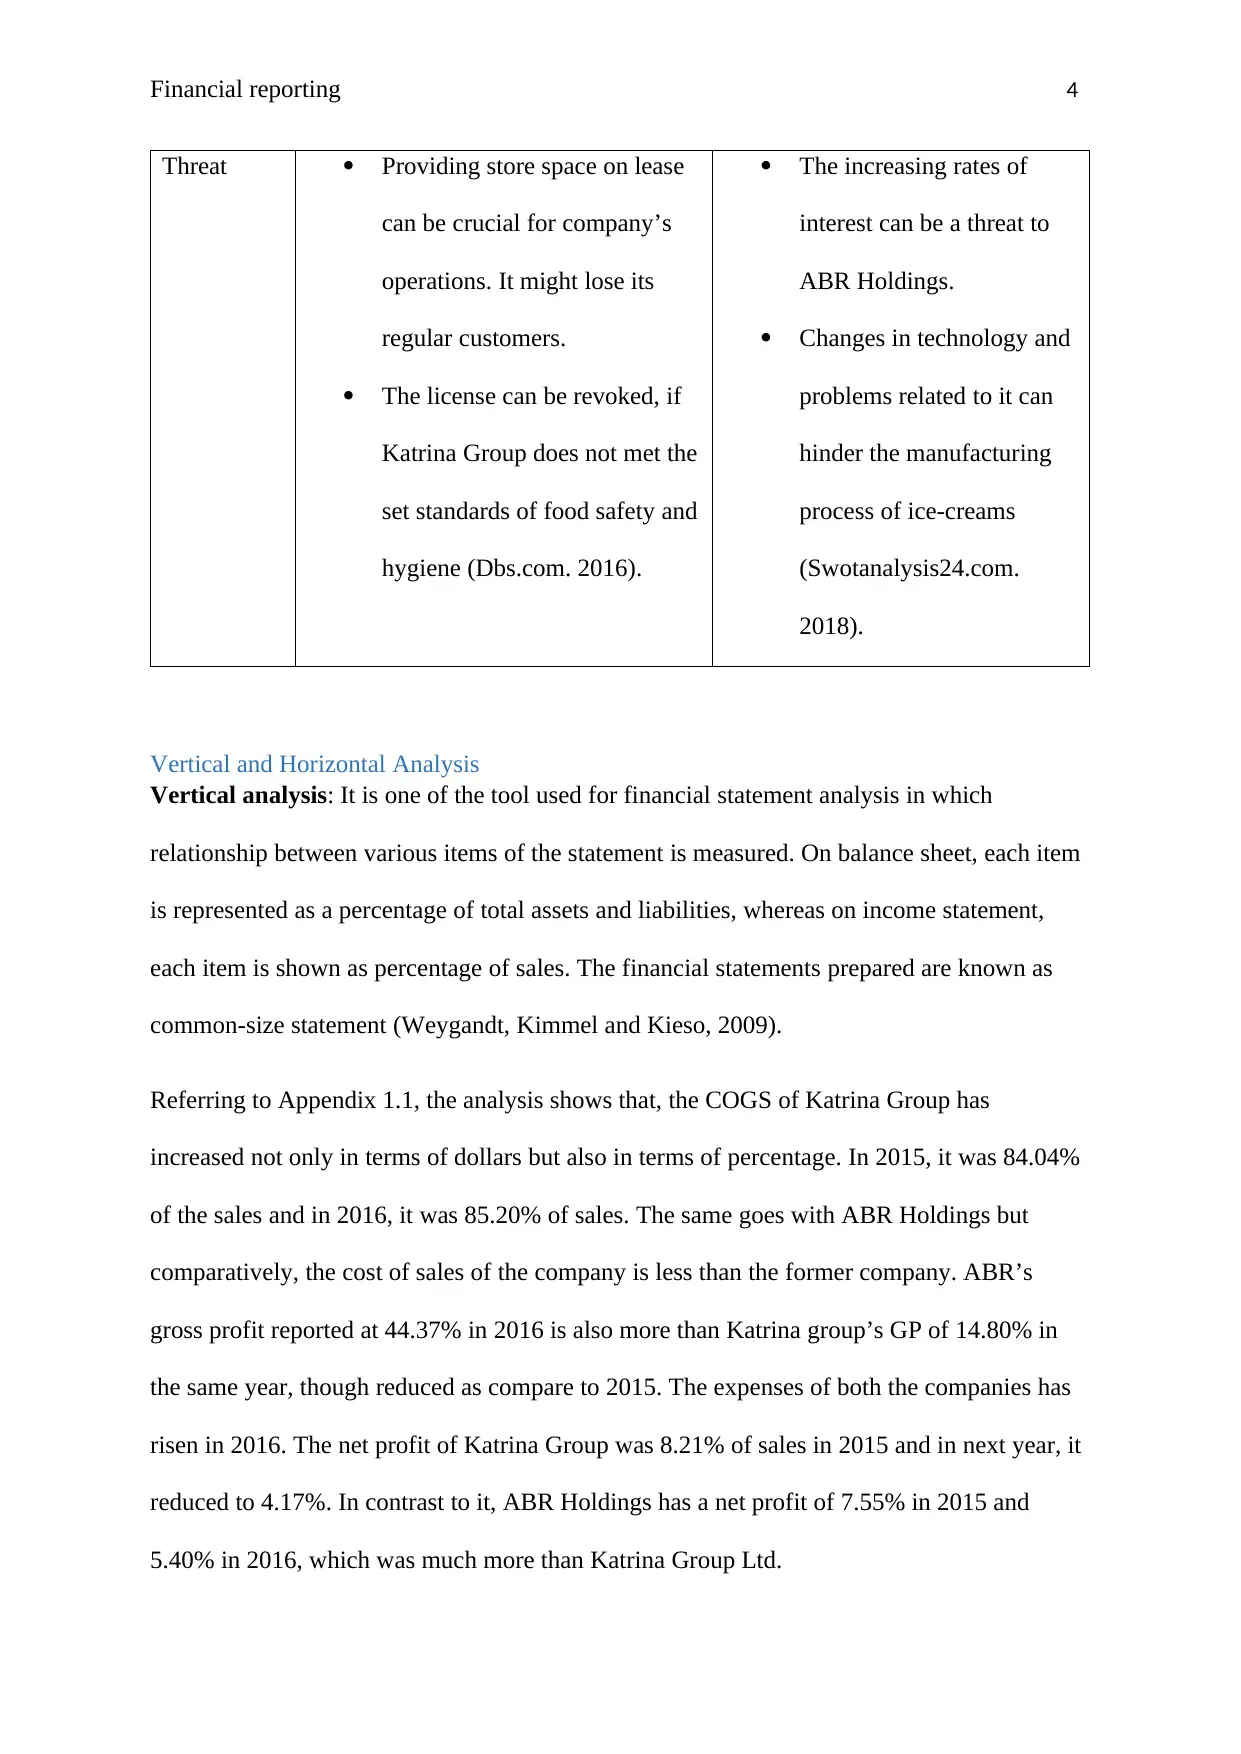
Threat Providing store space on lease
can be crucial for company’s
operations. It might lose its
regular customers.
The license can be revoked, if
Katrina Group does not met the
set standards of food safety and
hygiene (Dbs.com. 2016).
The increasing rates of
interest can be a threat to
ABR Holdings.
Changes in technology and
problems related to it can
hinder the manufacturing
process of ice-creams
(Swotanalysis24.com.
2018).
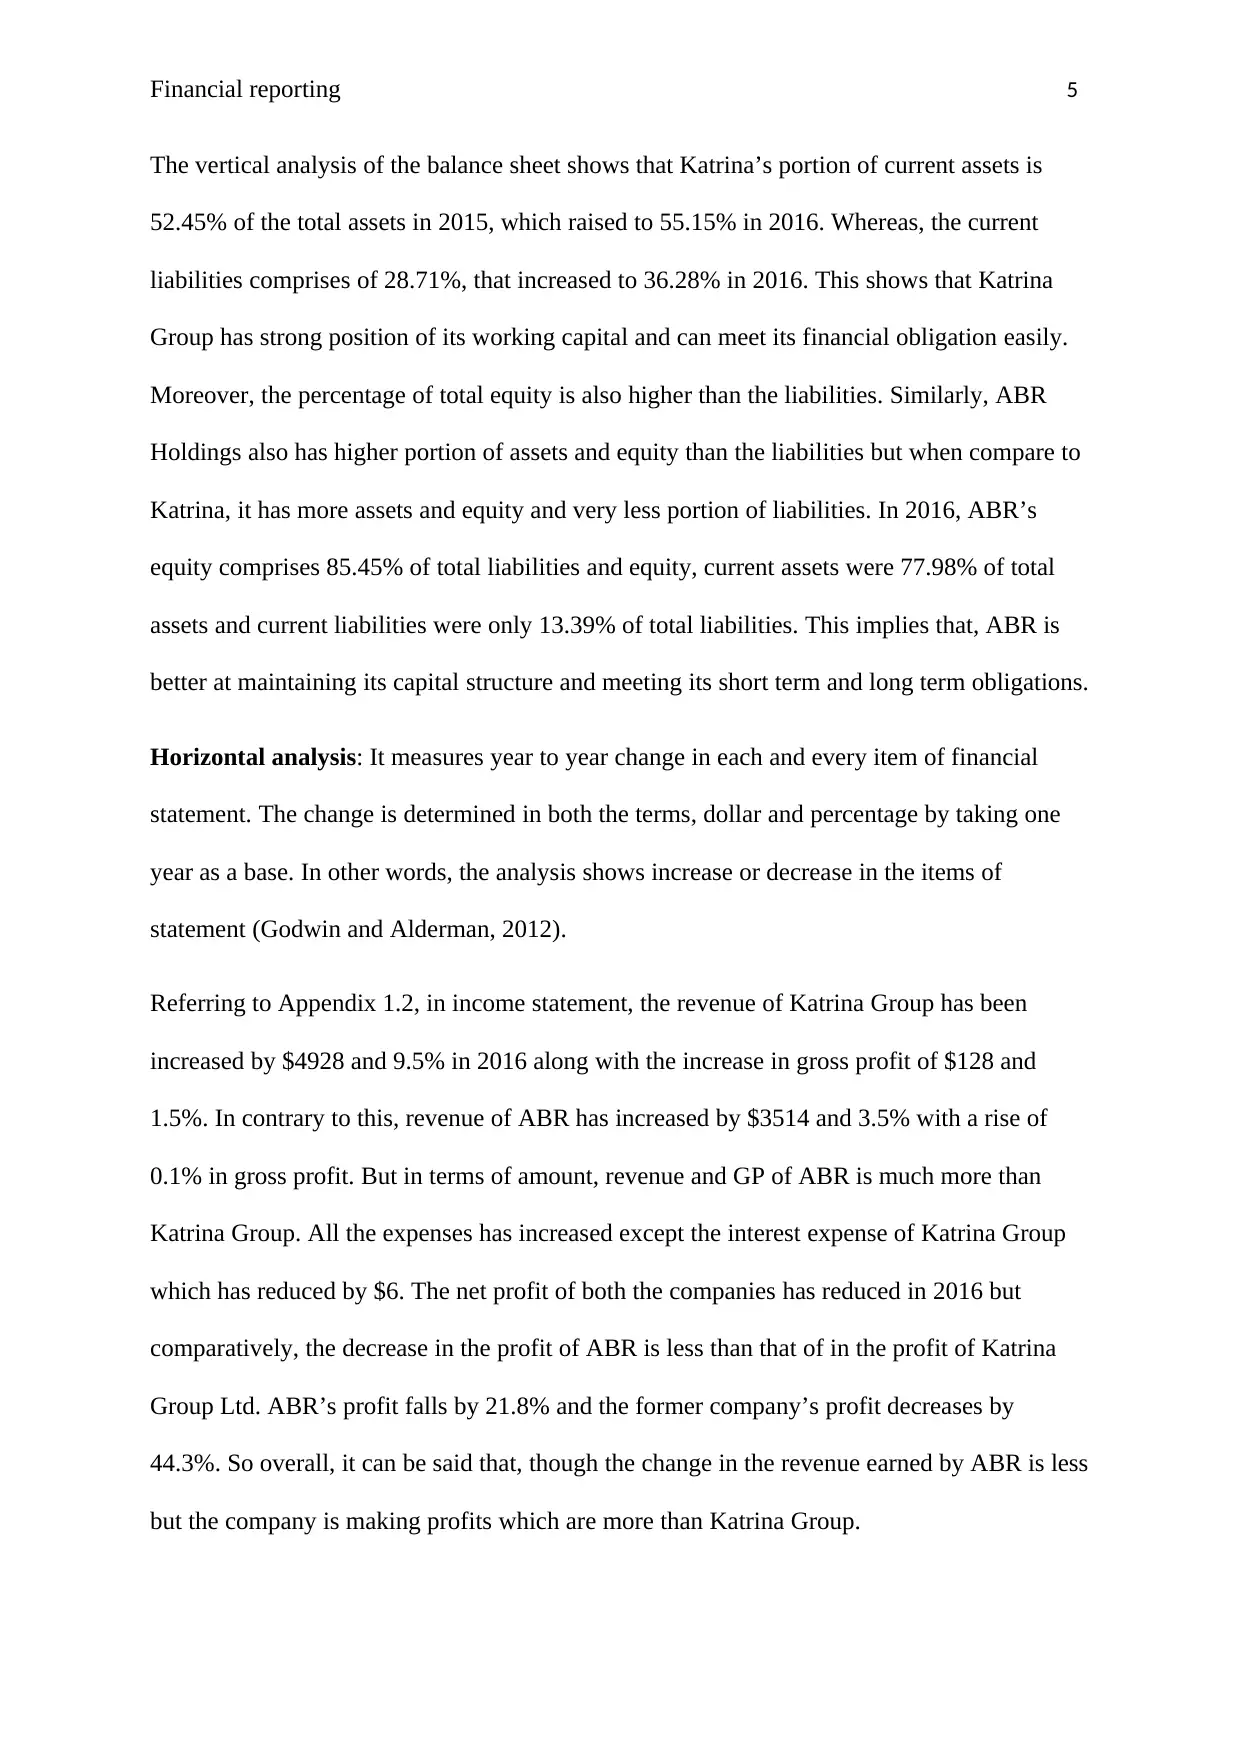
Vertical and Horizontal Analysis
Vertical analysis: It is one of the tool used for financial statement analysis in which
relationship between various items of the statement is measured. On balance sheet, each item
is represented as a percentage of total assets and liabilities, whereas on income statement,
each item is shown as percentage of sales. The financial statements prepared are known as
common-size statement (Weygandt, Kimmel and Kieso, 2009).
Referring to Appendix 1.1, the analysis shows that, the COGS of Katrina Group has
increased not only in terms of dollars but also in terms of percentage. In 2015, it was 84.04%
of the sales and in 2016, it was 85.20% of sales. The same goes with ABR Holdings but
comparatively, the cost of sales of the company is less than the former company. ABR’s
gross profit reported at 44.37% in 2016 is also more than Katrina group’s GP of 14.80% in
the same year, though reduced as compare to 2015. The expenses of both the companies has
risen in 2016. The net profit of Katrina Group was 8.21% of sales in 2015 and in next year, it
reduced to 4.17%. In contrast to it, ABR Holdings has a net profit of 7.55% in 2015 and
5.40% in 2016, which was much more than Katrina Group Ltd.
Threat Providing store space on lease
can be crucial for company’s
operations. It might lose its
regular customers.
The license can be revoked, if
Katrina Group does not met the
set standards of food safety and
hygiene (Dbs.com. 2016).
The increasing rates of
interest can be a threat to
ABR Holdings.
Changes in technology and
problems related to it can
hinder the manufacturing
process of ice-creams
(Swotanalysis24.com.
2018).
Vertical and Horizontal Analysis
Vertical analysis: It is one of the tool used for financial statement analysis in which
relationship between various items of the statement is measured. On balance sheet, each item
is represented as a percentage of total assets and liabilities, whereas on income statement,
each item is shown as percentage of sales. The financial statements prepared are known as
common-size statement (Weygandt, Kimmel and Kieso, 2009).
Referring to Appendix 1.1, the analysis shows that, the COGS of Katrina Group has
increased not only in terms of dollars but also in terms of percentage. In 2015, it was 84.04%
of the sales and in 2016, it was 85.20% of sales. The same goes with ABR Holdings but
comparatively, the cost of sales of the company is less than the former company. ABR’s
gross profit reported at 44.37% in 2016 is also more than Katrina group’s GP of 14.80% in
the same year, though reduced as compare to 2015. The expenses of both the companies has
risen in 2016. The net profit of Katrina Group was 8.21% of sales in 2015 and in next year, it
reduced to 4.17%. In contrast to it, ABR Holdings has a net profit of 7.55% in 2015 and
5.40% in 2016, which was much more than Katrina Group Ltd.
Financial reporting 5
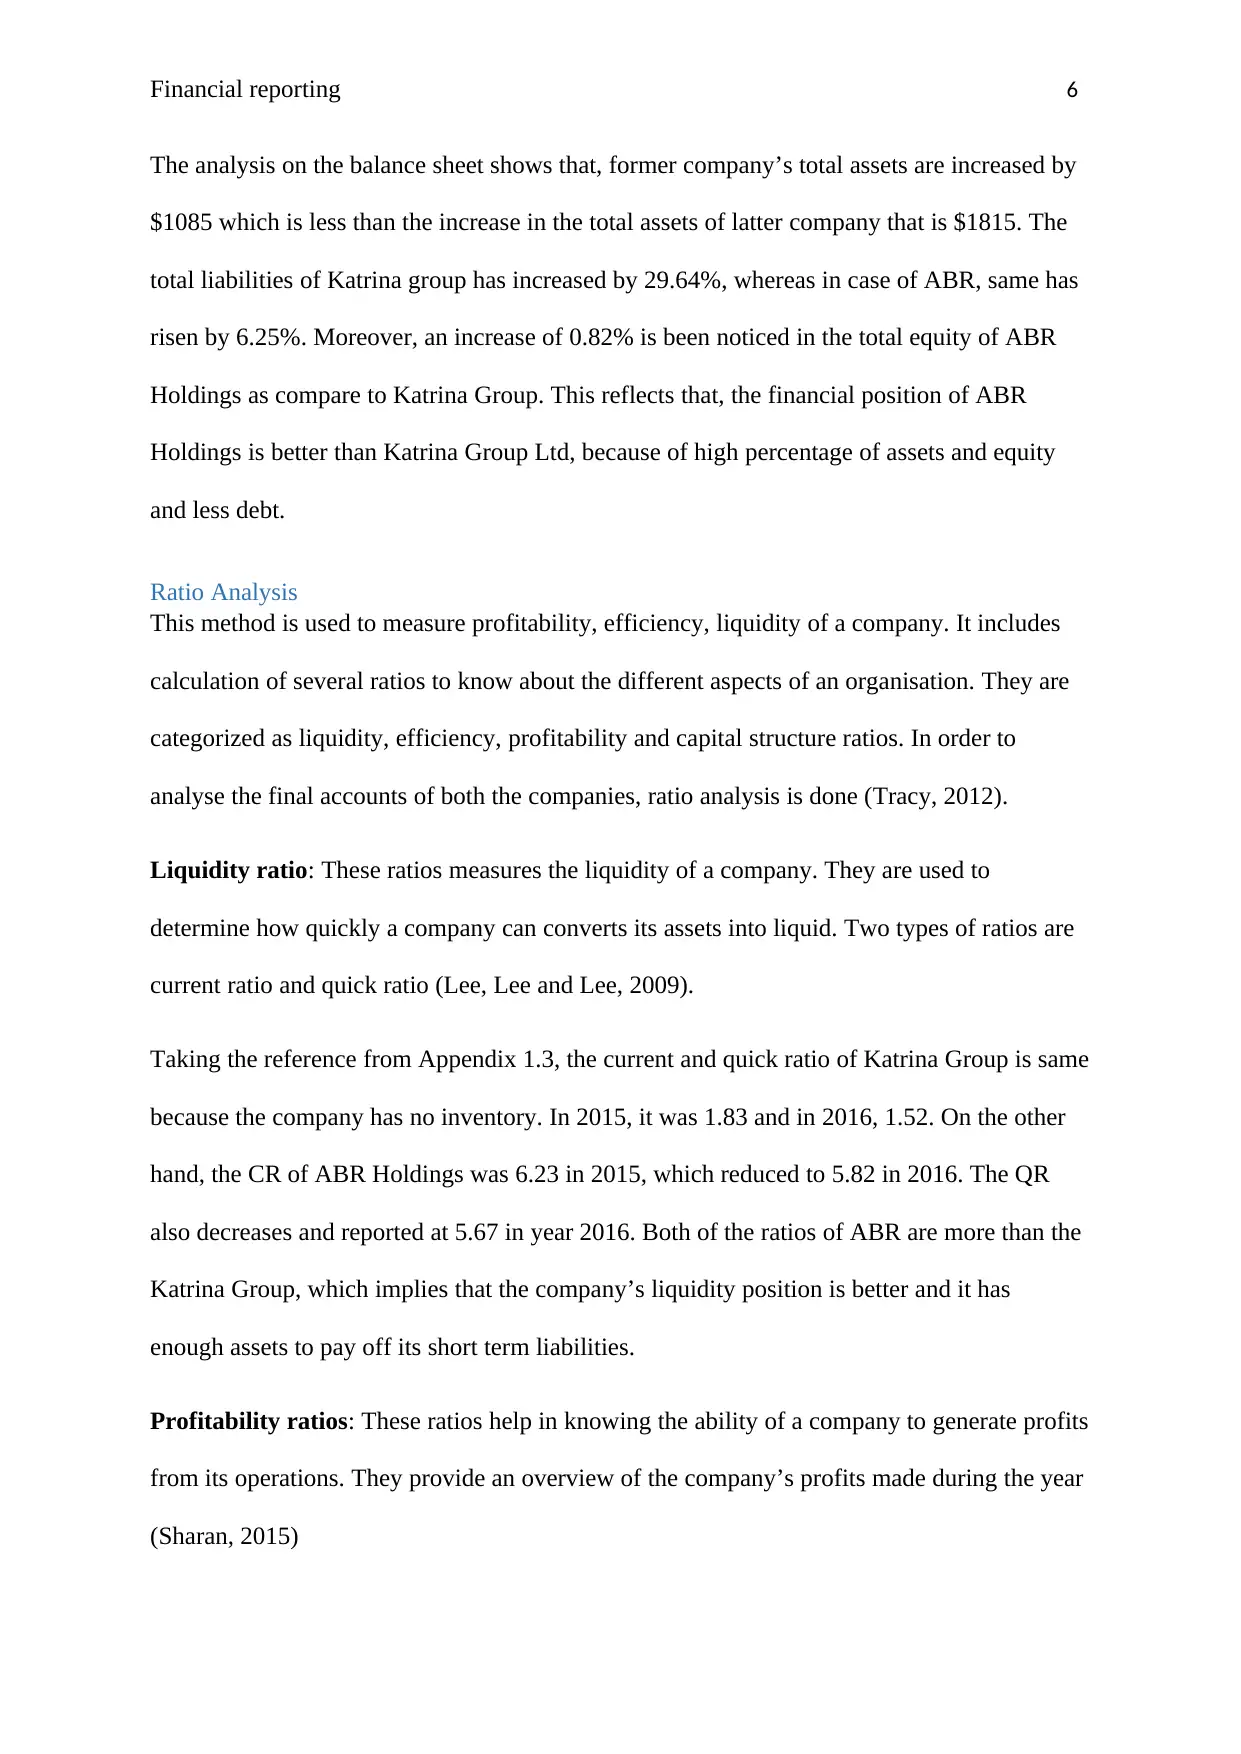
The vertical analysis of the balance sheet shows that Katrina’s portion of current assets is
52.45% of the total assets in 2015, which raised to 55.15% in 2016. Whereas, the current
liabilities comprises of 28.71%, that increased to 36.28% in 2016. This shows that Katrina
Group has strong position of its working capital and can meet its financial obligation easily.
Moreover, the percentage of total equity is also higher than the liabilities. Similarly, ABR
Holdings also has higher portion of assets and equity than the liabilities but when compare to
Katrina, it has more assets and equity and very less portion of liabilities. In 2016, ABR’s
equity comprises 85.45% of total liabilities and equity, current assets were 77.98% of total
assets and current liabilities were only 13.39% of total liabilities. This implies that, ABR is
better at maintaining its capital structure and meeting its short term and long term obligations.
Horizontal analysis: It measures year to year change in each and every item of financial
statement. The change is determined in both the terms, dollar and percentage by taking one
year as a base. In other words, the analysis shows increase or decrease in the items of
statement (Godwin and Alderman, 2012).
Referring to Appendix 1.2, in income statement, the revenue of Katrina Group has been
increased by $4928 and 9.5% in 2016 along with the increase in gross profit of $128 and
1.5%. In contrary to this, revenue of ABR has increased by $3514 and 3.5% with a rise of
0.1% in gross profit. But in terms of amount, revenue and GP of ABR is much more than
Katrina Group. All the expenses has increased except the interest expense of Katrina Group
which has reduced by $6. The net profit of both the companies has reduced in 2016 but
comparatively, the decrease in the profit of ABR is less than that of in the profit of Katrina
Group Ltd. ABR’s profit falls by 21.8% and the former company’s profit decreases by
44.3%. So overall, it can be said that, though the change in the revenue earned by ABR is less
but the company is making profits which are more than Katrina Group.
⊘ This is a preview!⊘
Do you want full access?
Subscribe today to unlock all pages.
Trusted by 1+ million students worldwide
Financial reporting 6
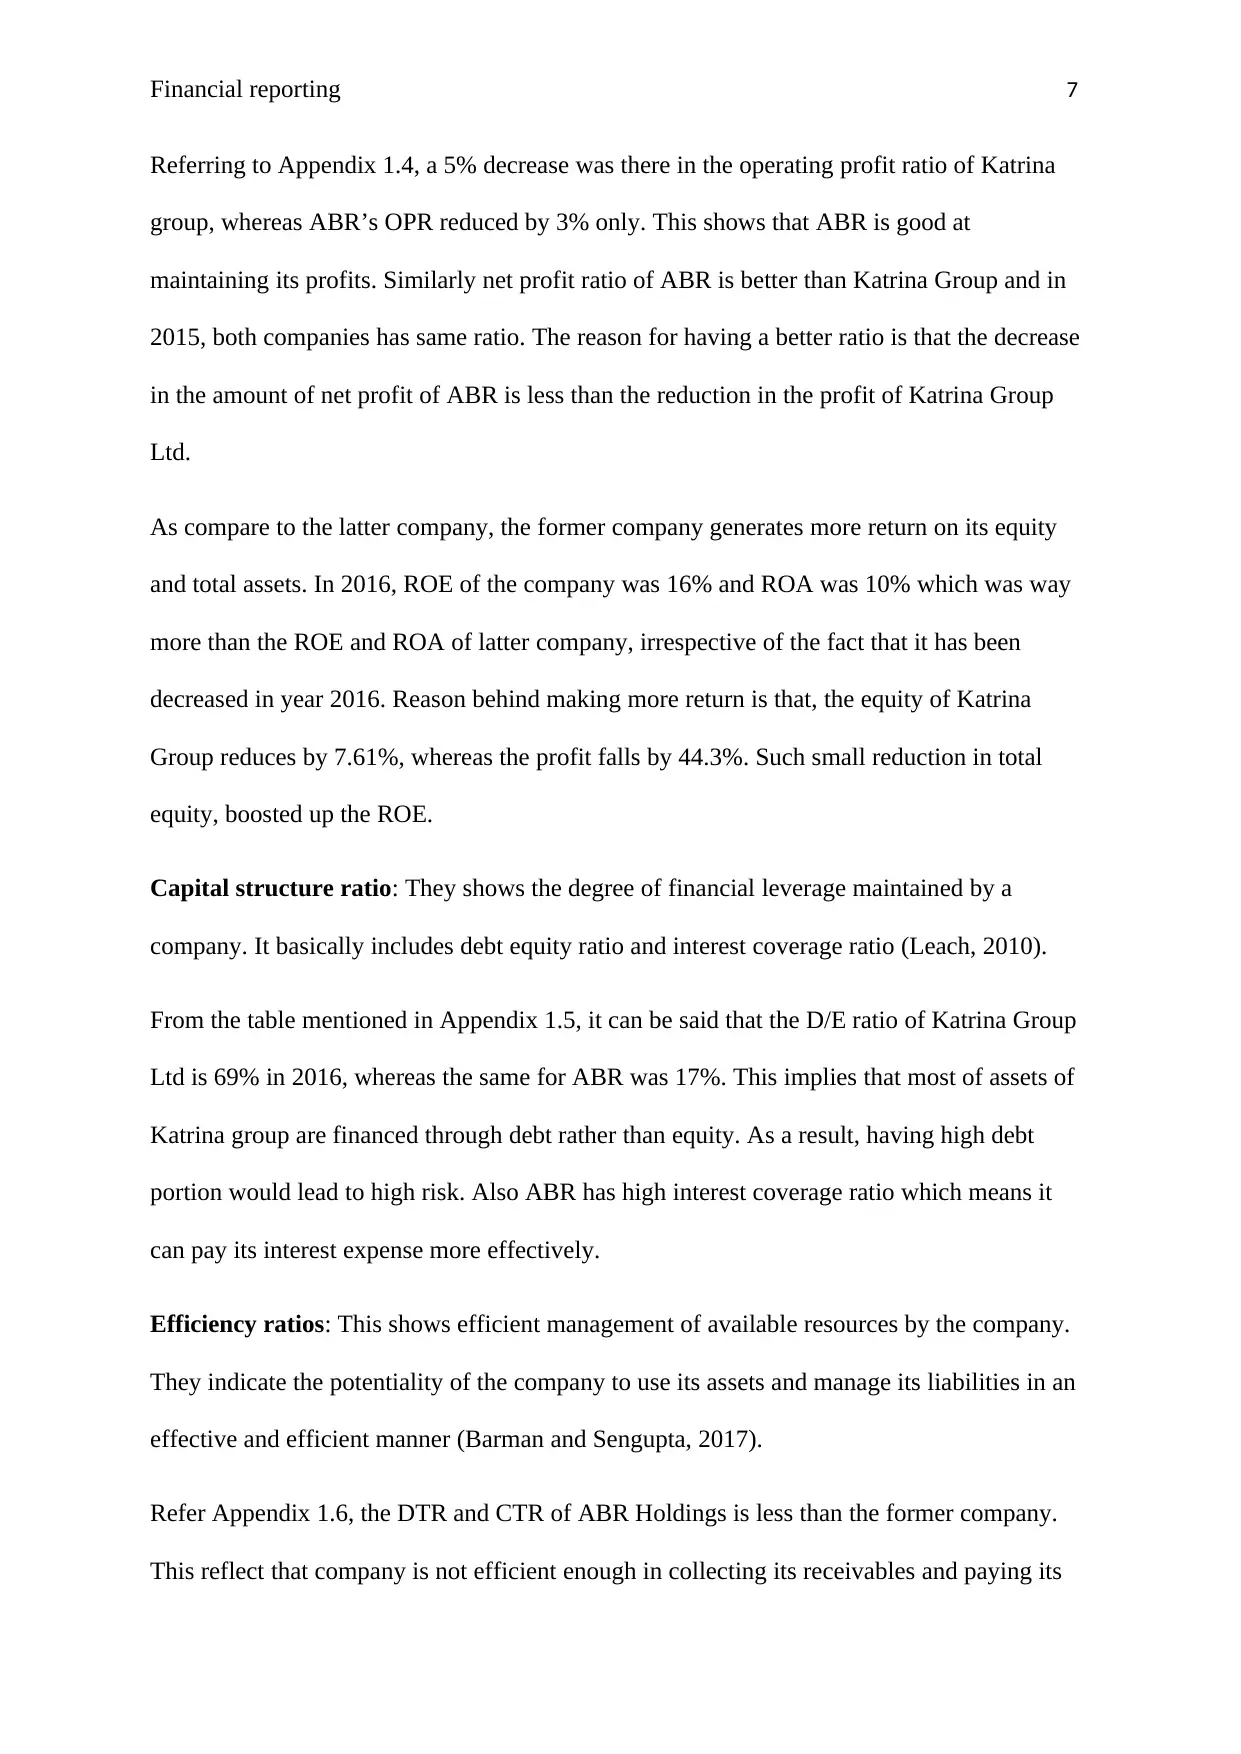
The analysis on the balance sheet shows that, former company’s total assets are increased by
$1085 which is less than the increase in the total assets of latter company that is $1815. The
total liabilities of Katrina group has increased by 29.64%, whereas in case of ABR, same has
risen by 6.25%. Moreover, an increase of 0.82% is been noticed in the total equity of ABR
Holdings as compare to Katrina Group. This reflects that, the financial position of ABR
Holdings is better than Katrina Group Ltd, because of high percentage of assets and equity
and less debt.
Ratio Analysis
This method is used to measure profitability, efficiency, liquidity of a company. It includes
calculation of several ratios to know about the different aspects of an organisation. They are
categorized as liquidity, efficiency, profitability and capital structure ratios. In order to
analyse the final accounts of both the companies, ratio analysis is done (Tracy, 2012).
Liquidity ratio: These ratios measures the liquidity of a company. They are used to
determine how quickly a company can converts its assets into liquid. Two types of ratios are
current ratio and quick ratio (Lee, Lee and Lee, 2009).
Taking the reference from Appendix 1.3, the current and quick ratio of Katrina Group is same
because the company has no inventory. In 2015, it was 1.83 and in 2016, 1.52. On the other
hand, the CR of ABR Holdings was 6.23 in 2015, which reduced to 5.82 in 2016. The QR
also decreases and reported at 5.67 in year 2016. Both of the ratios of ABR are more than the
Katrina Group, which implies that the company’s liquidity position is better and it has
enough assets to pay off its short term liabilities.
Profitability ratios: These ratios help in knowing the ability of a company to generate profits
from its operations. They provide an overview of the company’s profits made during the year
(Sharan, 2015)
Paraphrase This Document
Need a fresh take? Get an instant paraphrase of this document with our AI Paraphraser
Financial reporting 7
Referring to Appendix 1.4, a 5% decrease was there in the operating profit ratio of Katrina
group, whereas ABR’s OPR reduced by 3% only. This shows that ABR is good at
maintaining its profits. Similarly net profit ratio of ABR is better than Katrina Group and in
2015, both companies has same ratio. The reason for having a better ratio is that the decrease
in the amount of net profit of ABR is less than the reduction in the profit of Katrina Group
Ltd.
As compare to the latter company, the former company generates more return on its equity
and total assets. In 2016, ROE of the company was 16% and ROA was 10% which was way
more than the ROE and ROA of latter company, irrespective of the fact that it has been
decreased in year 2016. Reason behind making more return is that, the equity of Katrina
Group reduces by 7.61%, whereas the profit falls by 44.3%. Such small reduction in total
equity, boosted up the ROE.
Capital structure ratio: They shows the degree of financial leverage maintained by a
company. It basically includes debt equity ratio and interest coverage ratio (Leach, 2010).
From the table mentioned in Appendix 1.5, it can be said that the D/E ratio of Katrina Group
Ltd is 69% in 2016, whereas the same for ABR was 17%. This implies that most of assets of
Katrina group are financed through debt rather than equity. As a result, having high debt
portion would lead to high risk. Also ABR has high interest coverage ratio which means it
can pay its interest expense more effectively.
Efficiency ratios: This shows efficient management of available resources by the company.
They indicate the potentiality of the company to use its assets and manage its liabilities in an
effective and efficient manner (Barman and Sengupta, 2017).
Refer Appendix 1.6, the DTR and CTR of ABR Holdings is less than the former company.
This reflect that company is not efficient enough in collecting its receivables and paying its
Financial reporting 8
creditors. Inventory turnover ratio of ABR is 24.2 and of Katrina group is 0 because of no
inventory in the business. The ATR of former company was reported at 2.37 cents, which is
more than the latter company’s ATR of 0.89 cents. So, on a whole it means that Katrina
Group is much more efficient than ABR in maintaining its resources.
Cash flow Analysis
Cash flow statement shows the inflow and outflow of the cash in the business. In Appendix
1.7, the cash flow statements of both the companies are analysed. In year 2016, ABR has
generated more cash from its operations than Katrina, amounted to $9376, though less than
that of in 2015. This is because the changes in working capital of the company are
comparatively less, creditors has increased which leads to the inflow of cash in the business.
Talking about investing activities, Katrina only has cash outflow of $2016 and $602 for the
purpose of purchasing property and acquiring shares. On the other hand, major cash outflow
in ABR’s investing activities was in purchase of property amounted to $5839 in 2016. This
resulted in net cash used worth $5074, which is more than that of Katrina group. Similarly, in
financing activities, ABR and Katrina group has more cash outflow than inflow. But
comparatively, the net cash used in the financing activities of Katrina group Ltd, is less than
ABR because of its gross proceeds from IPO worth $7518. This overall analysis shows that,
the former company is slightly more effective and efficient in managing its cash position than
the latter company (Jury, 2012).
Segment analysis
The analysis of each and every segment of the companies is done. The revenue generated
from the segments is determined. Referring to Appendix 1.8, Katrina’s most of the revenue is
generated from Singapore amounted to $54,941 and the non-current assets used are worth
$6,798 (Katrinagroup.com. 2016). On the other hand, ABR has its revenue mostly form
Singapore and Malaysia amounted to $89,611 and $14,239 respectively. Also its Non-current
⊘ This is a preview!⊘
Do you want full access?
Subscribe today to unlock all pages.
Trusted by 1+ million students worldwide
Financial reporting 9
assets are in the same countries worth $20,828 and $4,866. This shows that segments of ABR
produces more revenue than Katrina Group Ltd., reason being the company not only operates
in Singapore but also in Malaysia and rest of the Asia (Abr.com.sg. 2016).
Recommendation and conclusion
From the above analysis, it can be recommended that ABR Holding is performing well in
comparison to Katrina Group Ltd. It has high liquidity and profitability position and is also
less risky because of less debt financing. Though it generate less returns on its assets and
equity, but from other aspects it is way better than Katrina Group. For an investor, it will be
better to choose ABR over Katrina Group for the purpose of investment because of its high
profits, high sales and less borrowings or debt. Moreover, it is capable of generating enough
cash from its operations. So, ABR Holdings is a desirable option for investing the funds.
Paraphrase This Document
Need a fresh take? Get an instant paraphrase of this document with our AI Paraphraser
Financial reporting 10
References
Abr.com.sg. (2016). ANNUAL REPORT 2016. [Online] Available at:
http://www.abr.com.sg/pdf/ABR_Annual_Report_2016.pdf [Accessed 6 Mar. 2018].
Abr.com.sg. (2018). Company Profile. [Online] Available at:
http://www.abr.com.sg/profile.html [Accessed 6 March 2018].
Barman, A.N. and Sengupta, P.P., (2017). DETERMINANTS OF PROFITABILITY IN
INDIAN TELECOM INDUSTRY USING FINANCIAL RATIO ANALYSIS. International
Journal of Research in Management & Social Science, p.25.
Bragg, S.M., (2012). Financial analysis: a controller's guide. 2nd ed. New Jersey: John Wiley
& Sons.
Dbs.com (2016). Singapore Company Focus Katrina Group [Online] Available at:
https://www.dbs.com.sg/private-banking/aics/pdfController.page?pdfpath=/content/article/
pdf/KTG_SP_EQUITY/2016/09/KTG_SP_EQUITY_24_01092016.pdf [Accessed 6 March
2018].
Godwin, N. and Alderman, C., (2012). Financial ACCT2. USA: Cengage Learning.
Jury, T., (2012). Cash flow analysis and forecasting: the definitive guide to understanding
and using published cash flow data (Vol. 653). UK: John Wiley & Sons.
Katrinagroup.com. (2018). Katrina Group | Who We Are. [Online] Available at:
http://katrinagroup.com/who-we-are/ [Accessed 6 March 2018].
Financial reporting 11
Katrinagroup.listedcompany.com. (2016). Annual Report 2016. [Online] Available at:
http://katrinagroup.listedcompany.com/newsroom/20170405_171330_1A0_Y2CREUV5UH4
EXVCW.1.pdf [Accessed 6 Mar. 2018].
Leach, R., (2010). Ratios made simple: a beginner's guide to the key financial ratios. Britain:
Harriman House Limited.
Lee, A.C., Lee, J.C. and Lee, C.F., (2009). Financial Analysis, Planning and Forecasting:
Theory and Application Second Edition. 2nd ed. Singapore: World Scientific Publishing
Company.
Sharan, V., (2015). Fundamentals of Financial Management. 3rd ed. New Delhi: Pearson
Education India.
Swotanalysis24.com. (2018). ABR Holdings Ltd SWOT Analysis - Strengths, Weaknesses,
Opportunities, Threats of ABR Holdings Ltd. [Online] Available at:
https://www.swotanalysis24.com/swot-a/924-swot-analysis-abr-holdings-ltd.html [Accessed
6 March 2018].
Tracy, A., (2012). Ratio analysis fundamentals: how 17 financial ratios can allow you to
analyse any business on the planet. RatioAnalysis. Net
Weygandt, J.J., Kimmel, P.D. and Kieso, D.E., (2009). Managerial accounting: tools for
business decision making. 5th ed. New Jersey: John Wiley & Sons.
⊘ This is a preview!⊘
Do you want full access?
Subscribe today to unlock all pages.
Trusted by 1+ million students worldwide
1 out of 21
Related Documents


Your All-in-One AI-Powered Toolkit for Academic Success.
+13062052269
info@desklib.com
Available 24*7 on WhatsApp / Email
![[object Object]](/_next/static/media/star-bottom.7253800d.svg)
Unlock your academic potential
Copyright © 2020–2026 A2Z Services. All Rights Reserved. Developed and managed by ZUCOL.