Abu Dhabi University: Financial Statement Analysis of KFC, 2017-2019
VerifiedAdded on 2020/12/01
|15
|2678
|442
Report
AI Summary
This report provides a comprehensive financial statement analysis of KFC, examining its performance from 2017 to 2019. The analysis employs various financial ratios, including liquidity, activity, debt, and profitability ratios, to assess KFC's financial health and operational efficiency. The study evaluates KFC's ability to manage short-term obligations, efficiently utilize assets, manage debt, and generate profits. The report analyzes trends in key financial metrics such as current ratio, quick ratio, inventory turnover, debt ratio, and return on equity, offering insights into KFC's strengths, weaknesses, and overall financial stability. The analysis also highlights the company's performance in comparison to previous years and discusses potential implications for investors and management decisions. The report concludes with an assessment of KFC's financial performance and provides recommendations based on the findings.
Financial Statement Analysis of KFC
Saree Abdullah Brake
Abu Dhabi University, Email: 1063765@students.adu.ac.ae
Supervised by:
Professor Haitham Nobanee
Abstract
Financial ratios derived from past data are adapted in many research studies to analyze and
estimate the uncertain future of business and related industries in general. These ratios give the
general health of an entity and are critical in evaluating the strengths and weaknesses of a
business entity. Besides, these ratios are significant in ascertain vulnerabilities and challenges
that businesses face. The information obtained from such data is not only important to the top
management but also varied users of information in determining investing decisions. In this
context, financial ratios are employed to assess the health and performance of a company. This
study aims to conduct an in-depth ratio analysis of KFC limited, using data derived from the past
four years.
Paraphrase This Document
Need a fresh take? Get an instant paraphrase of this document with our AI Paraphraser
2
Introduction
KFC Founded on1952, North Corbin, Kentucky, United States. Presently, KFC is among the best
chicken restaurants recognized globally. It has in excess outlets of 21,000 in more than 130
countries and regions globally (Achola, 2016).
KFC is operated partly as equity, and partly as a franchised model with the reports as late as
December 2018, 98% of its restaurants are operating as franchises. The corporation is part of
Yum! Brands, which has its headquarters in Louisville, Kentucky. Besides having has over
43,5000 restaurants, operating in more than 135 countries and regions (Dittfurth, Gerhardt &
Joiner, 2019).
With the main focus being on fried chicken, the company also sells chicken pieces, wraps,
salads, and sandwiches. KFC is one of the best-established brands in the Western Quick Service
Restaurants.
The two main strategic intents of any entity are profitability and solvency. Profitability refers to
the capability of an entity to ascertain profits, while solvencies can be defined as the capability of
a firm to offset its obligations (Öztekin, 2015). On the contrary, the achievement of these aims
requires proper management of a company’s resources. This is concisely conducted through
planning, budgeting, forecasting, controlling, and decision making (Alkaabi & Nobanee, 2019).
Besides, the strengths and weaknesses of a business entity should be identified so that corrective
and appropriate measures should be applied (Öztekin, 2015).
In a completive market, there is always the freedom of entry and exit. Stockholders and investors
use financial ratios in evaluating the value of institutions for investment decisions. Some studies
demonstrated the insufficiencies of disclosed financial ratios in satisfying shareholders'
information needs (Chiaramonte & Casu, 2017). Assessment of investment opportunities is very
3
critical due to the need for maximizing returns. Corporate entities require capital funds which are
then made available by the investors after they can evaluate the firm’s value through conducting
financial reports analyses (Al-Mahmoud & Nobanee, 2020)
Basic knowledge of ratio analysis is required for wealth maximization (Minnis & Sutherland,
2017). This facilitates the production of goods and services, and for the growth of an economy
in general.
A financial ratio is a widely adopted technique in financial analysis (Alkaabi & Nobanee, 2019).
The application of financial ratios in the interpretation of financial statements demonstrates a
quick indication of an entity’s performance and financial position to varied users of financial
statements (Robinson, 2020).
analyses
The information needs of potential investors can be ascertained through financial ratio analysis.
If the finale information disclosed in a corporate’s financial statements does not satisfy the
investor’s need for information, they might make wrong economic decisions (Alnuaimi &
Nobanee, 2020) This will adversely affect their investments should they ignore to consider the
importance of financial ratio analysis, as a source of additional information about the company
(Minnis & Sutherland, 2017).
Methodology
Robinson, (2020) define ratio as the fractional relationship pf one number to another. On the
other hand, it defines ratio analysis as a “tool of financial analysis where a meaningful
relationship is derived between the financial statement components” (Robinson, 2020).
⊘ This is a preview!⊘
Do you want full access?
Subscribe today to unlock all pages.
Trusted by 1+ million students worldwide
4
Ratio analysis if adapted to proportionality express the relationship between figures in a finical
statement (Al-Mahmoud & Nobanee, 2020) . Ratios are quick guides or shortcuts that are
important in evaluating a firm's financial position and activities and making comparisons with
previous years' results of other businesses in the same industry (Ichsani & Suhardi, 2015).
The key purpose of this ratio is to identify key areas that require further investigation. They are
used proportionately in understanding the firm and its environment. Arkan, (2016) noted that
ratios are most meaningful when used in comparison since making generalizations regarding
what good or bad is difficult for any particular value (Arkan, 2016). A single measure cannot
show the whole situation about a company and one measure should not be adopted as the sole
criteria for a final decision. Minnis and Sutherland, (2017). added that a "standing alone", a
single ratio in the financial analysis may not be informative. Greater insights are achieved by
computing and analyzing several related ratios for a business entity (Minnis & Sutherland,
2017).
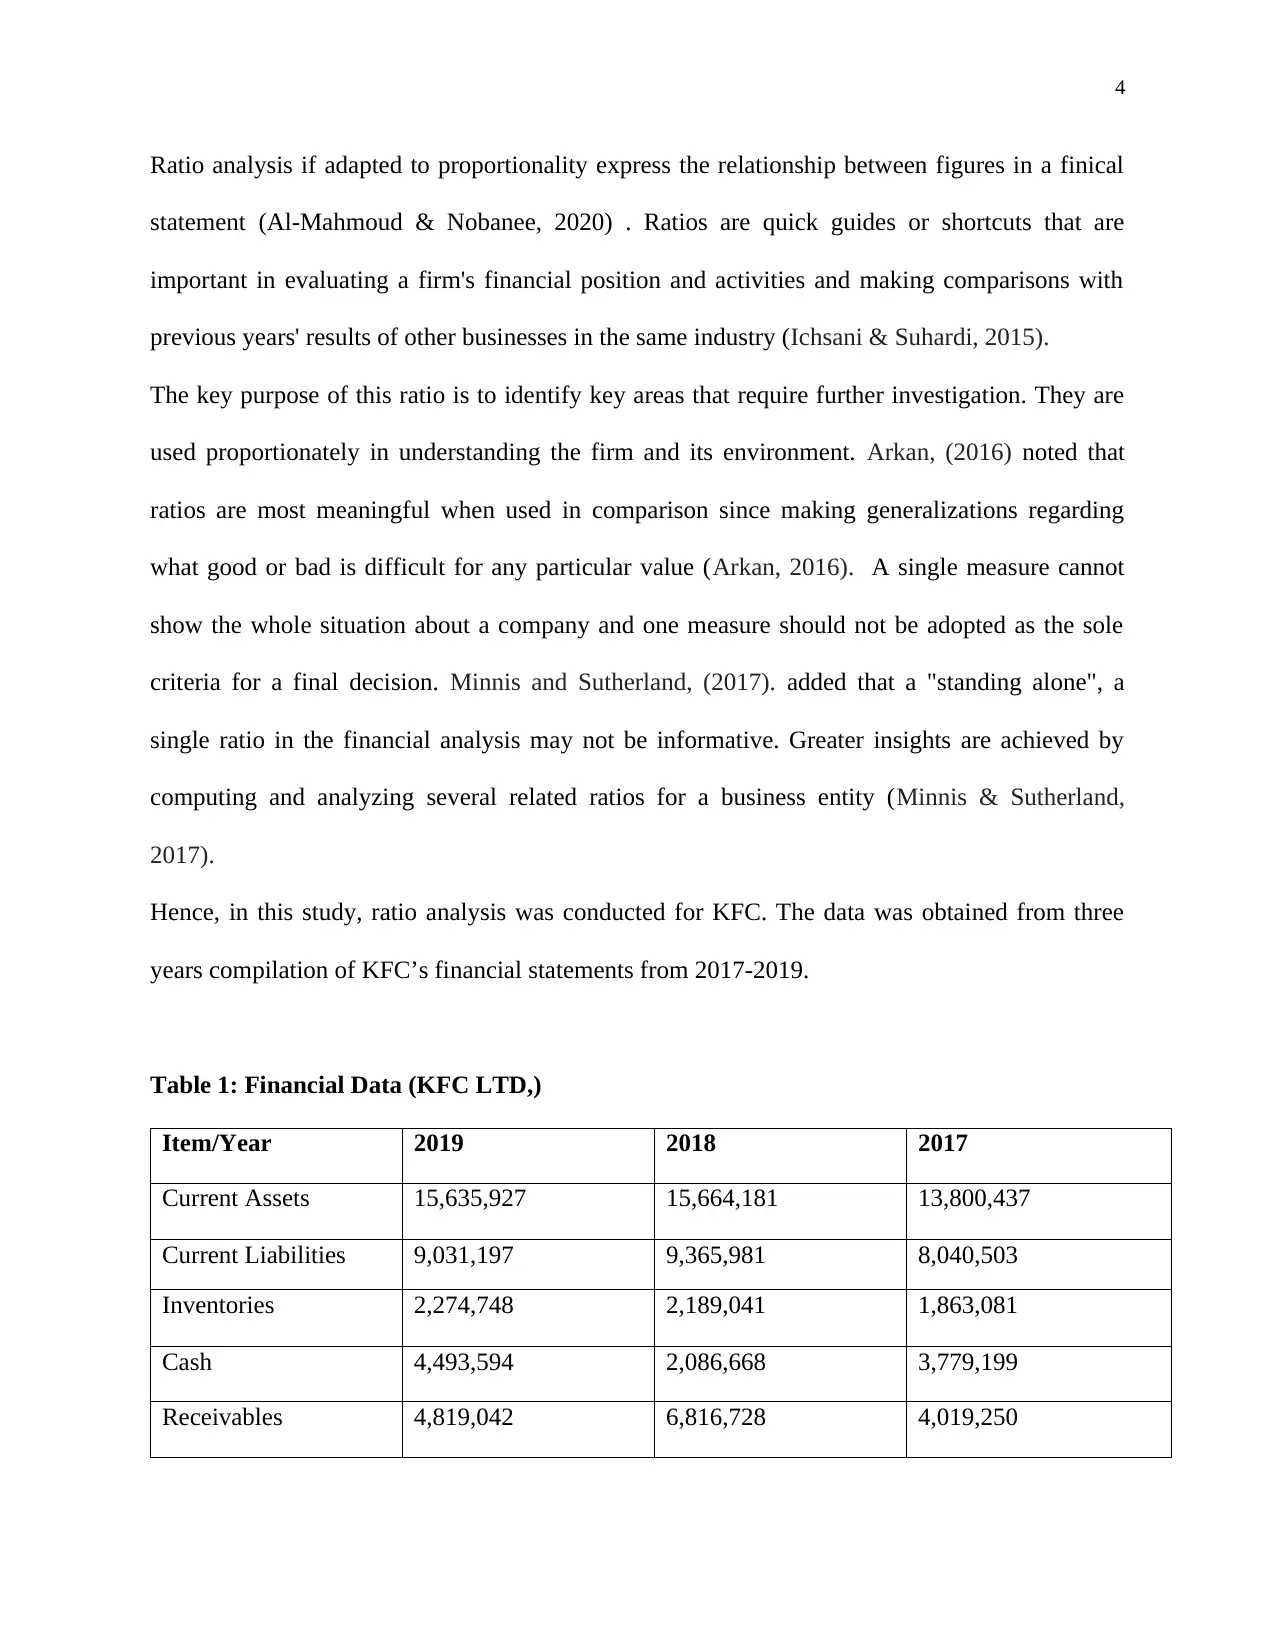
Hence, in this study, ratio analysis was conducted for KFC. The data was obtained from three
years compilation of KFC’s financial statements from 2017-2019.
Table 1: Financial Data (KFC LTD,)
Item/Year 2019 2018 2017
Current Assets 15,635,927 15,664,181 13,800,437
Current Liabilities 9,031,197 9,365,981 8,040,503
Inventories 2,274,748 2,189,041 1,863,081
Cash 4,493,594 2,086,668 3,779,199
Receivables 4,819,042 6,816,728 4,019,250
Ratio analysis if adapted to proportionality express the relationship between figures in a finical
statement (Al-Mahmoud & Nobanee, 2020) . Ratios are quick guides or shortcuts that are
important in evaluating a firm's financial position and activities and making comparisons with
previous years' results of other businesses in the same industry (Ichsani & Suhardi, 2015).
The key purpose of this ratio is to identify key areas that require further investigation. They are
used proportionately in understanding the firm and its environment. Arkan, (2016) noted that
ratios are most meaningful when used in comparison since making generalizations regarding
what good or bad is difficult for any particular value (Arkan, 2016). A single measure cannot
show the whole situation about a company and one measure should not be adopted as the sole
criteria for a final decision. Minnis and Sutherland, (2017). added that a "standing alone", a
single ratio in the financial analysis may not be informative. Greater insights are achieved by
computing and analyzing several related ratios for a business entity (Minnis & Sutherland,
2017).
Hence, in this study, ratio analysis was conducted for KFC. The data was obtained from three
years compilation of KFC’s financial statements from 2017-2019.
Table 1: Financial Data (KFC LTD,)
Item/Year 2019 2018 2017
Current Assets 15,635,927 15,664,181 13,800,437
Current Liabilities 9,031,197 9,365,981 8,040,503
Inventories 2,274,748 2,189,041 1,863,081
Cash 4,493,594 2,086,668 3,779,199
Receivables 4,819,042 6,816,728 4,019,250
Paraphrase This Document
Need a fresh take? Get an instant paraphrase of this document with our AI Paraphraser
5
Total Assets 23,777,212 23,542,631 20,669,136
Total Liabilities 9,561,779 10,328,015 9,114,572
Total Equity 14,211,339 13,209,115 11,554,564
Sales 24,674,004 25,716,165 23,497,760
Cost of Goods Sold 17,567,841 17,944,952 15,881,985
EBIT 2,330,797 2,636,218 2,798,914
Interest 12,739 16,485 22,879
Net Income 1,562,779 1,762,520 1,869,780
All Numbers in millions, Source: Yahoo Finance
Results and Discussion
Liquidity ratio analysis allows a company to measure its ability in managing short-term
obligations (Chiaramonte & Casu,2017). It mainly highlights if an entity can offset its liabilities
should they arise. In this paper, we apply the Current ratio, Cash ratio, and Quick ratio to
analyses if KFC Inc has the necessary liquidity.
Liquidity Ratios of (KFC LTD)
Ratio/Year 2019 2018 2017
Current Ratio 1.73 1.67 1.72
Quick Ratio 0.73 0.67 0.72
Cash Ratio 0.50 0.22 0.47
6
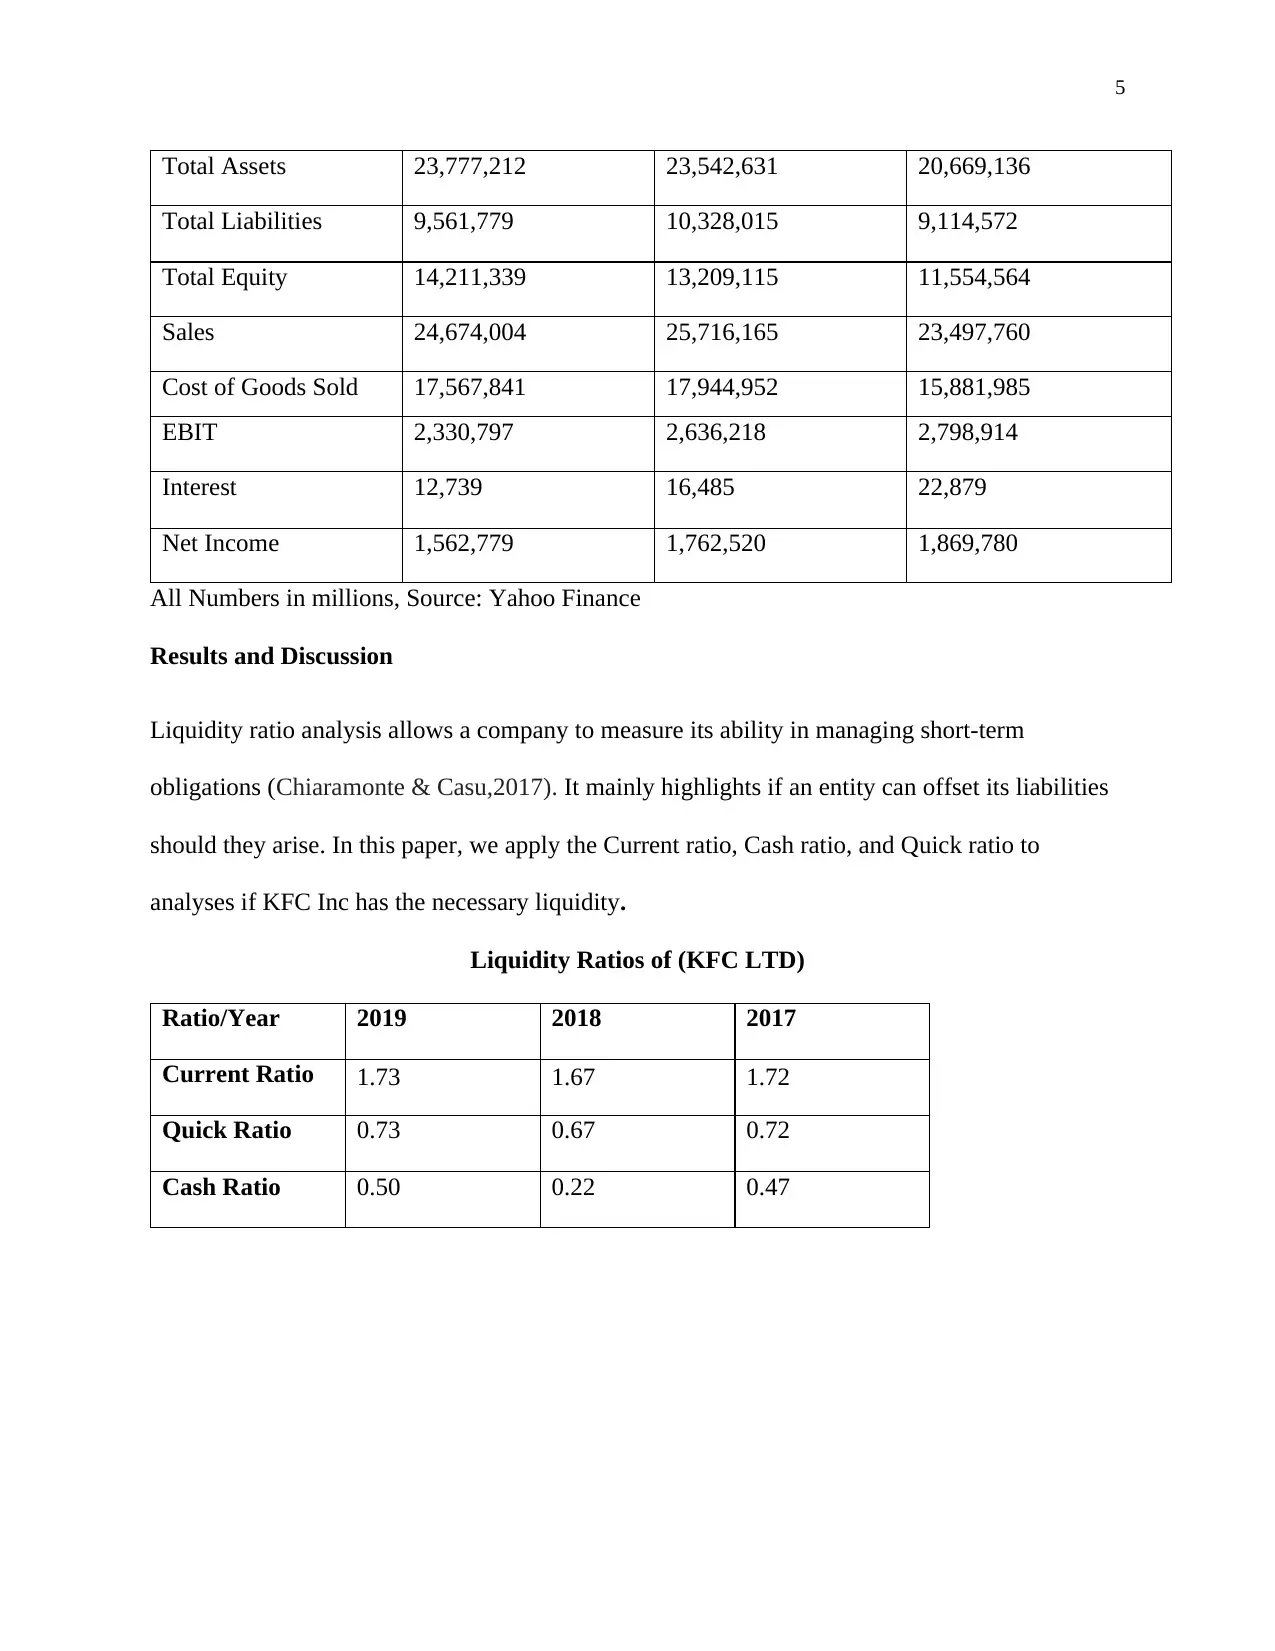
Current Ratio
2019 2018 2017
1.64
1.65
1.66
1.67
1.68
1.69
1.7
1.71
1.72
1.73
1.74
Current Ratio
This measures the capability of a firm to offset short term debts and meet unexpected cash
demands. For the past three years, KFC has maintained an average value of more than 1.6 of its
current ratios. This implies KFC has a good position in meeting short-term obligations should
they fall due.
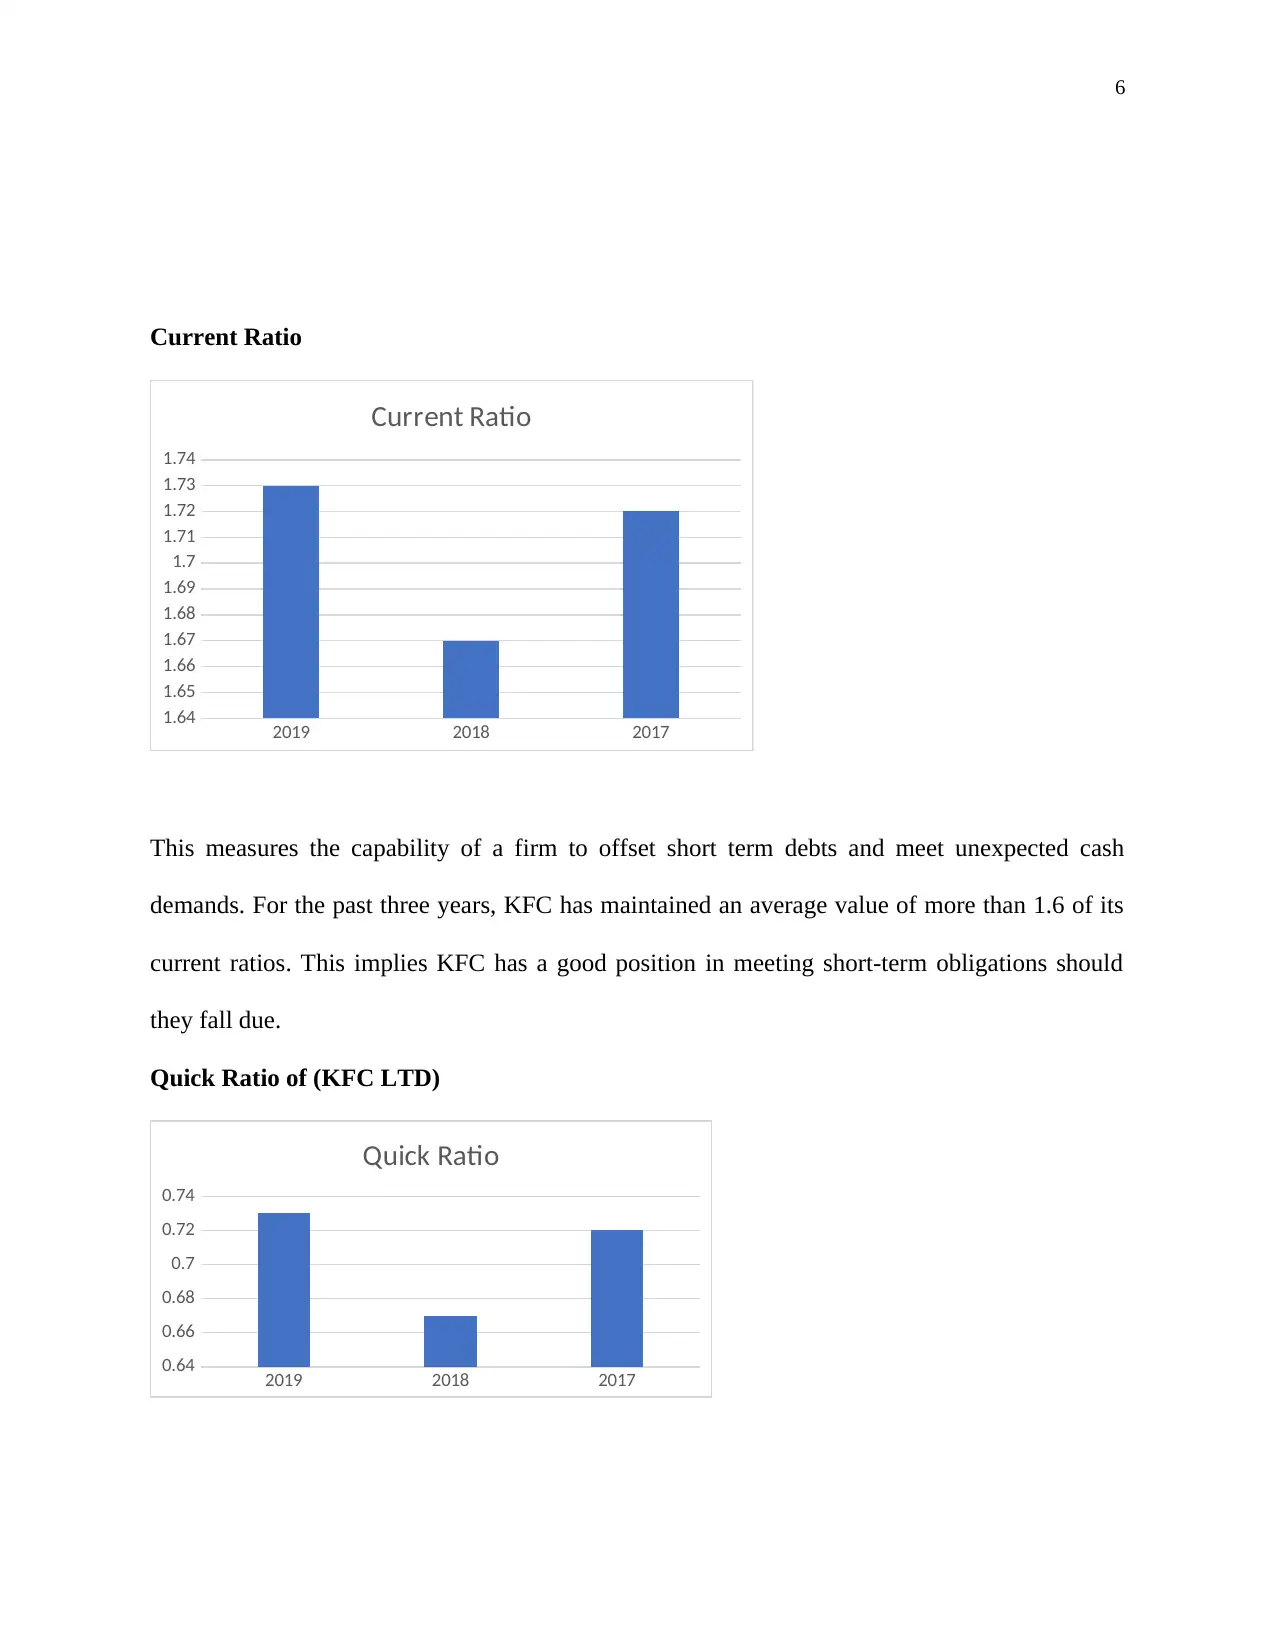
Quick Ratio of (KFC LTD)
2019 2018 2017
0.64
0.66
0.68
0.7
0.72
0.74
Quick Ratio
Current Ratio
2019 2018 2017
1.64
1.65
1.66
1.67
1.68
1.69
1.7
1.71
1.72
1.73
1.74
Current Ratio
This measures the capability of a firm to offset short term debts and meet unexpected cash
demands. For the past three years, KFC has maintained an average value of more than 1.6 of its
current ratios. This implies KFC has a good position in meeting short-term obligations should
they fall due.
Quick Ratio of (KFC LTD)
2019 2018 2017
0.64
0.66
0.68
0.7
0.72
0.74
Quick Ratio
⊘ This is a preview!⊘
Do you want full access?
Subscribe today to unlock all pages.
Trusted by 1+ million students worldwide
7
This ratio discloses the extent of cash and other current assets to be readily converted into cash in
meeting the firm’s short-term obligations. From the data, KFC can convert its current assets into
cash easily, with 2019 recording the highest value, which is a good indication.
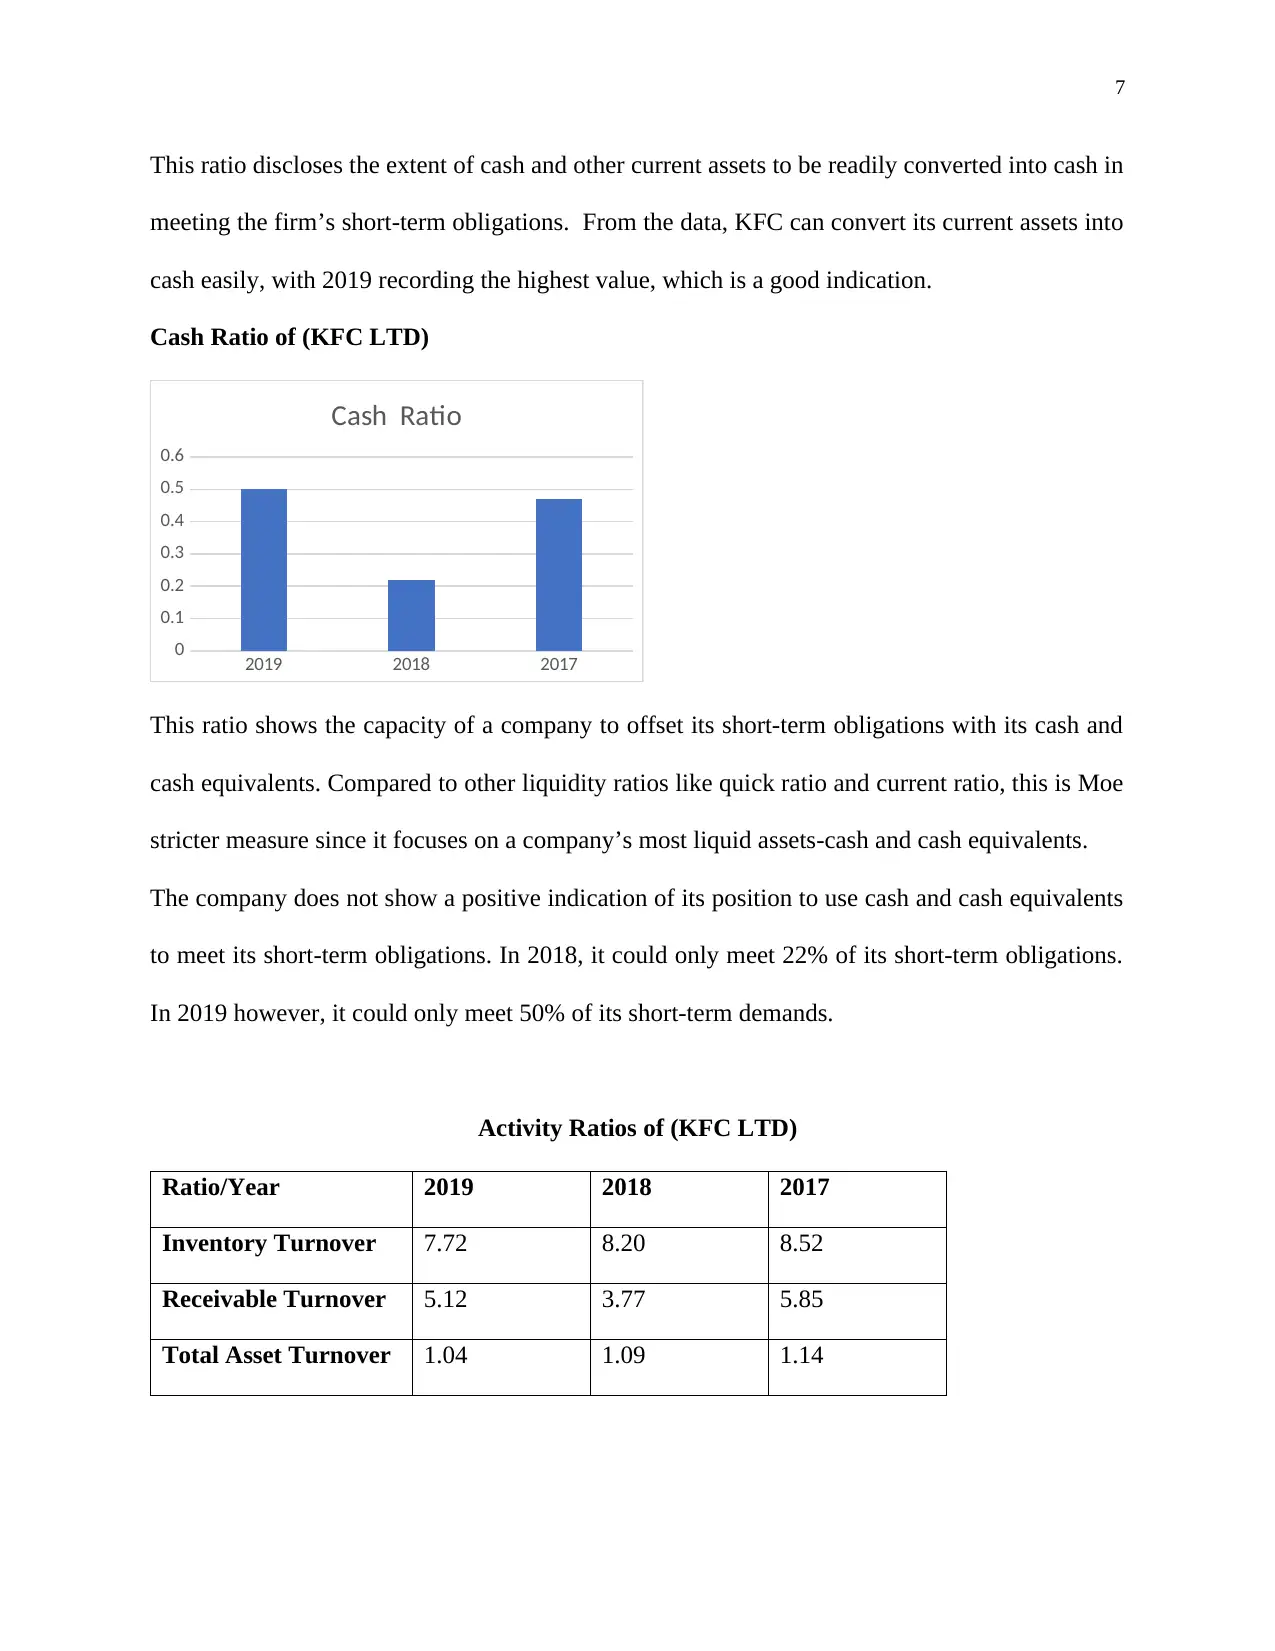
Cash Ratio of (KFC LTD)
2019 2018 2017
0
0.1
0.2
0.3
0.4
0.5
0.6
Cash Ratio
This ratio shows the capacity of a company to offset its short-term obligations with its cash and
cash equivalents. Compared to other liquidity ratios like quick ratio and current ratio, this is Moe
stricter measure since it focuses on a company’s most liquid assets-cash and cash equivalents.
The company does not show a positive indication of its position to use cash and cash equivalents
to meet its short-term obligations. In 2018, it could only meet 22% of its short-term obligations.
In 2019 however, it could only meet 50% of its short-term demands.
Activity Ratios of (KFC LTD)
Ratio/Year 2019 2018 2017
Inventory Turnover 7.72 8.20 8.52
Receivable Turnover 5.12 3.77 5.85
Total Asset Turnover 1.04 1.09 1.14
This ratio discloses the extent of cash and other current assets to be readily converted into cash in
meeting the firm’s short-term obligations. From the data, KFC can convert its current assets into
cash easily, with 2019 recording the highest value, which is a good indication.
Cash Ratio of (KFC LTD)
2019 2018 2017
0
0.1
0.2
0.3
0.4
0.5
0.6
Cash Ratio
This ratio shows the capacity of a company to offset its short-term obligations with its cash and
cash equivalents. Compared to other liquidity ratios like quick ratio and current ratio, this is Moe
stricter measure since it focuses on a company’s most liquid assets-cash and cash equivalents.
The company does not show a positive indication of its position to use cash and cash equivalents
to meet its short-term obligations. In 2018, it could only meet 22% of its short-term obligations.
In 2019 however, it could only meet 50% of its short-term demands.
Activity Ratios of (KFC LTD)
Ratio/Year 2019 2018 2017
Inventory Turnover 7.72 8.20 8.52
Receivable Turnover 5.12 3.77 5.85
Total Asset Turnover 1.04 1.09 1.14
Paraphrase This Document
Need a fresh take? Get an instant paraphrase of this document with our AI Paraphraser
8
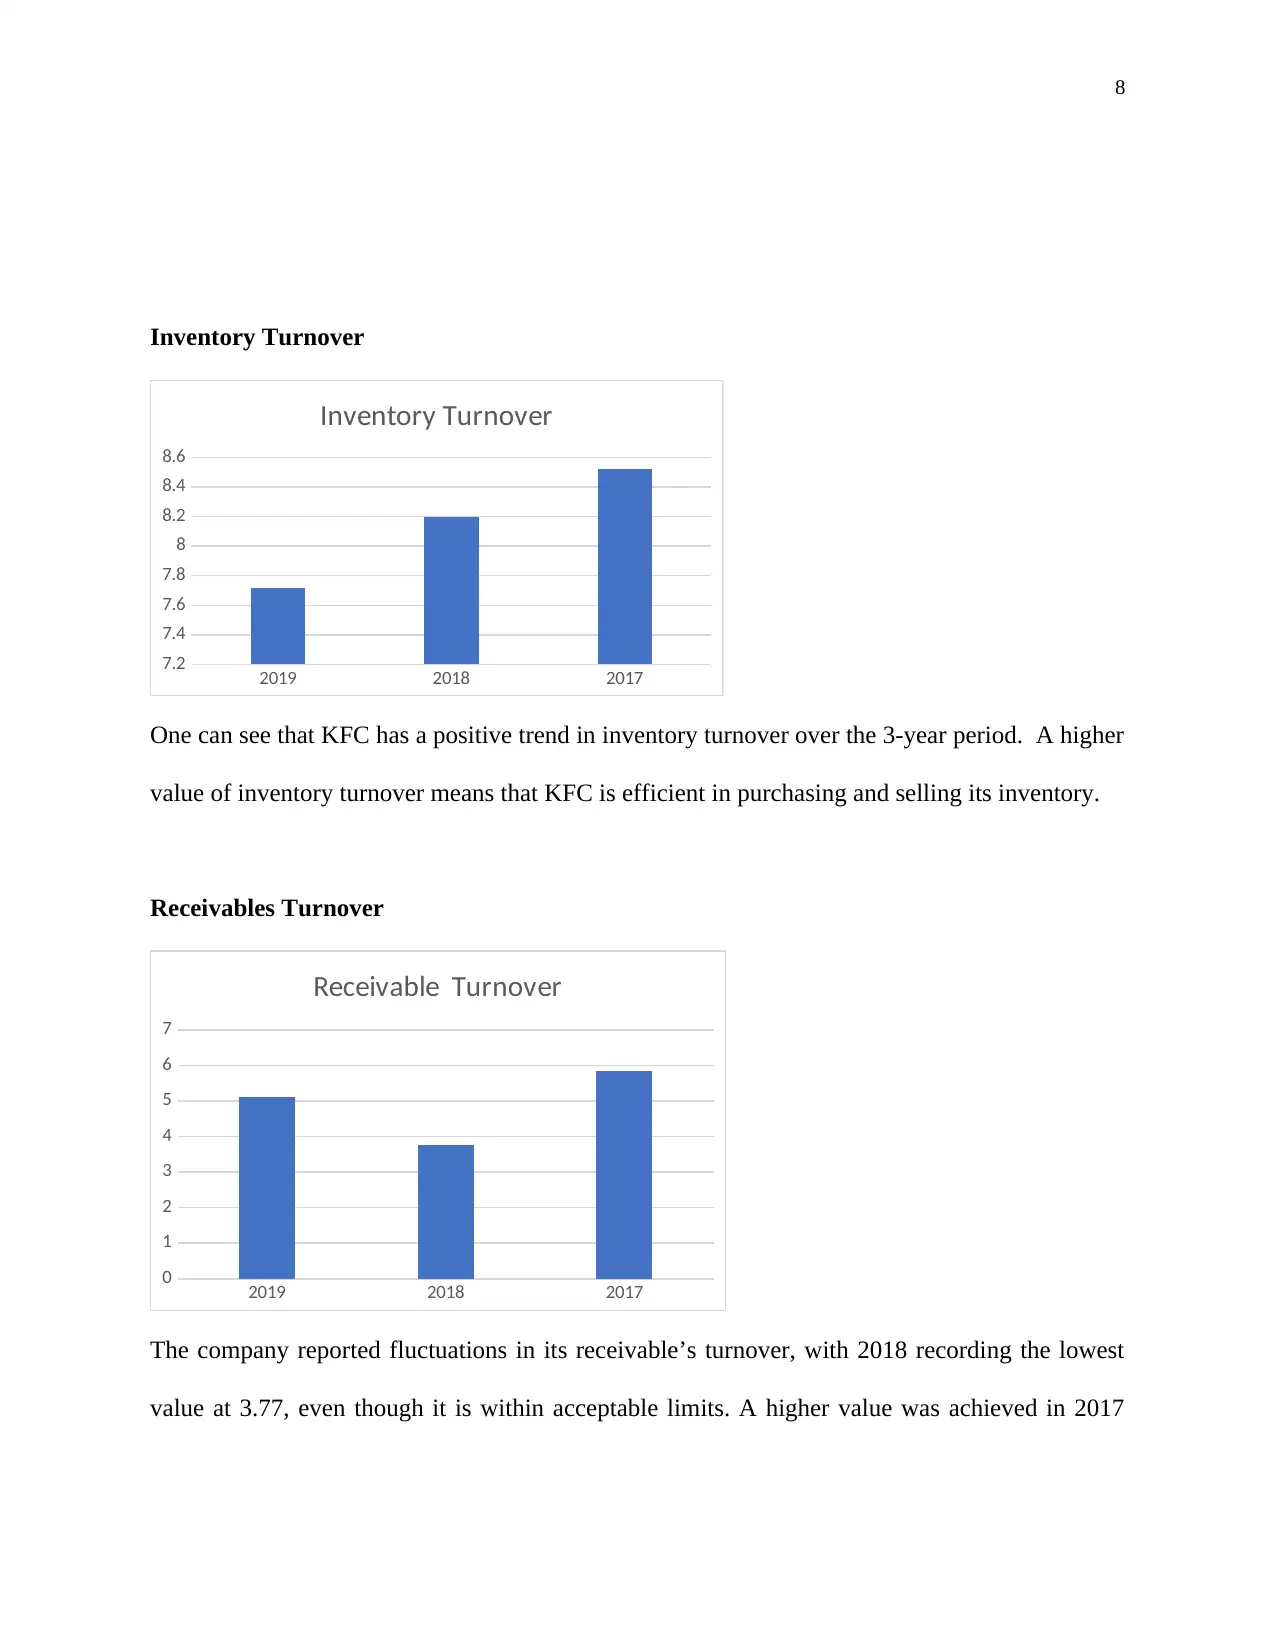
Inventory Turnover
2019 2018 2017
7.2
7.4
7.6
7.8
8
8.2
8.4
8.6
Inventory Turnover
One can see that KFC has a positive trend in inventory turnover over the 3-year period. A higher
value of inventory turnover means that KFC is efficient in purchasing and selling its inventory.
Receivables Turnover
2019 2018 2017
0
1
2
3
4
5
6
7
Receivable Turnover
The company reported fluctuations in its receivable’s turnover, with 2018 recording the lowest
value at 3.77, even though it is within acceptable limits. A higher value was achieved in 2017
Inventory Turnover
2019 2018 2017
7.2
7.4
7.6
7.8
8
8.2
8.4
8.6
Inventory Turnover
One can see that KFC has a positive trend in inventory turnover over the 3-year period. A higher
value of inventory turnover means that KFC is efficient in purchasing and selling its inventory.
Receivables Turnover
2019 2018 2017
0
1
2
3
4
5
6
7
Receivable Turnover
The company reported fluctuations in its receivable’s turnover, with 2018 recording the lowest
value at 3.77, even though it is within acceptable limits. A higher value was achieved in 2017
9
and reduced slightly in 2018. This implies that KFC collects its receivables about 5 times a year
or twice in every 110 days.
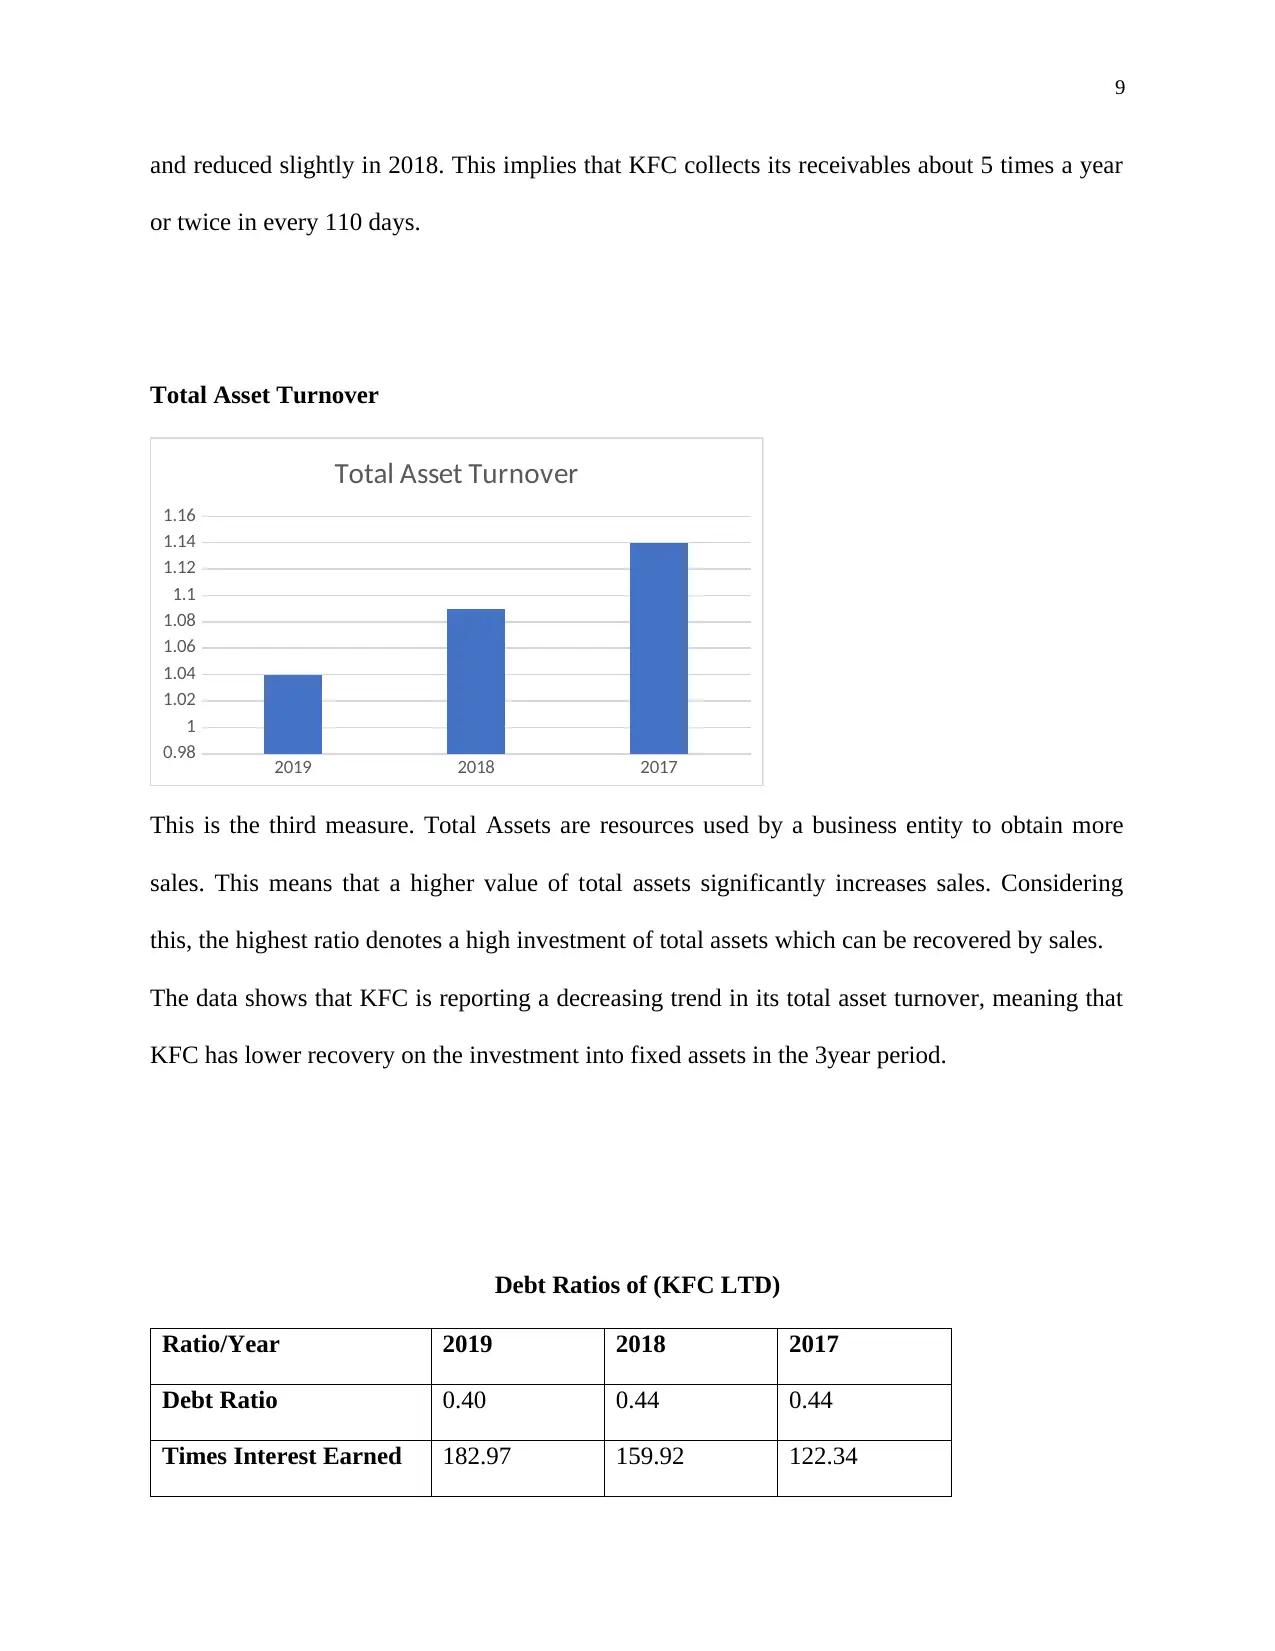
Total Asset Turnover
2019 2018 2017
0.98
1
1.02
1.04
1.06
1.08
1.1
1.12
1.14
1.16
Total Asset Turnover
This is the third measure. Total Assets are resources used by a business entity to obtain more
sales. This means that a higher value of total assets significantly increases sales. Considering
this, the highest ratio denotes a high investment of total assets which can be recovered by sales.
The data shows that KFC is reporting a decreasing trend in its total asset turnover, meaning that
KFC has lower recovery on the investment into fixed assets in the 3year period.
Debt Ratios of (KFC LTD)
Ratio/Year 2019 2018 2017
Debt Ratio 0.40 0.44 0.44
Times Interest Earned 182.97 159.92 122.34
and reduced slightly in 2018. This implies that KFC collects its receivables about 5 times a year
or twice in every 110 days.
Total Asset Turnover
2019 2018 2017
0.98
1
1.02
1.04
1.06
1.08
1.1
1.12
1.14
1.16
Total Asset Turnover
This is the third measure. Total Assets are resources used by a business entity to obtain more
sales. This means that a higher value of total assets significantly increases sales. Considering
this, the highest ratio denotes a high investment of total assets which can be recovered by sales.
The data shows that KFC is reporting a decreasing trend in its total asset turnover, meaning that
KFC has lower recovery on the investment into fixed assets in the 3year period.
Debt Ratios of (KFC LTD)
Ratio/Year 2019 2018 2017
Debt Ratio 0.40 0.44 0.44
Times Interest Earned 182.97 159.92 122.34
⊘ This is a preview!⊘
Do you want full access?
Subscribe today to unlock all pages.
Trusted by 1+ million students worldwide
10
Ratio
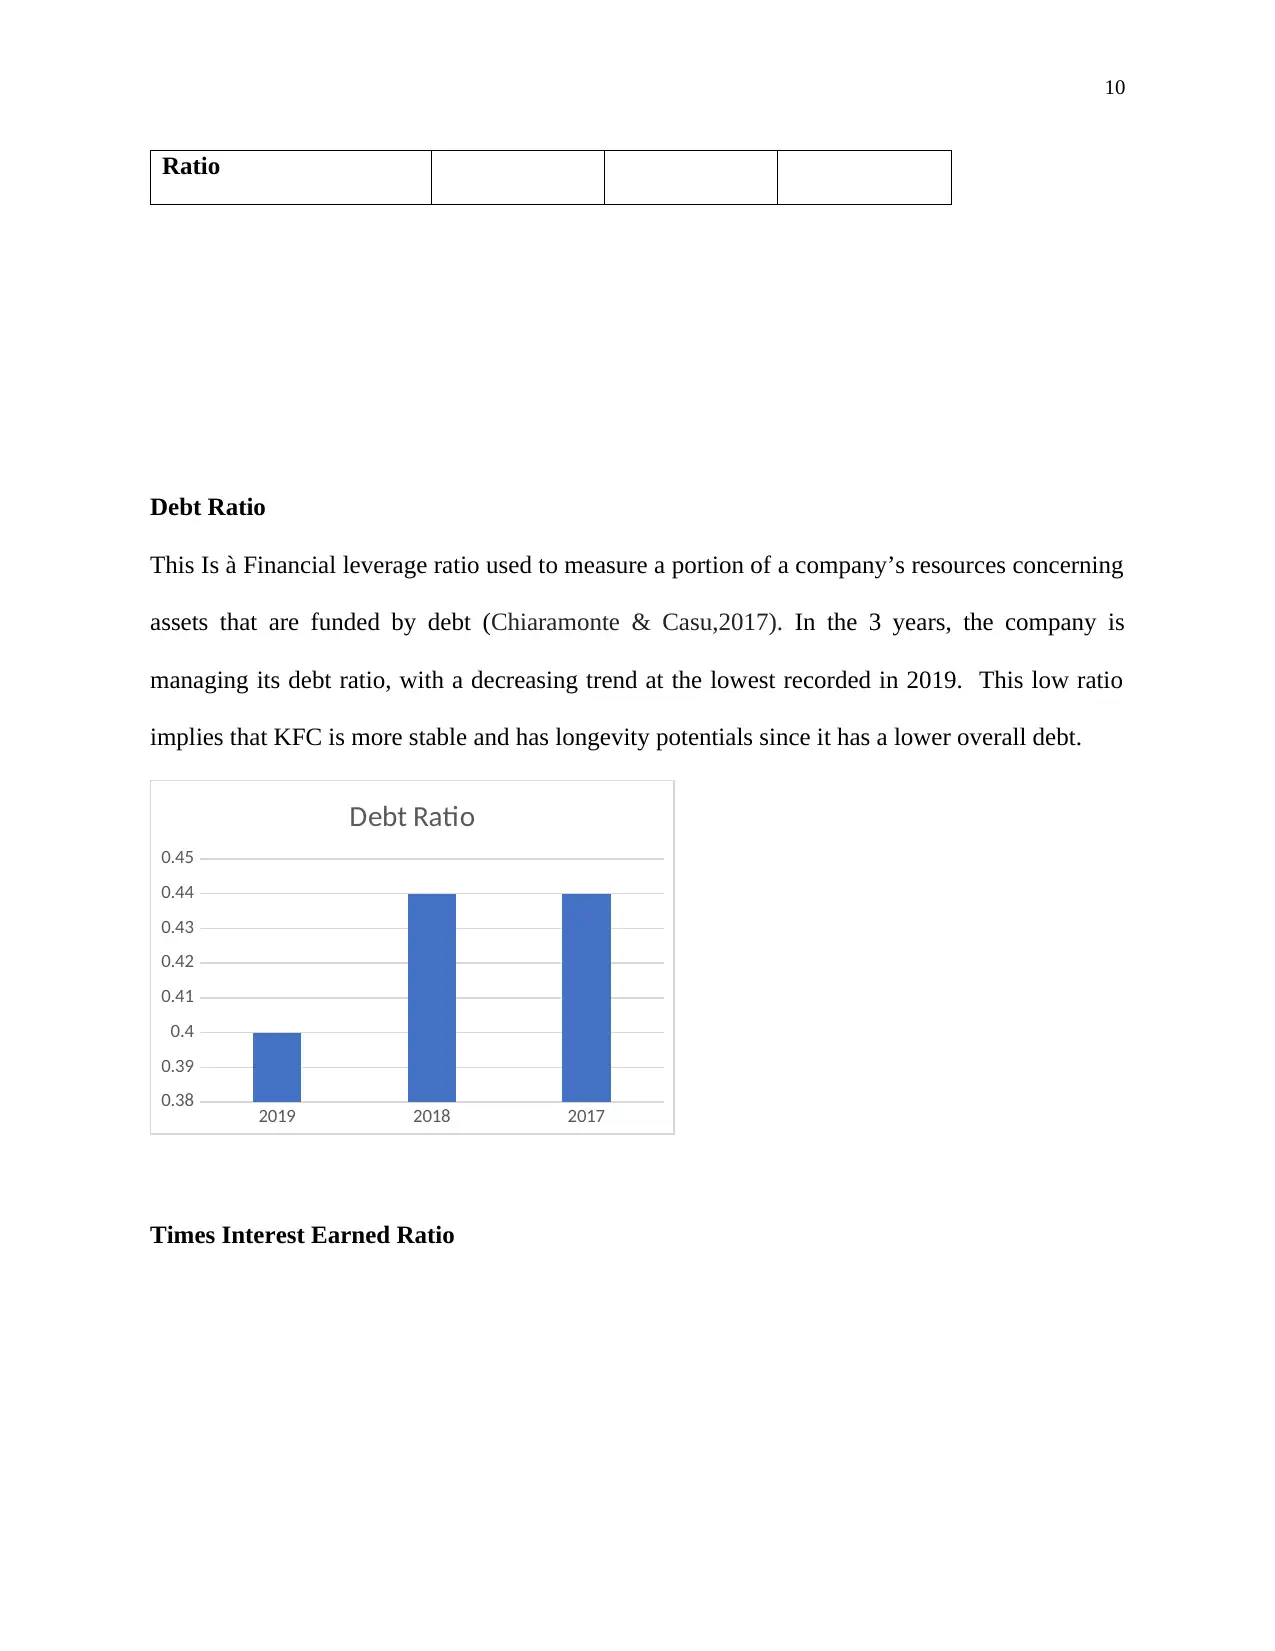
Debt Ratio
This Is à Financial leverage ratio used to measure a portion of a company’s resources concerning
assets that are funded by debt (Chiaramonte & Casu,2017). In the 3 years, the company is
managing its debt ratio, with a decreasing trend at the lowest recorded in 2019. This low ratio
implies that KFC is more stable and has longevity potentials since it has a lower overall debt.
2019 2018 2017
0.38
0.39
0.4
0.41
0.42
0.43
0.44
0.45
Debt Ratio
Times Interest Earned Ratio
Ratio
Debt Ratio
This Is à Financial leverage ratio used to measure a portion of a company’s resources concerning
assets that are funded by debt (Chiaramonte & Casu,2017). In the 3 years, the company is
managing its debt ratio, with a decreasing trend at the lowest recorded in 2019. This low ratio
implies that KFC is more stable and has longevity potentials since it has a lower overall debt.
2019 2018 2017
0.38
0.39
0.4
0.41
0.42
0.43
0.44
0.45
Debt Ratio
Times Interest Earned Ratio
Paraphrase This Document
Need a fresh take? Get an instant paraphrase of this document with our AI Paraphraser
11
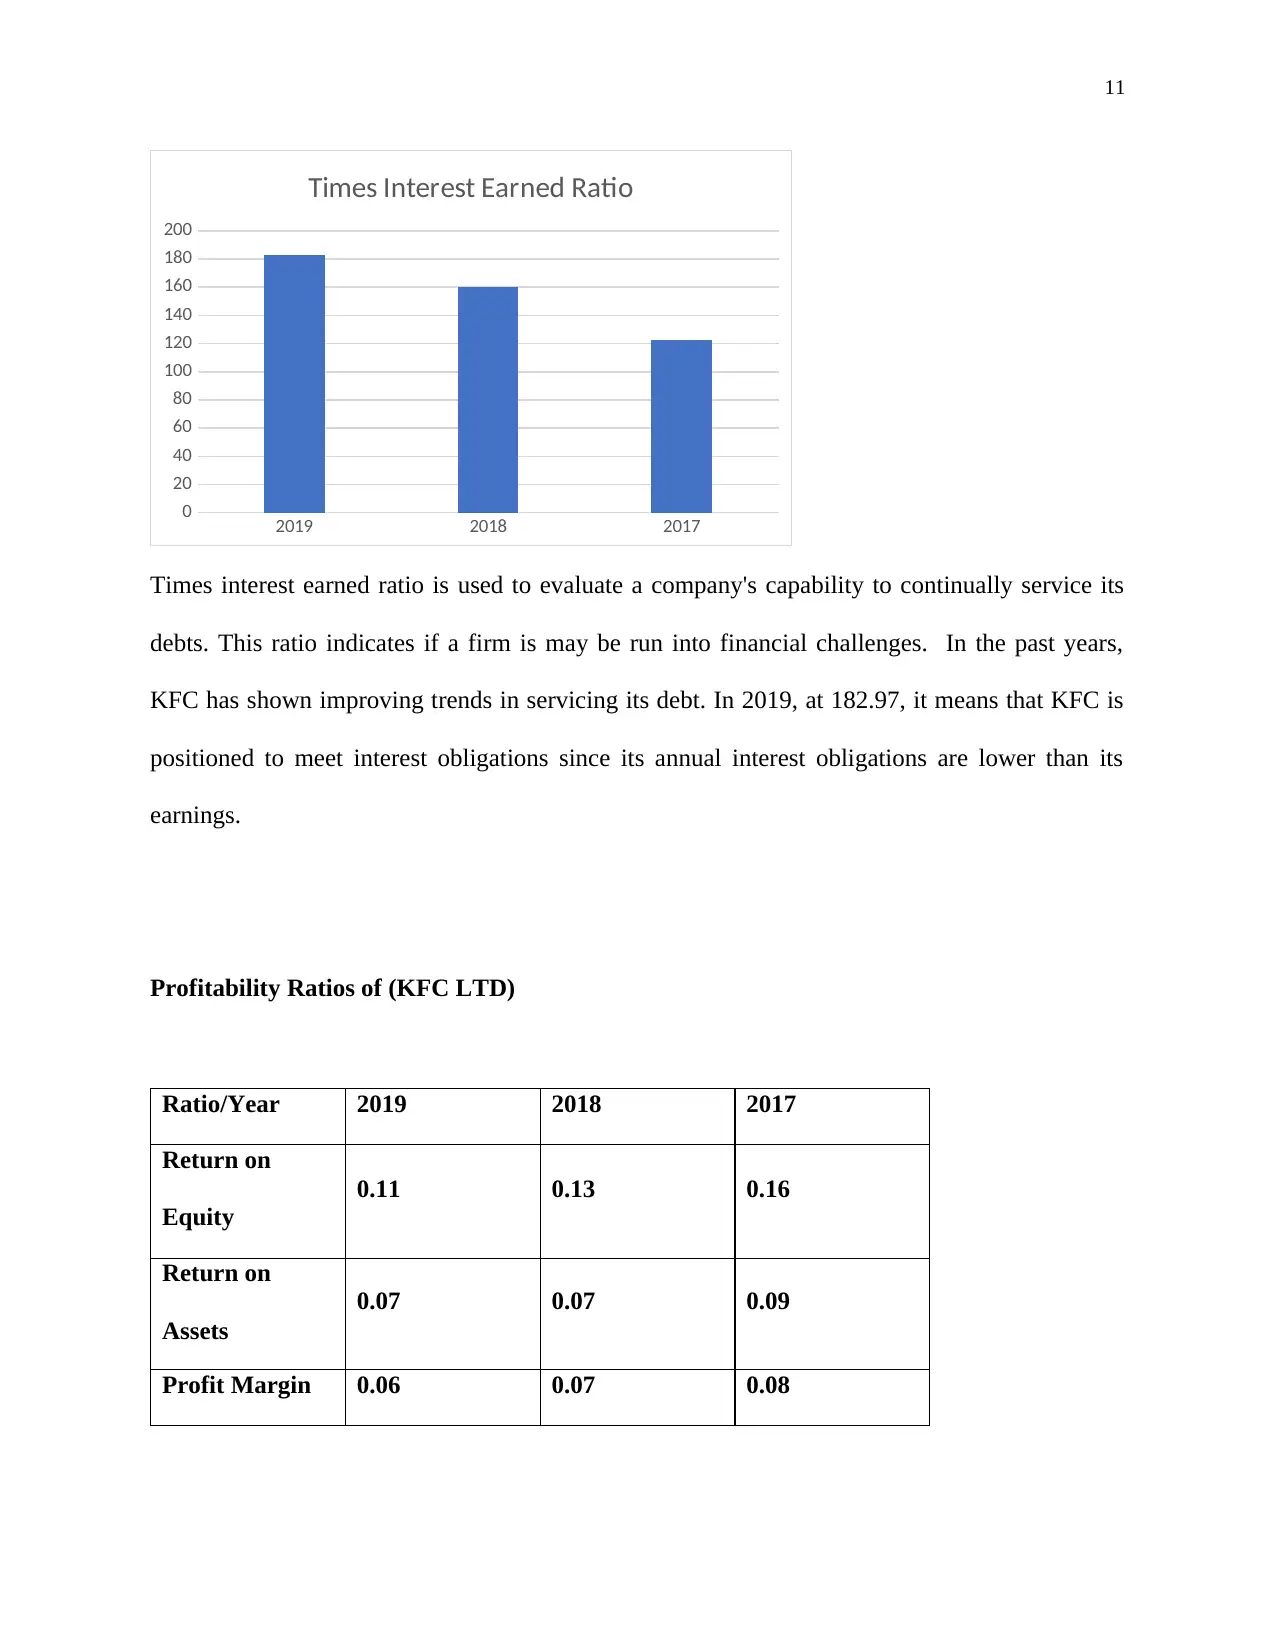
2019 2018 2017
0
20
40
60
80
100
120
140
160
180
200
Times Interest Earned Ratio
Times interest earned ratio is used to evaluate a company's capability to continually service its
debts. This ratio indicates if a firm is may be run into financial challenges. In the past years,
KFC has shown improving trends in servicing its debt. In 2019, at 182.97, it means that KFC is
positioned to meet interest obligations since its annual interest obligations are lower than its
earnings.
Profitability Ratios of (KFC LTD)
Ratio/Year 2019 2018 2017
Return on
Equity
0.11 0.13 0.16
Return on
Assets
0.07 0.07 0.09
Profit Margin 0.06 0.07 0.08
12
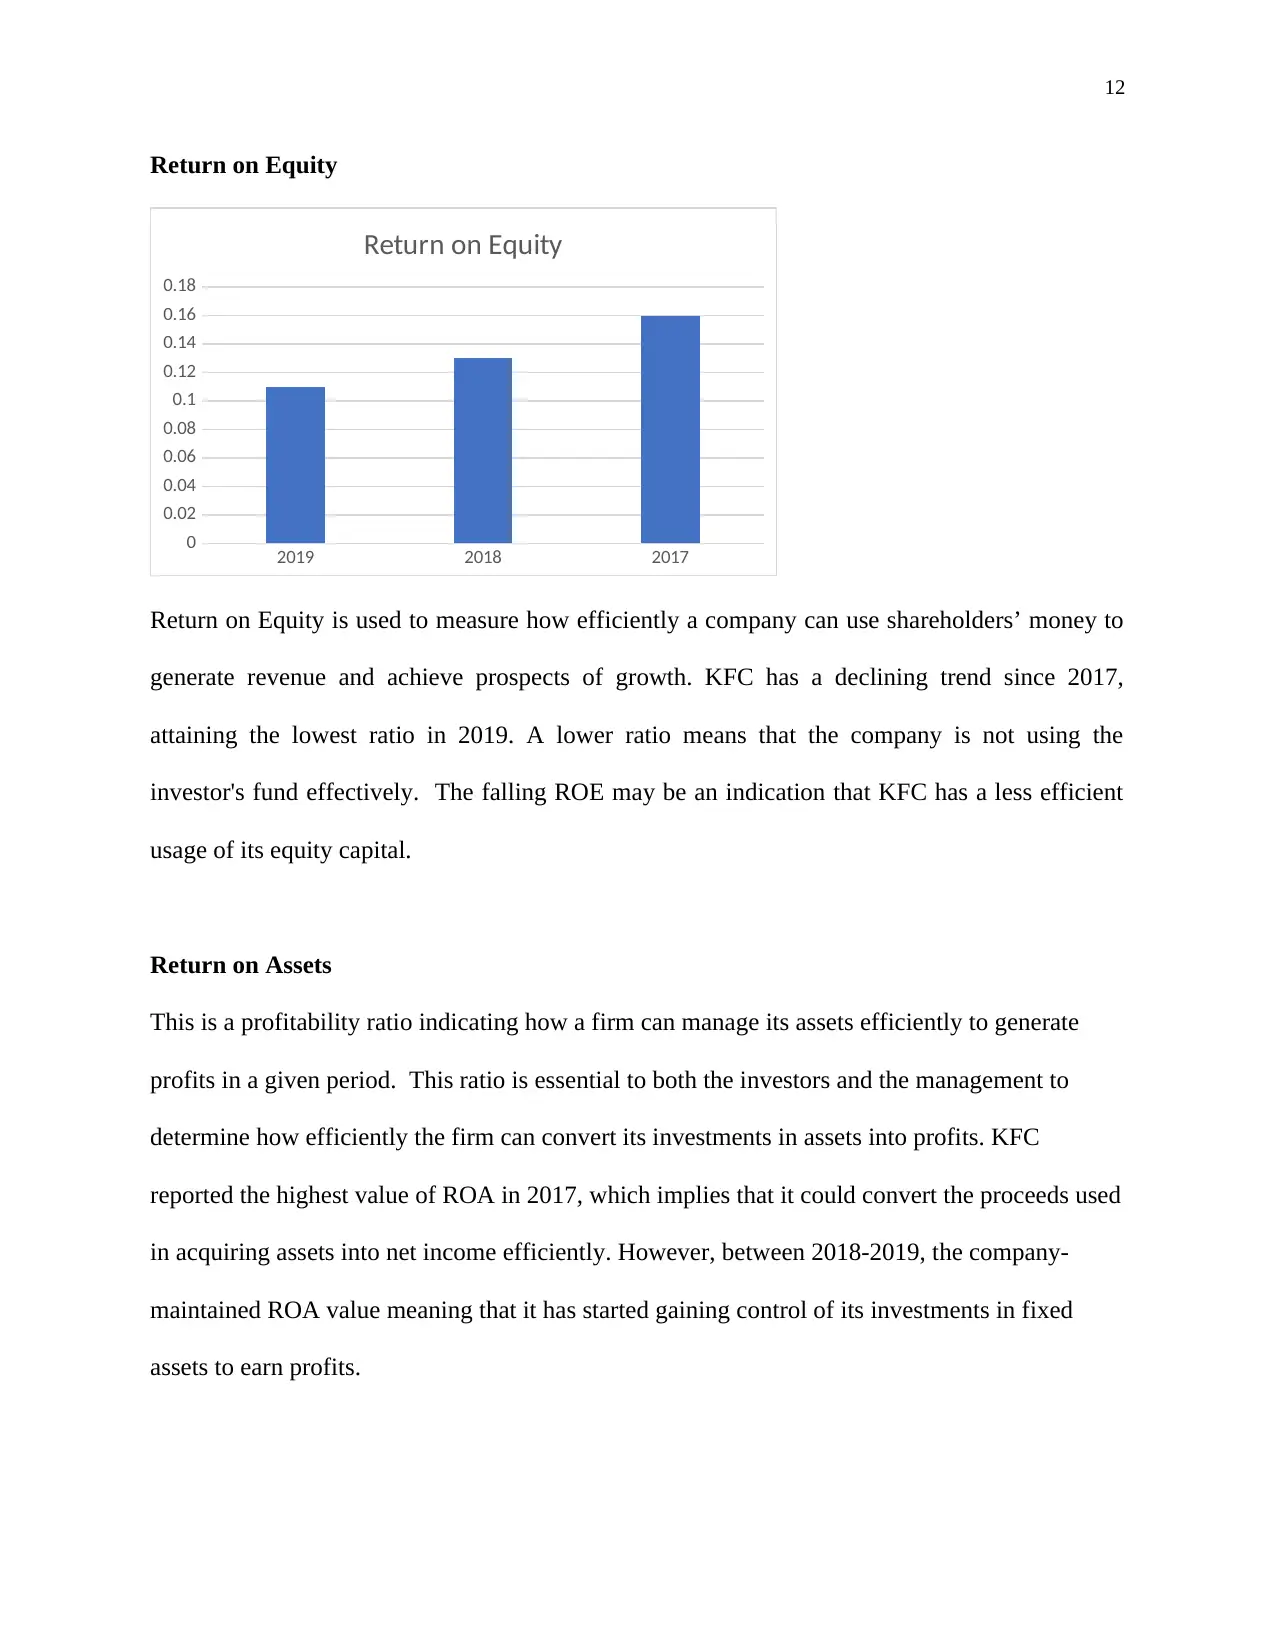
Return on Equity
2019 2018 2017
0
0.02
0.04
0.06
0.08
0.1
0.12
0.14
0.16
0.18
Return on Equity
Return on Equity is used to measure how efficiently a company can use shareholders’ money to
generate revenue and achieve prospects of growth. KFC has a declining trend since 2017,
attaining the lowest ratio in 2019. A lower ratio means that the company is not using the
investor's fund effectively. The falling ROE may be an indication that KFC has a less efficient
usage of its equity capital.
Return on Assets
This is a profitability ratio indicating how a firm can manage its assets efficiently to generate
profits in a given period. This ratio is essential to both the investors and the management to
determine how efficiently the firm can convert its investments in assets into profits. KFC
reported the highest value of ROA in 2017, which implies that it could convert the proceeds used
in acquiring assets into net income efficiently. However, between 2018-2019, the company-
maintained ROA value meaning that it has started gaining control of its investments in fixed
assets to earn profits.
Return on Equity
2019 2018 2017
0
0.02
0.04
0.06
0.08
0.1
0.12
0.14
0.16
0.18
Return on Equity
Return on Equity is used to measure how efficiently a company can use shareholders’ money to
generate revenue and achieve prospects of growth. KFC has a declining trend since 2017,
attaining the lowest ratio in 2019. A lower ratio means that the company is not using the
investor's fund effectively. The falling ROE may be an indication that KFC has a less efficient
usage of its equity capital.
Return on Assets
This is a profitability ratio indicating how a firm can manage its assets efficiently to generate
profits in a given period. This ratio is essential to both the investors and the management to
determine how efficiently the firm can convert its investments in assets into profits. KFC
reported the highest value of ROA in 2017, which implies that it could convert the proceeds used
in acquiring assets into net income efficiently. However, between 2018-2019, the company-
maintained ROA value meaning that it has started gaining control of its investments in fixed
assets to earn profits.
⊘ This is a preview!⊘
Do you want full access?
Subscribe today to unlock all pages.
Trusted by 1+ million students worldwide
1 out of 15
Your All-in-One AI-Powered Toolkit for Academic Success.
+13062052269
info@desklib.com
Available 24*7 on WhatsApp / Email
![[object Object]](/_next/static/media/star-bottom.7253800d.svg)
Unlock your academic potential
Copyright © 2020–2026 A2Z Services. All Rights Reserved. Developed and managed by ZUCOL.