Financial Management Report: Kmart Ltd. and Warehouse NZ Comparison
VerifiedAdded on 2020/04/07
|10
|2172
|40
Report
AI Summary
This report presents a financial analysis of Kmart Ltd. and Warehouse NZ, comparing their performance based on financial ratios from 2014 to 2016. The analysis includes profitability, financial stability, and turnover ratios to assess their financial positions. The report evaluates Kmart's performance, highlighting trends in gross margin, return on assets, and debt-to-equity ratios. It compares Kmart's financial health with that of Warehouse NZ, concluding that while Kmart shows better financial stability, Warehouse NZ demonstrates stronger profitability and turnover. The report also includes pro-forma income statements for 2017 and 2018, and provides recommendations for Kmart to improve its financial performance, and advises Kiwibank Ltd. on the loan extension based on the findings. The data used is sourced from the companies' annual reports.
Running head: FINANCIAL MANAGEMENT
Financial management
Name of the student
Name of the university
Author note
Financial management
Name of the student
Name of the university
Author note
Paraphrase This Document
Need a fresh take? Get an instant paraphrase of this document with our AI Paraphraser
1FINANCIAL MANAGEMENT
Table of Contents
Executive summary....................................................................................................................2
Introduction................................................................................................................................3
Findings......................................................................................................................................3
Section 1.................................................................................................................................3
Section 2.................................................................................................................................4
Analysis and interpretation........................................................................................................5
Section 1.................................................................................................................................5
Section 2.................................................................................................................................6
Section 3.................................................................................................................................7
Conclusion..................................................................................................................................8
Recommendation........................................................................................................................8
Reference & Bibliography.........................................................................................................9
2FINANCIAL MANAGEMENT
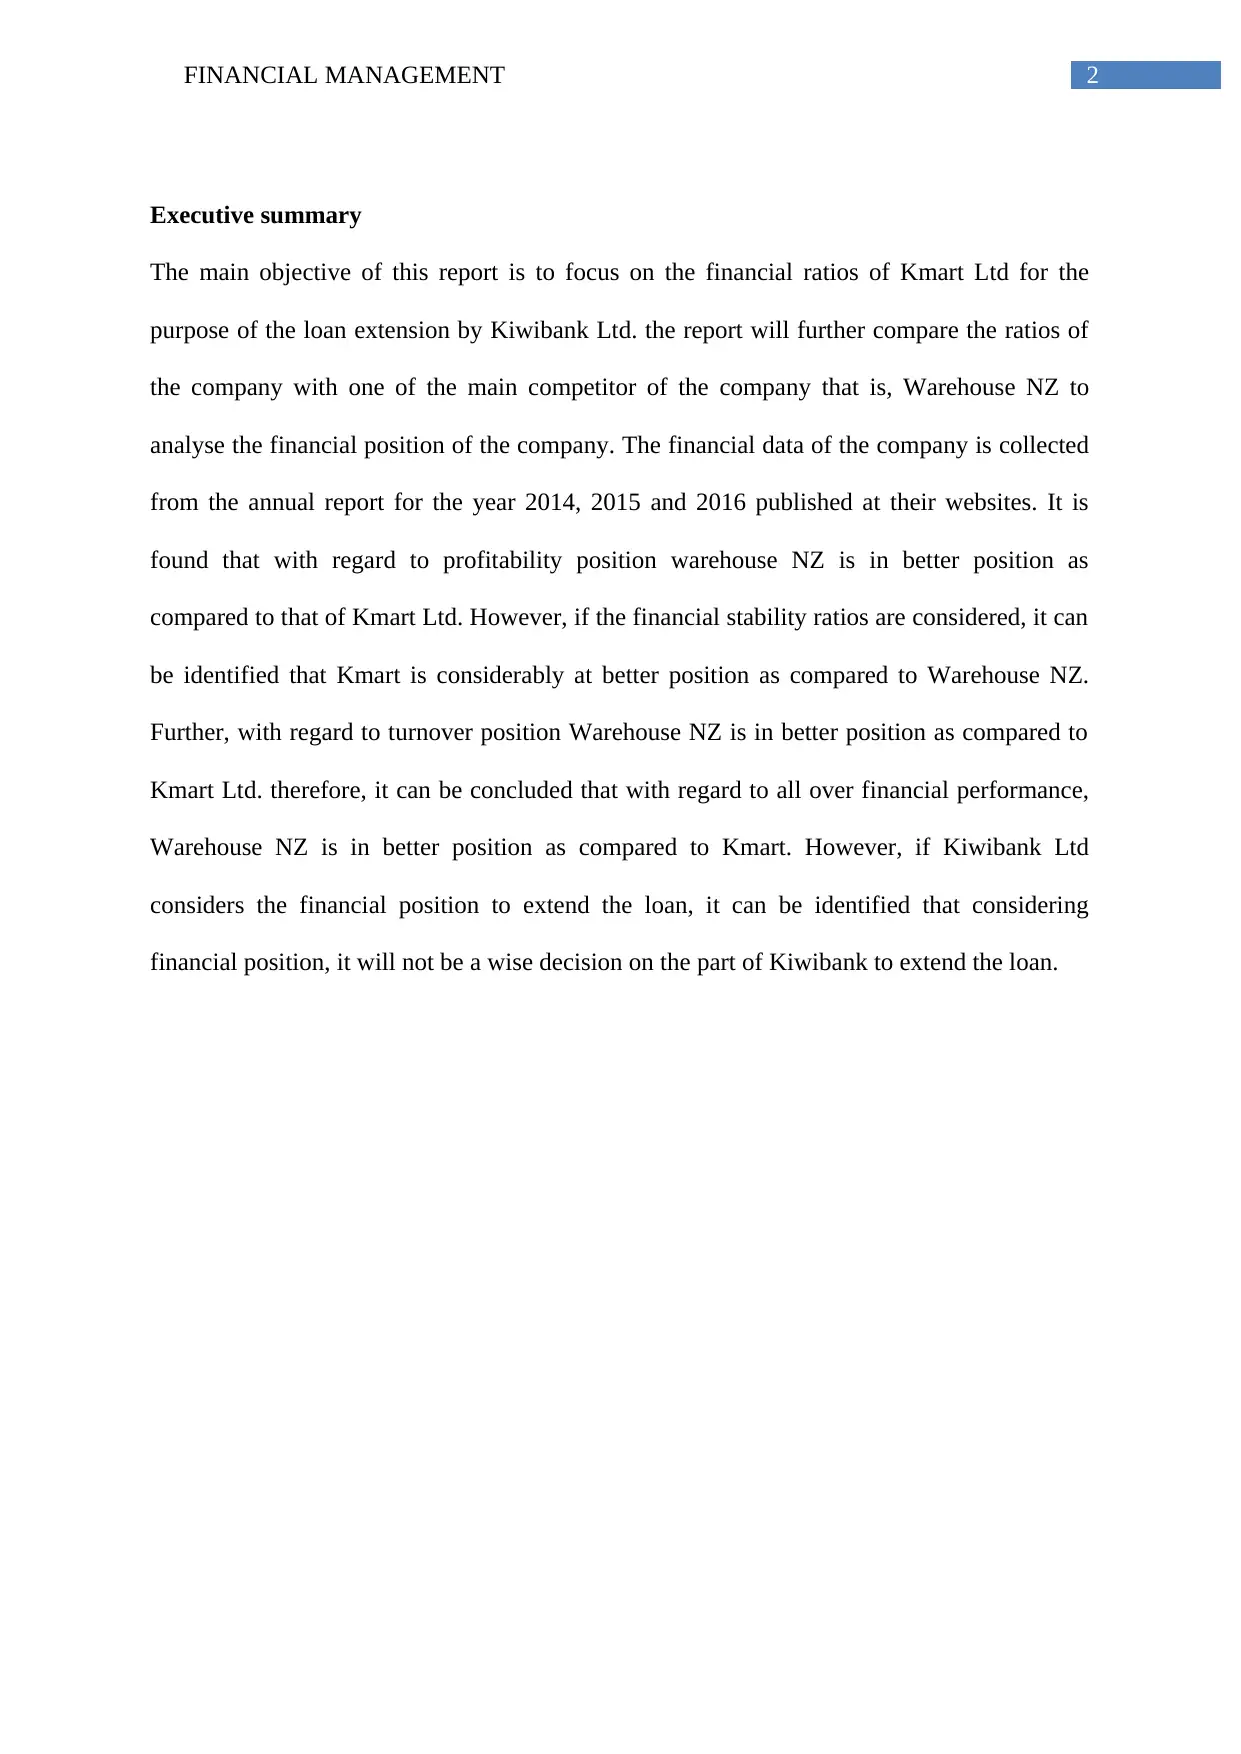
Executive summary
The main objective of this report is to focus on the financial ratios of Kmart Ltd for the
purpose of the loan extension by Kiwibank Ltd. the report will further compare the ratios of
the company with one of the main competitor of the company that is, Warehouse NZ to
analyse the financial position of the company. The financial data of the company is collected
from the annual report for the year 2014, 2015 and 2016 published at their websites. It is
found that with regard to profitability position warehouse NZ is in better position as
compared to that of Kmart Ltd. However, if the financial stability ratios are considered, it can
be identified that Kmart is considerably at better position as compared to Warehouse NZ.
Further, with regard to turnover position Warehouse NZ is in better position as compared to
Kmart Ltd. therefore, it can be concluded that with regard to all over financial performance,
Warehouse NZ is in better position as compared to Kmart. However, if Kiwibank Ltd
considers the financial position to extend the loan, it can be identified that considering
financial position, it will not be a wise decision on the part of Kiwibank to extend the loan.
⊘ This is a preview!⊘
Do you want full access?
Subscribe today to unlock all pages.
Trusted by 1+ million students worldwide
3FINANCIAL MANAGEMENT
Introduction
Kmart is the 1st store under discount department in New Zealand. Though the
customers knew very little about Kmart then, it became the new era in New Zealand
thereafter. They provide their product to the customers at exceptionally low prices through
various stores all over New Zealand. The company works hard to assure the customers that
they get the daily required products at lowest possible prices. The company is further
committed to improve the customer’s lives through delivering quality products and services
that will enable to build the customer’s trust and a lifetime relationship with them. Various
key factors of their strategies are to reinvent the brand trough innovation and technology and
attaining the best in class efficiency and productivity (Kmart.co.nz, 2017).
On the other hand, established in 1982, Warehouse NZ is counted among the leading
retailers in New Zealand. They believe that the healthy business requires a healthy society in
the same way as the healthy society requires the healthy business. The company is strongly
focussed on the communities they are operating, the team members and the customers and are
committed towards a more sustainable business that can minimize wastes, operates ethically
and conserves energy (The Warehouse | Fashion, Homewares, Toys & much more, 2017).
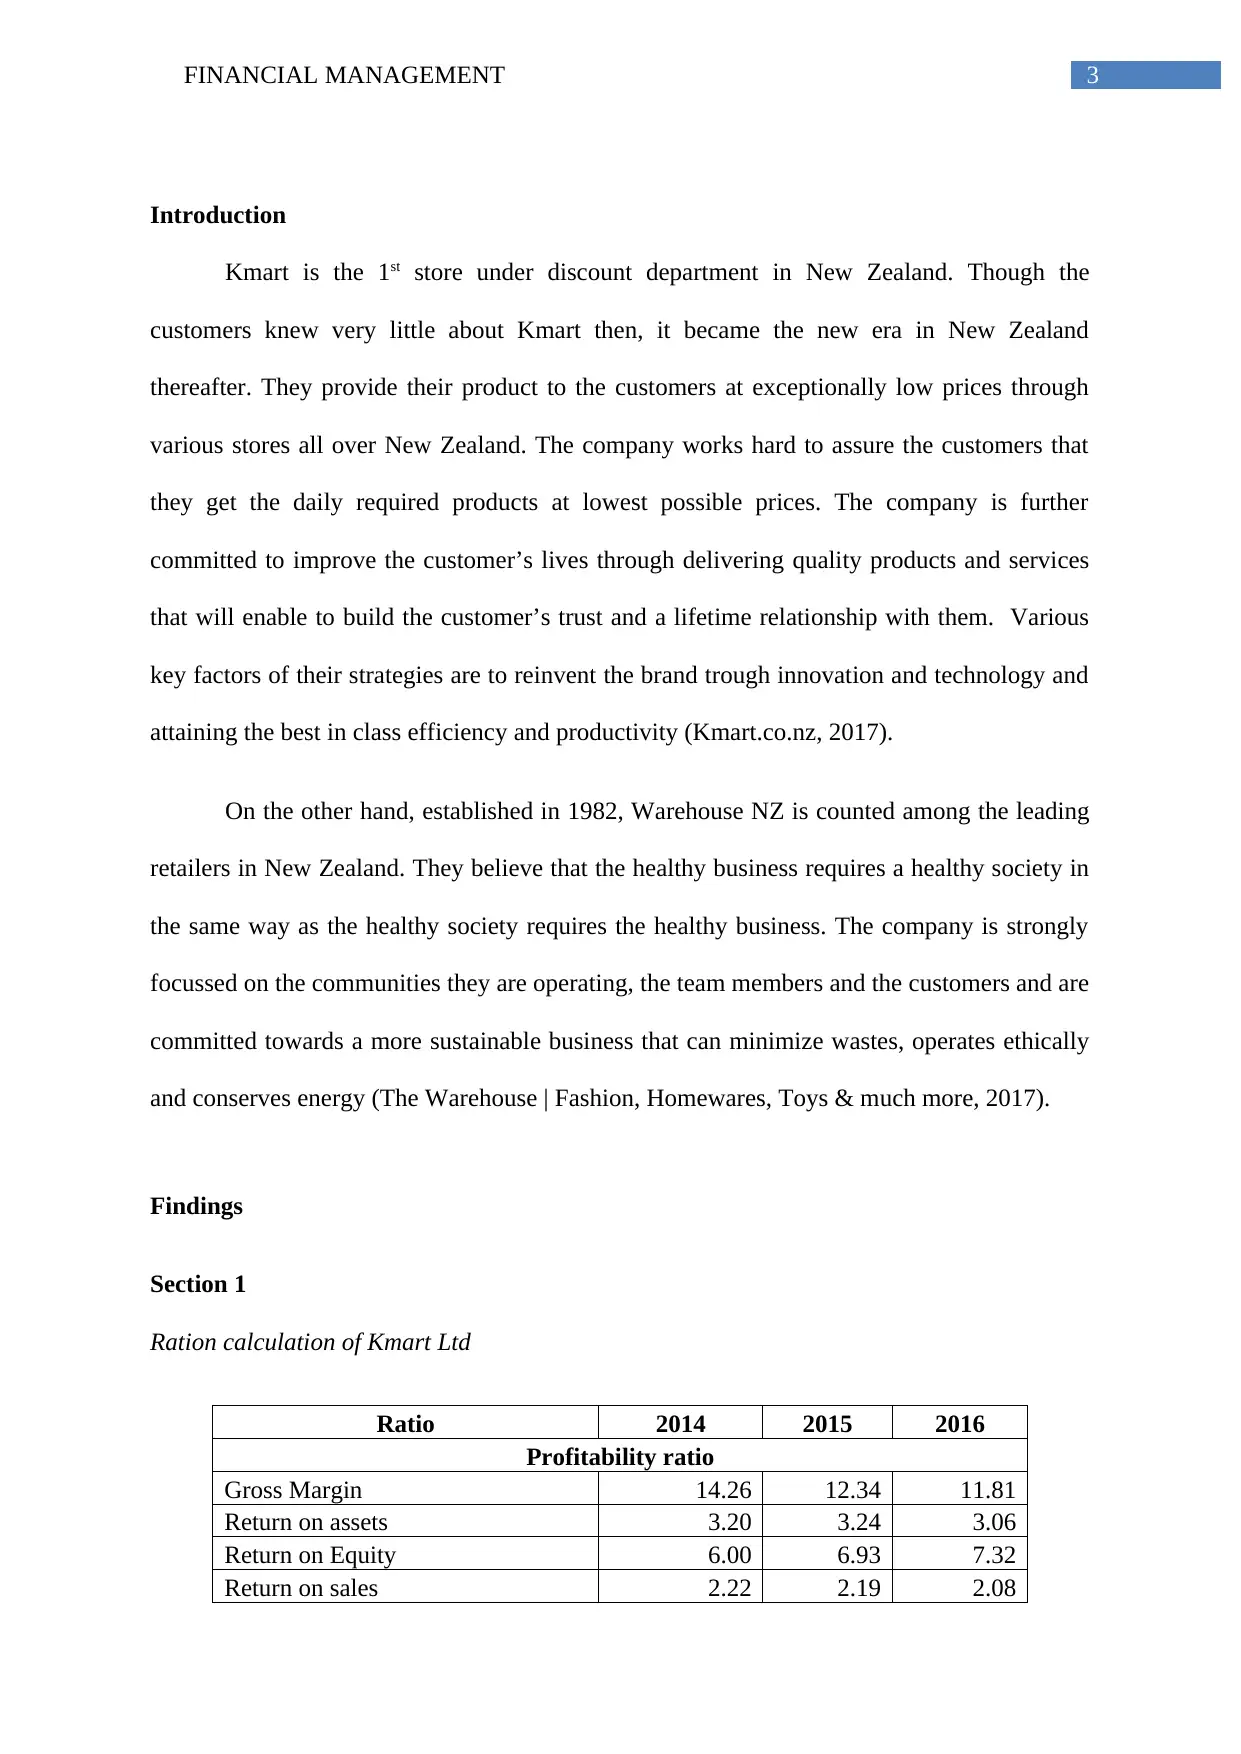
Findings
Section 1
Ration calculation of Kmart Ltd
Ratio 2014 2015 2016
Profitability ratio
Gross Margin 14.26 12.34 11.81
Return on assets 3.20 3.24 3.06
Return on Equity 6.00 6.93 7.32
Return on sales 2.22 2.19 2.08
Introduction
Kmart is the 1st store under discount department in New Zealand. Though the
customers knew very little about Kmart then, it became the new era in New Zealand
thereafter. They provide their product to the customers at exceptionally low prices through
various stores all over New Zealand. The company works hard to assure the customers that
they get the daily required products at lowest possible prices. The company is further
committed to improve the customer’s lives through delivering quality products and services
that will enable to build the customer’s trust and a lifetime relationship with them. Various
key factors of their strategies are to reinvent the brand trough innovation and technology and
attaining the best in class efficiency and productivity (Kmart.co.nz, 2017).
On the other hand, established in 1982, Warehouse NZ is counted among the leading
retailers in New Zealand. They believe that the healthy business requires a healthy society in
the same way as the healthy society requires the healthy business. The company is strongly
focussed on the communities they are operating, the team members and the customers and are
committed towards a more sustainable business that can minimize wastes, operates ethically
and conserves energy (The Warehouse | Fashion, Homewares, Toys & much more, 2017).
Findings
Section 1
Ration calculation of Kmart Ltd
Ratio 2014 2015 2016
Profitability ratio
Gross Margin 14.26 12.34 11.81
Return on assets 3.20 3.24 3.06
Return on Equity 6.00 6.93 7.32
Return on sales 2.22 2.19 2.08
Paraphrase This Document
Need a fresh take? Get an instant paraphrase of this document with our AI Paraphraser
4FINANCIAL MANAGEMENT
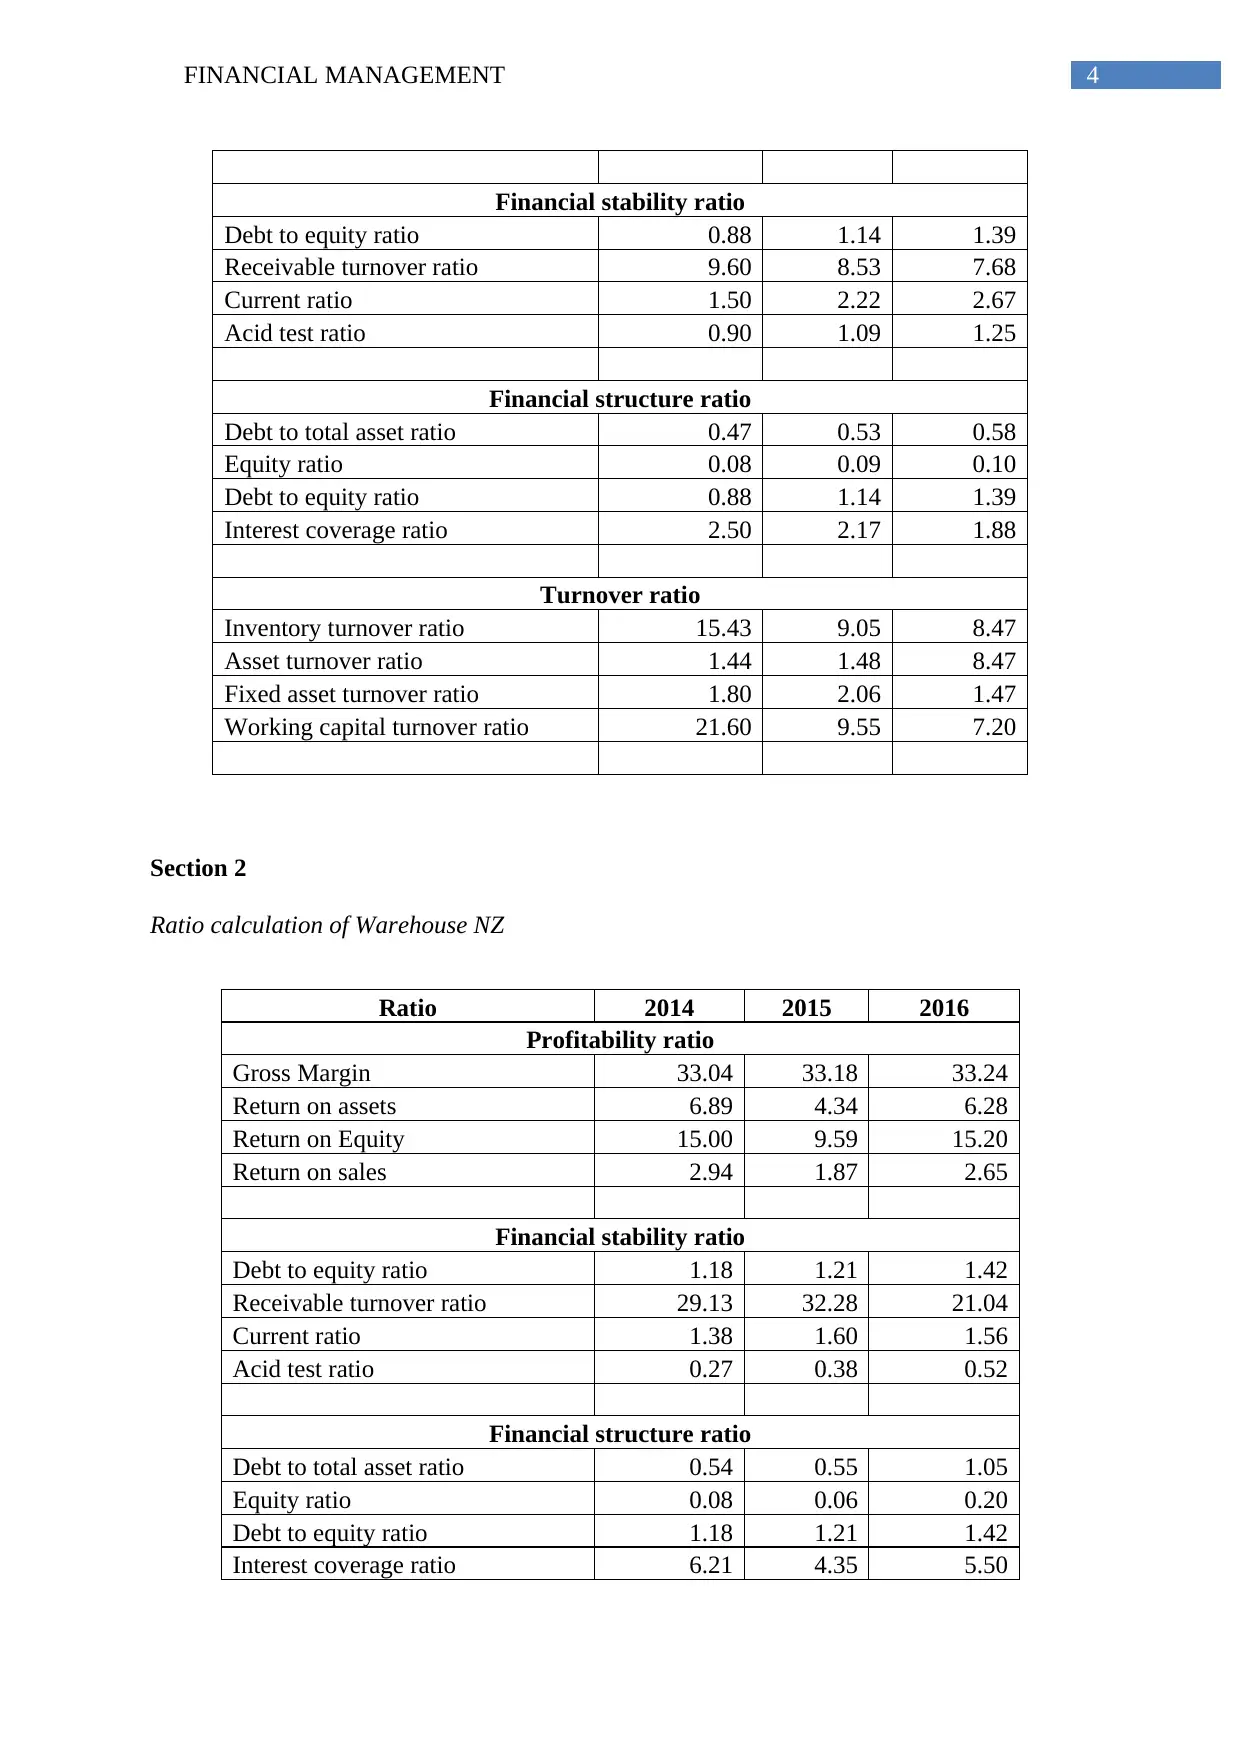
Financial stability ratio
Debt to equity ratio 0.88 1.14 1.39
Receivable turnover ratio 9.60 8.53 7.68
Current ratio 1.50 2.22 2.67
Acid test ratio 0.90 1.09 1.25
Financial structure ratio
Debt to total asset ratio 0.47 0.53 0.58
Equity ratio 0.08 0.09 0.10
Debt to equity ratio 0.88 1.14 1.39
Interest coverage ratio 2.50 2.17 1.88
Turnover ratio
Inventory turnover ratio 15.43 9.05 8.47
Asset turnover ratio 1.44 1.48 8.47
Fixed asset turnover ratio 1.80 2.06 1.47
Working capital turnover ratio 21.60 9.55 7.20
Section 2
Ratio calculation of Warehouse NZ
Ratio 2014 2015 2016
Profitability ratio
Gross Margin 33.04 33.18 33.24
Return on assets 6.89 4.34 6.28
Return on Equity 15.00 9.59 15.20
Return on sales 2.94 1.87 2.65
Financial stability ratio
Debt to equity ratio 1.18 1.21 1.42
Receivable turnover ratio 29.13 32.28 21.04
Current ratio 1.38 1.60 1.56
Acid test ratio 0.27 0.38 0.52
Financial structure ratio
Debt to total asset ratio 0.54 0.55 1.05
Equity ratio 0.08 0.06 0.20
Debt to equity ratio 1.18 1.21 1.42
Interest coverage ratio 6.21 4.35 5.50
Financial stability ratio
Debt to equity ratio 0.88 1.14 1.39
Receivable turnover ratio 9.60 8.53 7.68
Current ratio 1.50 2.22 2.67
Acid test ratio 0.90 1.09 1.25
Financial structure ratio
Debt to total asset ratio 0.47 0.53 0.58
Equity ratio 0.08 0.09 0.10
Debt to equity ratio 0.88 1.14 1.39
Interest coverage ratio 2.50 2.17 1.88
Turnover ratio
Inventory turnover ratio 15.43 9.05 8.47
Asset turnover ratio 1.44 1.48 8.47
Fixed asset turnover ratio 1.80 2.06 1.47
Working capital turnover ratio 21.60 9.55 7.20
Section 2
Ratio calculation of Warehouse NZ
Ratio 2014 2015 2016
Profitability ratio
Gross Margin 33.04 33.18 33.24
Return on assets 6.89 4.34 6.28
Return on Equity 15.00 9.59 15.20
Return on sales 2.94 1.87 2.65
Financial stability ratio
Debt to equity ratio 1.18 1.21 1.42
Receivable turnover ratio 29.13 32.28 21.04
Current ratio 1.38 1.60 1.56
Acid test ratio 0.27 0.38 0.52
Financial structure ratio
Debt to total asset ratio 0.54 0.55 1.05
Equity ratio 0.08 0.06 0.20
Debt to equity ratio 1.18 1.21 1.42
Interest coverage ratio 6.21 4.35 5.50
5FINANCIAL MANAGEMENT
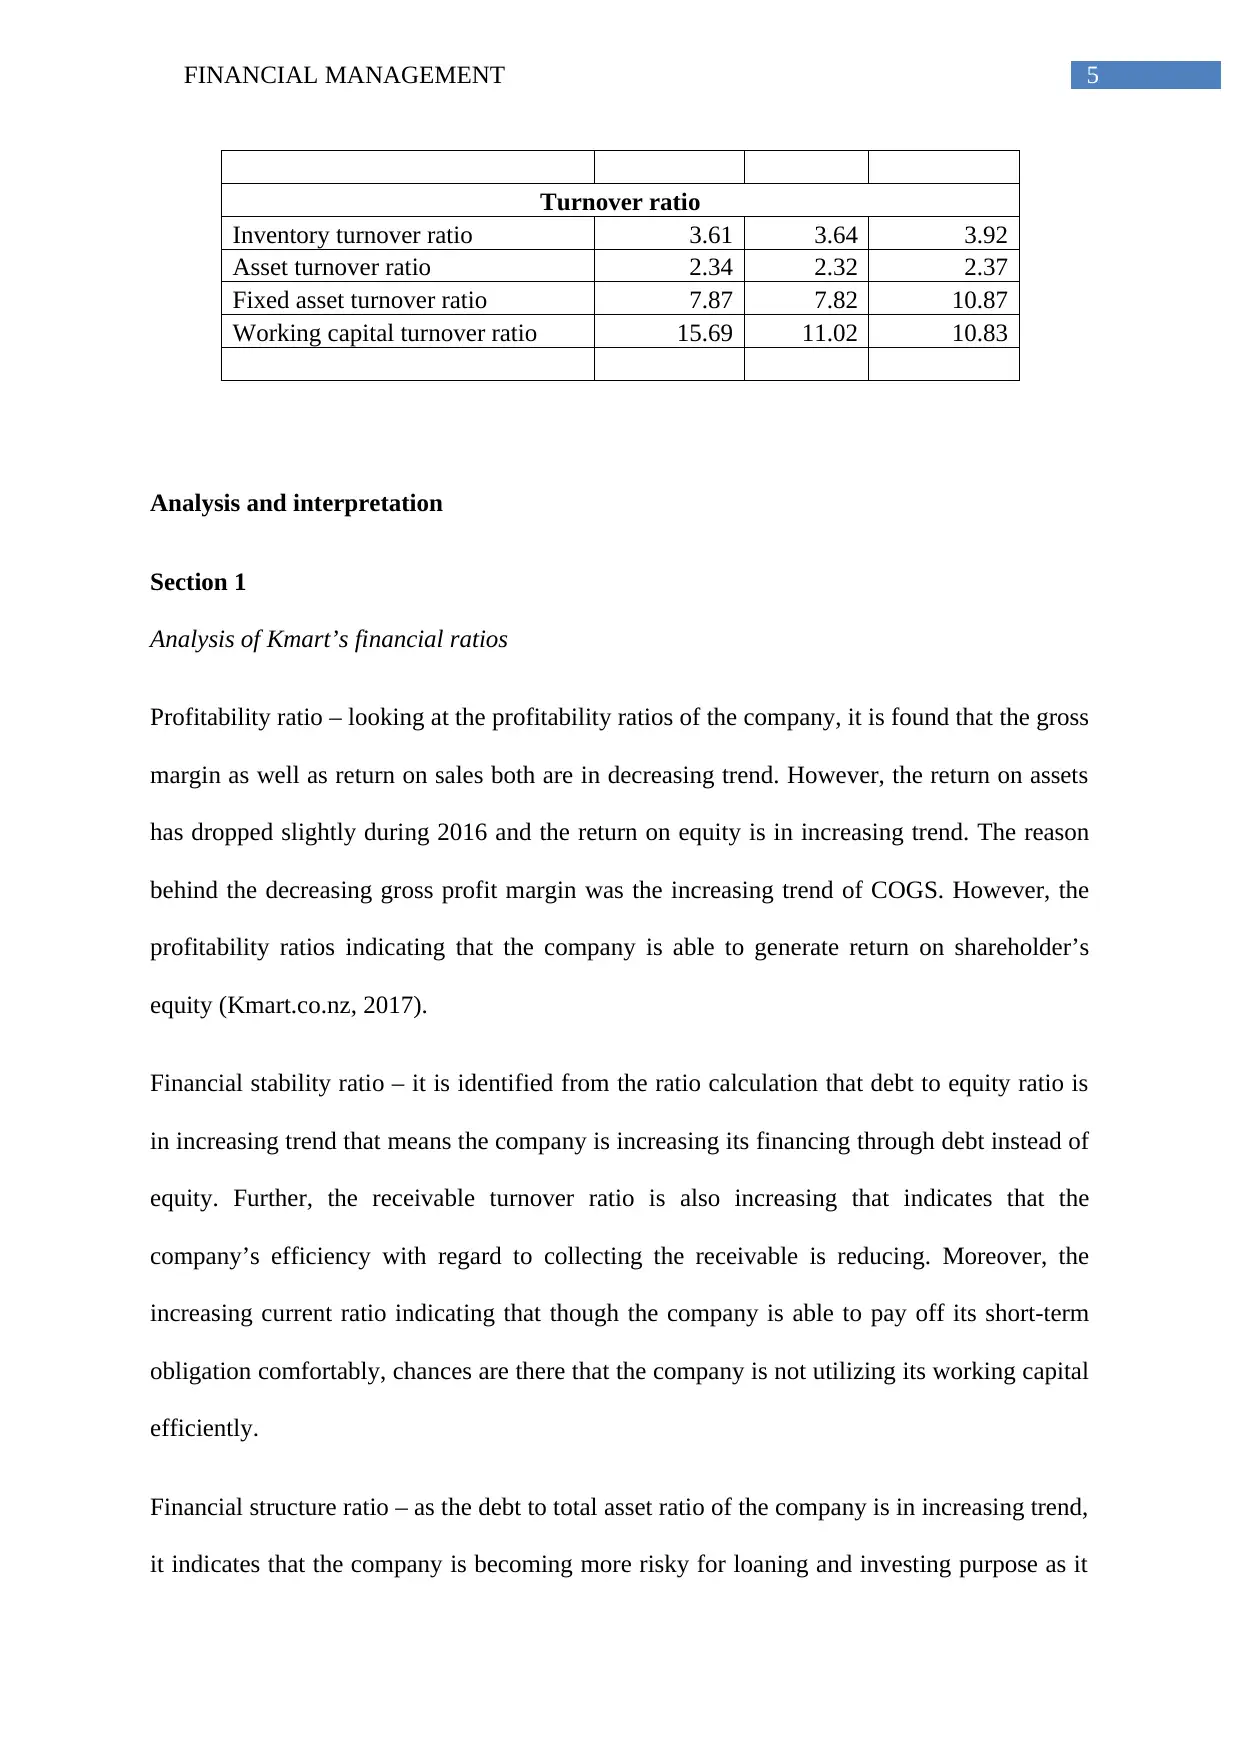
Turnover ratio
Inventory turnover ratio 3.61 3.64 3.92
Asset turnover ratio 2.34 2.32 2.37
Fixed asset turnover ratio 7.87 7.82 10.87
Working capital turnover ratio 15.69 11.02 10.83
Analysis and interpretation
Section 1
Analysis of Kmart’s financial ratios
Profitability ratio – looking at the profitability ratios of the company, it is found that the gross
margin as well as return on sales both are in decreasing trend. However, the return on assets
has dropped slightly during 2016 and the return on equity is in increasing trend. The reason
behind the decreasing gross profit margin was the increasing trend of COGS. However, the
profitability ratios indicating that the company is able to generate return on shareholder’s
equity (Kmart.co.nz, 2017).
Financial stability ratio – it is identified from the ratio calculation that debt to equity ratio is
in increasing trend that means the company is increasing its financing through debt instead of
equity. Further, the receivable turnover ratio is also increasing that indicates that the
company’s efficiency with regard to collecting the receivable is reducing. Moreover, the
increasing current ratio indicating that though the company is able to pay off its short-term
obligation comfortably, chances are there that the company is not utilizing its working capital
efficiently.
Financial structure ratio – as the debt to total asset ratio of the company is in increasing trend,
it indicates that the company is becoming more risky for loaning and investing purpose as it
⊘ This is a preview!⊘
Do you want full access?
Subscribe today to unlock all pages.
Trusted by 1+ million students worldwide
6FINANCIAL MANAGEMENT
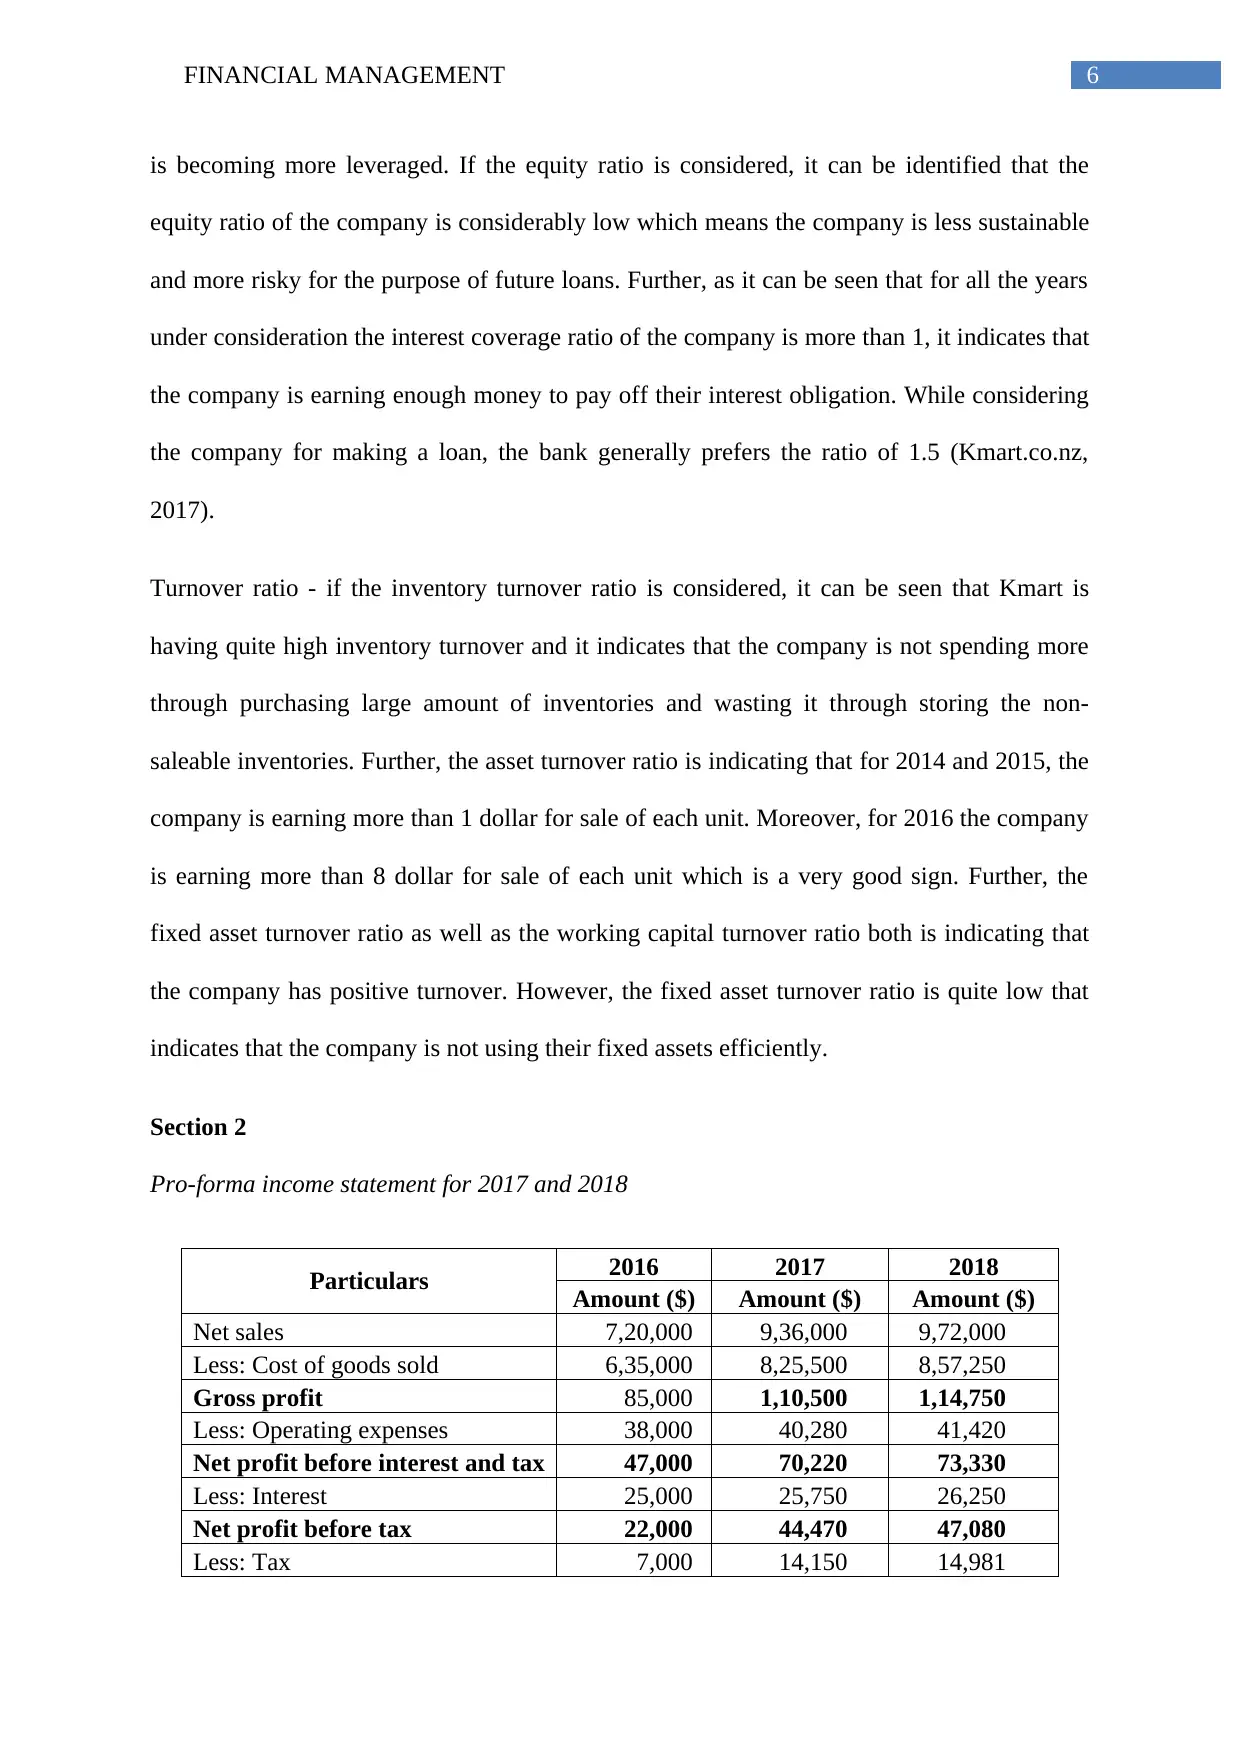
is becoming more leveraged. If the equity ratio is considered, it can be identified that the
equity ratio of the company is considerably low which means the company is less sustainable
and more risky for the purpose of future loans. Further, as it can be seen that for all the years
under consideration the interest coverage ratio of the company is more than 1, it indicates that
the company is earning enough money to pay off their interest obligation. While considering
the company for making a loan, the bank generally prefers the ratio of 1.5 (Kmart.co.nz,
2017).
Turnover ratio - if the inventory turnover ratio is considered, it can be seen that Kmart is
having quite high inventory turnover and it indicates that the company is not spending more
through purchasing large amount of inventories and wasting it through storing the non-
saleable inventories. Further, the asset turnover ratio is indicating that for 2014 and 2015, the
company is earning more than 1 dollar for sale of each unit. Moreover, for 2016 the company
is earning more than 8 dollar for sale of each unit which is a very good sign. Further, the
fixed asset turnover ratio as well as the working capital turnover ratio both is indicating that
the company has positive turnover. However, the fixed asset turnover ratio is quite low that
indicates that the company is not using their fixed assets efficiently.
Section 2
Pro-forma income statement for 2017 and 2018
Particulars 2016 2017 2018
Amount ($) Amount ($) Amount ($)
Net sales 7,20,000 9,36,000 9,72,000
Less: Cost of goods sold 6,35,000 8,25,500 8,57,250
Gross profit 85,000 1,10,500 1,14,750
Less: Operating expenses 38,000 40,280 41,420
Net profit before interest and tax 47,000 70,220 73,330
Less: Interest 25,000 25,750 26,250
Net profit before tax 22,000 44,470 47,080
Less: Tax 7,000 14,150 14,981
Paraphrase This Document
Need a fresh take? Get an instant paraphrase of this document with our AI Paraphraser
7FINANCIAL MANAGEMENT
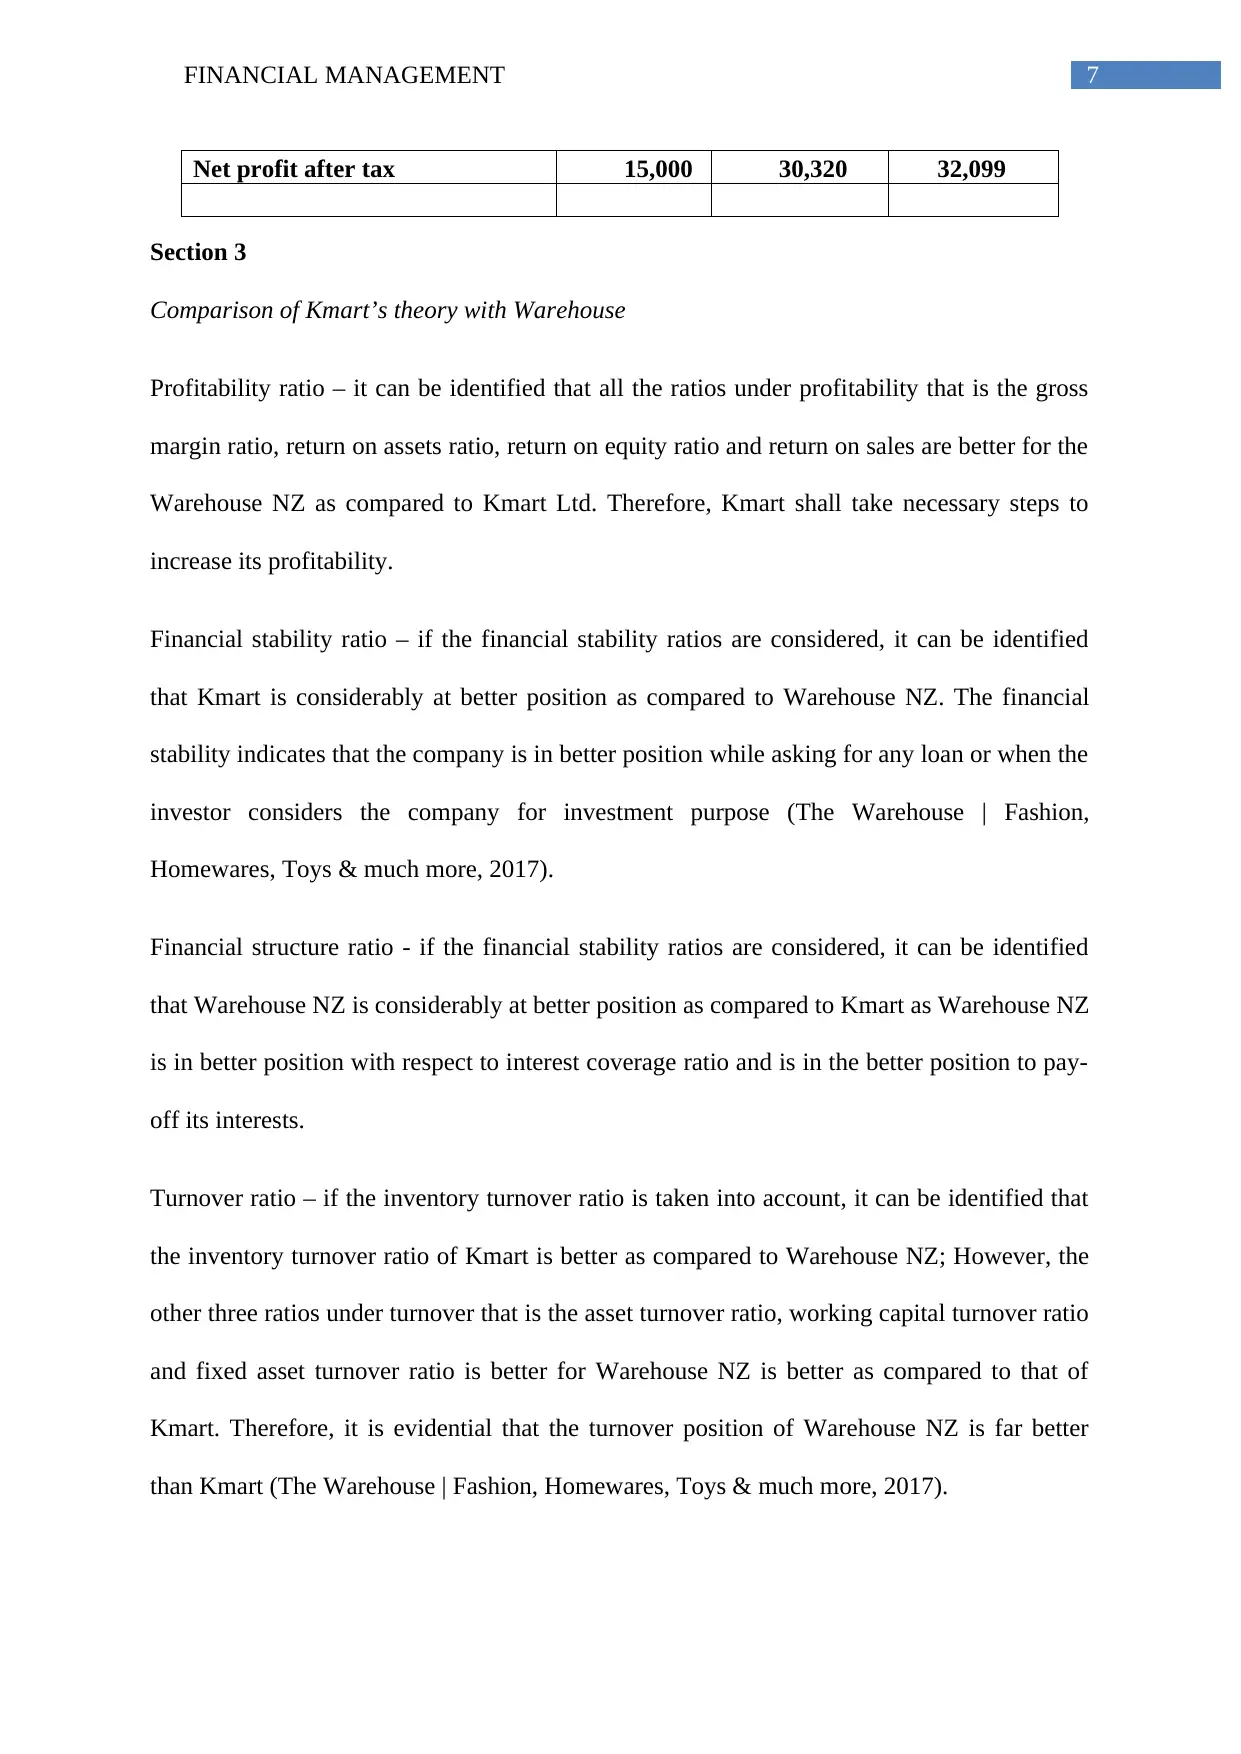
Net profit after tax 15,000 30,320 32,099
Section 3
Comparison of Kmart’s theory with Warehouse
Profitability ratio – it can be identified that all the ratios under profitability that is the gross
margin ratio, return on assets ratio, return on equity ratio and return on sales are better for the
Warehouse NZ as compared to Kmart Ltd. Therefore, Kmart shall take necessary steps to
increase its profitability.
Financial stability ratio – if the financial stability ratios are considered, it can be identified
that Kmart is considerably at better position as compared to Warehouse NZ. The financial
stability indicates that the company is in better position while asking for any loan or when the
investor considers the company for investment purpose (The Warehouse | Fashion,
Homewares, Toys & much more, 2017).
Financial structure ratio - if the financial stability ratios are considered, it can be identified
that Warehouse NZ is considerably at better position as compared to Kmart as Warehouse NZ
is in better position with respect to interest coverage ratio and is in the better position to pay-
off its interests.
Turnover ratio – if the inventory turnover ratio is taken into account, it can be identified that
the inventory turnover ratio of Kmart is better as compared to Warehouse NZ; However, the
other three ratios under turnover that is the asset turnover ratio, working capital turnover ratio
and fixed asset turnover ratio is better for Warehouse NZ is better as compared to that of
Kmart. Therefore, it is evidential that the turnover position of Warehouse NZ is far better
than Kmart (The Warehouse | Fashion, Homewares, Toys & much more, 2017).
8FINANCIAL MANAGEMENT
Conclusion
From the above analysis and interpretation of Kmart Ltd. as well as Warehouse NZ, it
is found that both the companies are among the leading retailers in New Zealand and hold a
large amount of market share. However, from the financial analysis of both the companies it
is found that with regard to profitability position warehouse NZ is in better position as
compared to that of Kmart Ltd. However, if the financial stability ratios are considered, it can
be identified that Kmart is considerably at better position as compared to Warehouse NZ.
Further, Warehouse NZ is in better position to pay off their interest. Further, with regard to
turnover position Warehouse NZ is in better position as compared to Kmart Ltd. therefore, it
can be concluded that with regard to all over financial performance, Warehouse NZ is in
better position as compared to Kmart.
Recommendation
It can be recommended that Kmart shall try to reduce their operating expenses as well
as COGS to improve its profitability position. Further, the company shall take necessary steps
to increase its sales, so that it can achieve better turnover position. However, if Kiwibank Ltd
considers the financial position to extend the loan, it can be identified that considering
financial position, as the debt to total asset ratio of the company is in increasing trend, it
indicates that the company is becoming more risky for loaning and investing purpose as it is
becoming more leveraged. Further, if the equity ratio is considered, it can be identified that
the equity ratio of the company is considerably low which means the company is less
sustainable and more risky for the purpose of future loans. Therefore, it will not be a wise
decision on the part of Kiwibank to extend the loan.
⊘ This is a preview!⊘
Do you want full access?
Subscribe today to unlock all pages.
Trusted by 1+ million students worldwide
9FINANCIAL MANAGEMENT
Reference & Bibliography
Bodie, Z. (2013). Investments. McGraw-Hill.
Collier, P. M. (2015). Accounting for managers: Interpreting accounting information for
decision making. John Wiley & Sons.
Ecer, F., & Boyukaslan, A. (2014). Measuring performances of football clubs using financial
ratios: the gray relational analysis approach. American Journal of Economics, 4(1),
62-71.
Innocent, E. C., Mary, O. I., & Matthew, O. M. (2013). Financial ratio analysis as a
determinant of profitability in Nigerian pharmaceutical industry. International journal
of business and management, 8(8), 107.
Kmart.co.nz. (2017). Kmart.co.nz. Retrieved 1 October 2017, from http://www.kmart.co.nz/
Ogiela, L. (2013). Data management in cognitive financial systems. International Journal of
Information Management, 33(2), 263-270.
Robinson, T. R., Henry, E., Pirie, W. L., & Broihahn, M. A. (2015). International financial
statement analysis. John Wiley & Sons.
The Warehouse | Fashion, Homewares, Toys & much more. (2017). Thewarehouse.co.nz.
Retrieved 1 October 2017, from http://www.thewarehouse.co.nz/
1 out of 10
Related Documents


Your All-in-One AI-Powered Toolkit for Academic Success.
+13062052269
info@desklib.com
Available 24*7 on WhatsApp / Email
![[object Object]](/_next/static/media/star-bottom.7253800d.svg)
Unlock your academic potential
Copyright © 2020–2026 A2Z Services. All Rights Reserved. Developed and managed by ZUCOL.