Finance 2 Project Report: Legend Corporation Financial Analysis
VerifiedAdded on 2022/12/27
|20
|3990
|2
Report
AI Summary
This finance project report provides a comprehensive financial analysis of Legend Corporation, an Australian engineering solutions company. The report begins with an introduction to the company, its establishment, and its operations across various sectors. It delves into the corporate governance structure, including the roles of the CEO and board of directors, and considers financial market factors such as stock performance. The analysis further examines risk and return parameters, including historical risk parameters, cost of equity, and default risk. The report also evaluates financial performance through profitability, liquidity, efficiency, and capital structure ratios, along with market efficiency ratios. The project includes an executive summary, detailed analysis of financial statements, and discussions on market performance, competitive strength, and financing aspects. The findings offer insights into the company's financial health, risk management, and overall market position, supported by references and appendices.
Running Head: Finance
1
Project Report: Finance
1
Project Report: Finance
Paraphrase This Document
Need a fresh take? Get an instant paraphrase of this document with our AI Paraphraser
Finance
2
Contents
Introduction.......................................................................................................................3
Corporate governance.......................................................................................................4
Chief executive officer.................................................................................................4
The board of directors...................................................................................................4
Financial market consideration.....................................................................................5
Risk and return..................................................................................................................6
Historical risk parameters.............................................................................................6
Estimating default risk and cost of debt.......................................................................9
Estimating cost of capital............................................................................................12
Cash flows......................................................................................................................14
Existing investment and financial performance.........................................................14
Market performance....................................................................................................15
Competitive strength...................................................................................................15
Competitor analysis....................................................................................................16
Financing........................................................................................................................16
Dividends........................................................................................................................17
Conclusion......................................................................................................................18
References.......................................................................................................................19
Appendix.........................................................................................................................20
Finance
3
Introduction:
Legend Corporation limited is an Australian company which offers the engineering
solution to its customers. The main services of the company include operating in electrical,
rail, mining, power, information technology, medial, and semiconductor and defence
industries. Company is in the market since 1962 and had registered itself in ASX in the year
of 2004. Along with the Australian market, company has its operations in New Zealand and
pacific region. It offers a wide range of consumables, tools, measurements, test and
components relevant to client partners1.
The reports offer an idea about the performance of Legend Corporation in the capital
market. Financial performance, stock position and market level of the company has been
identified through focusing over financial statement of the company of last 5 years. The
report depicts about the corporate governance structure, WACC, risk level, cash management
performance and financial performance of the company. General information about the
company is as follows:
Company Legend Corporation
Establishment year 1962
Country of origin Australia
Sector Services
Service Engineering services
Listing ASX
Stock exchange listing
year
2004
ASX code LGD
Reporting currency AUD
Revenue (AUD '000) $ 114,901
EBIT (AUD '000) $ 9,922
NPAT (AUD '000) $ 5,9782
1 Home. (2019). Legend corporation. (Accessed 10 May 2019); available from:
https://www.legendcorporate.com/about/
2 annual report. (2019). Legend corporation. (Accessed 10 May 2019); available from
https://www.legendcorporate.com/investor_relations/annual_reports/AR2018.pdf
⊘ This is a preview!⊘
Do you want full access?
Subscribe today to unlock all pages.
Trusted by 1+ million students worldwide
Finance
4
Corporate governance:
Corporate governance of the company has been studied initially to measure the
internal performance and position of the company.
Chief executive officer:
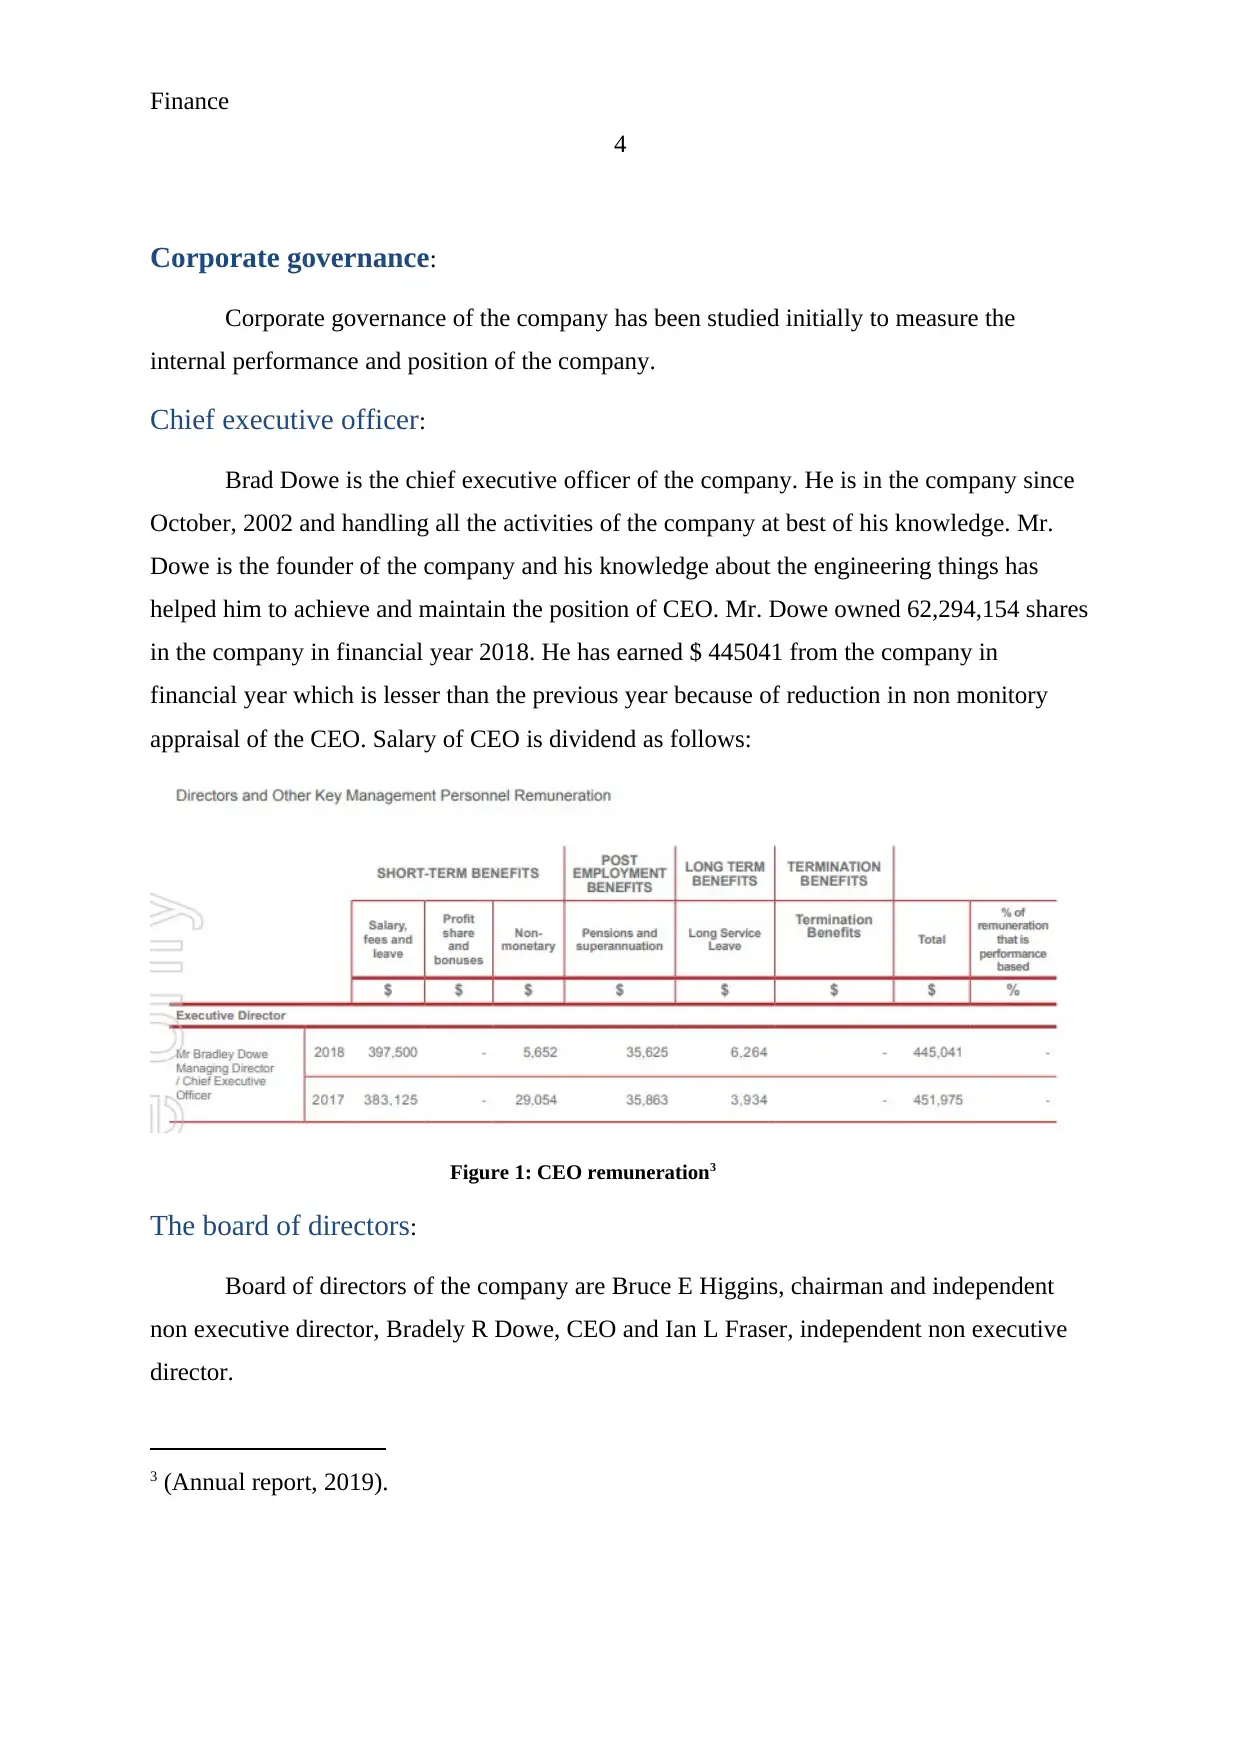
Brad Dowe is the chief executive officer of the company. He is in the company since
October, 2002 and handling all the activities of the company at best of his knowledge. Mr.
Dowe is the founder of the company and his knowledge about the engineering things has
helped him to achieve and maintain the position of CEO. Mr. Dowe owned 62,294,154 shares
in the company in financial year 2018. He has earned $ 445041 from the company in
financial year which is lesser than the previous year because of reduction in non monitory
appraisal of the CEO. Salary of CEO is dividend as follows:
Figure 1: CEO remuneration3
The board of directors:
Board of directors of the company are Bruce E Higgins, chairman and independent
non executive director, Bradely R Dowe, CEO and Ian L Fraser, independent non executive
director.
3 (Annual report, 2019).
4
Corporate governance:
Corporate governance of the company has been studied initially to measure the
internal performance and position of the company.
Chief executive officer:
Brad Dowe is the chief executive officer of the company. He is in the company since
October, 2002 and handling all the activities of the company at best of his knowledge. Mr.
Dowe is the founder of the company and his knowledge about the engineering things has
helped him to achieve and maintain the position of CEO. Mr. Dowe owned 62,294,154 shares
in the company in financial year 2018. He has earned $ 445041 from the company in
financial year which is lesser than the previous year because of reduction in non monitory
appraisal of the CEO. Salary of CEO is dividend as follows:
Figure 1: CEO remuneration3
The board of directors:
Board of directors of the company are Bruce E Higgins, chairman and independent
non executive director, Bradely R Dowe, CEO and Ian L Fraser, independent non executive
director.
3 (Annual report, 2019).
Paraphrase This Document
Need a fresh take? Get an instant paraphrase of this document with our AI Paraphraser
Finance
5
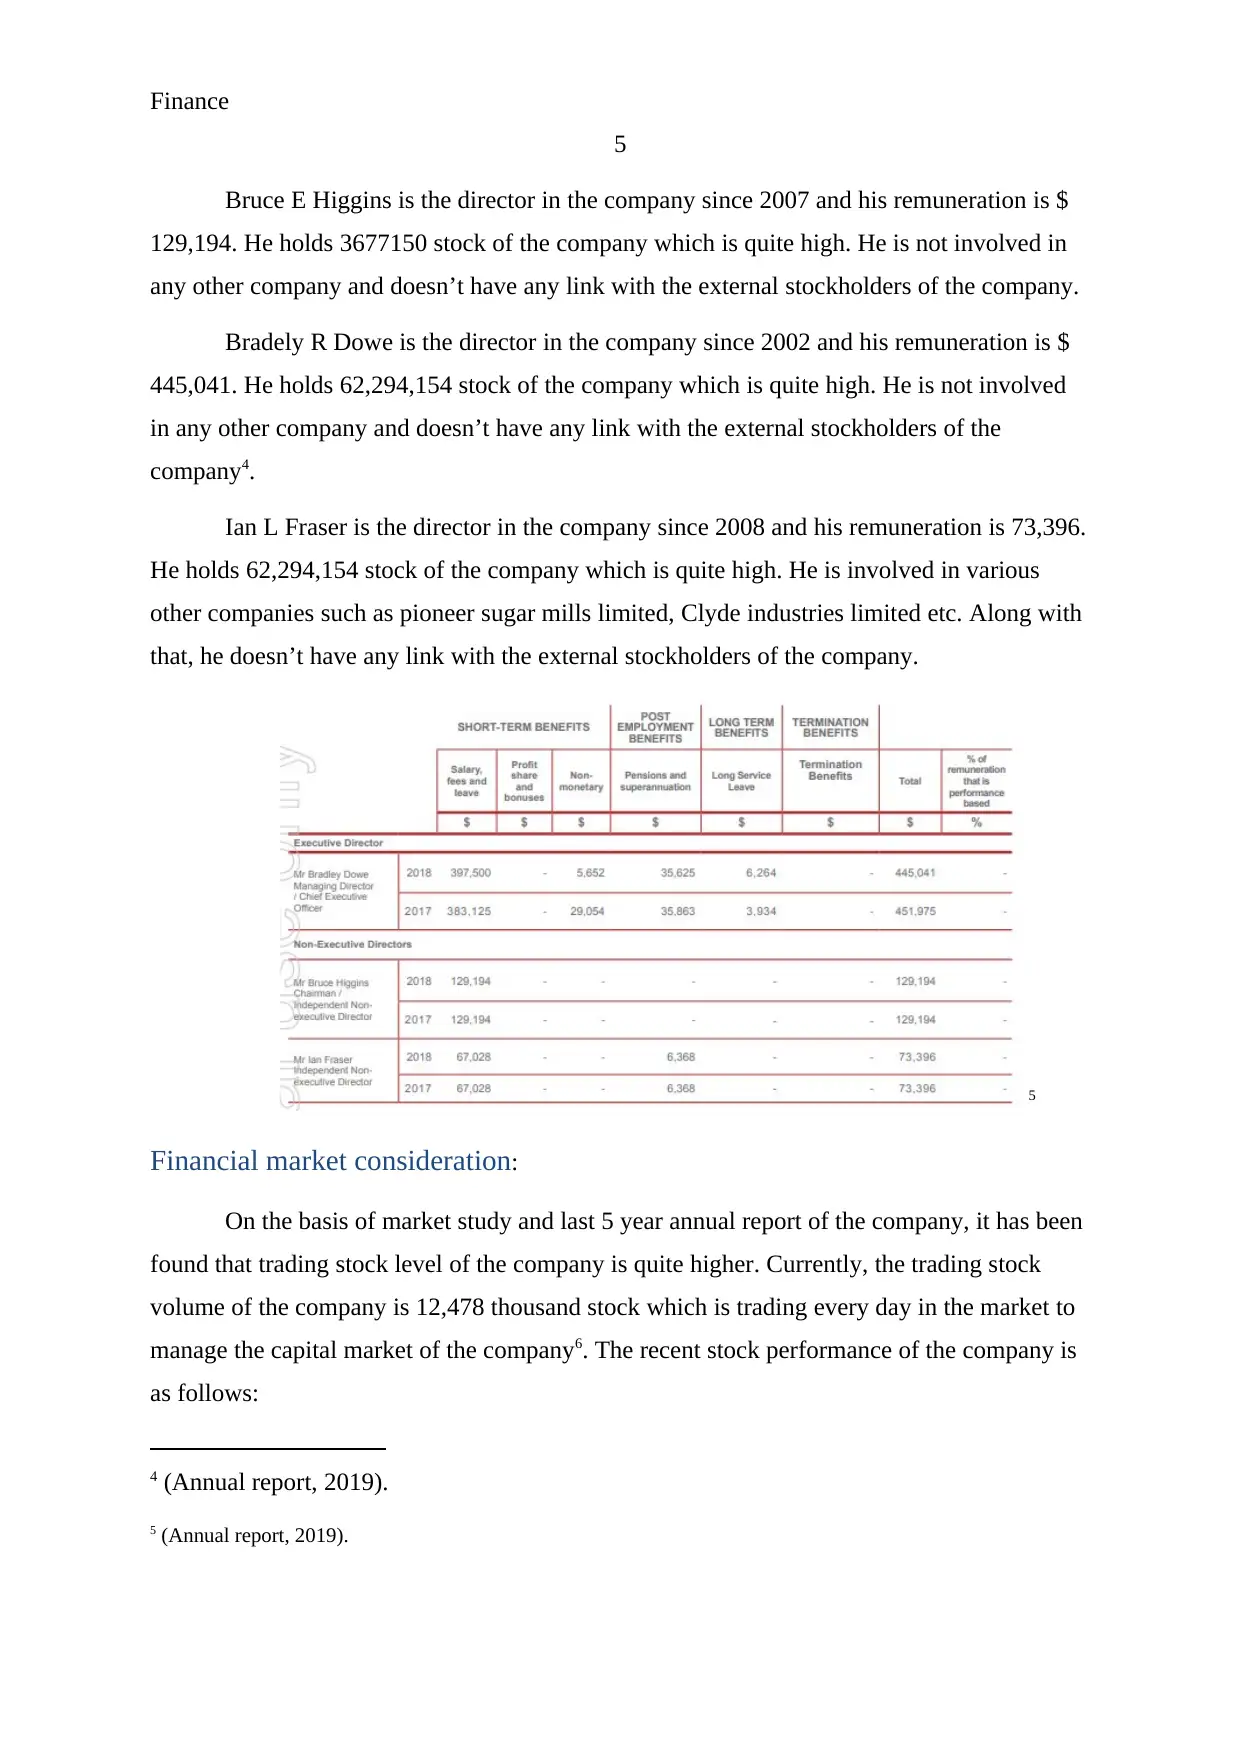
Bruce E Higgins is the director in the company since 2007 and his remuneration is $
129,194. He holds 3677150 stock of the company which is quite high. He is not involved in
any other company and doesn’t have any link with the external stockholders of the company.
Bradely R Dowe is the director in the company since 2002 and his remuneration is $
445,041. He holds 62,294,154 stock of the company which is quite high. He is not involved
in any other company and doesn’t have any link with the external stockholders of the
company4.
Ian L Fraser is the director in the company since 2008 and his remuneration is 73,396.
He holds 62,294,154 stock of the company which is quite high. He is involved in various
other companies such as pioneer sugar mills limited, Clyde industries limited etc. Along with
that, he doesn’t have any link with the external stockholders of the company.
5
Financial market consideration:
On the basis of market study and last 5 year annual report of the company, it has been
found that trading stock level of the company is quite higher. Currently, the trading stock
volume of the company is 12,478 thousand stock which is trading every day in the market to
manage the capital market of the company6. The recent stock performance of the company is
as follows:
4 (Annual report, 2019).
5 (Annual report, 2019).
5
Bruce E Higgins is the director in the company since 2007 and his remuneration is $
129,194. He holds 3677150 stock of the company which is quite high. He is not involved in
any other company and doesn’t have any link with the external stockholders of the company.
Bradely R Dowe is the director in the company since 2002 and his remuneration is $
445,041. He holds 62,294,154 stock of the company which is quite high. He is not involved
in any other company and doesn’t have any link with the external stockholders of the
company4.
Ian L Fraser is the director in the company since 2008 and his remuneration is 73,396.
He holds 62,294,154 stock of the company which is quite high. He is involved in various
other companies such as pioneer sugar mills limited, Clyde industries limited etc. Along with
that, he doesn’t have any link with the external stockholders of the company.
5
Financial market consideration:
On the basis of market study and last 5 year annual report of the company, it has been
found that trading stock level of the company is quite higher. Currently, the trading stock
volume of the company is 12,478 thousand stock which is trading every day in the market to
manage the capital market of the company6. The recent stock performance of the company is
as follows:
4 (Annual report, 2019).
5 (Annual report, 2019).
Finance
6
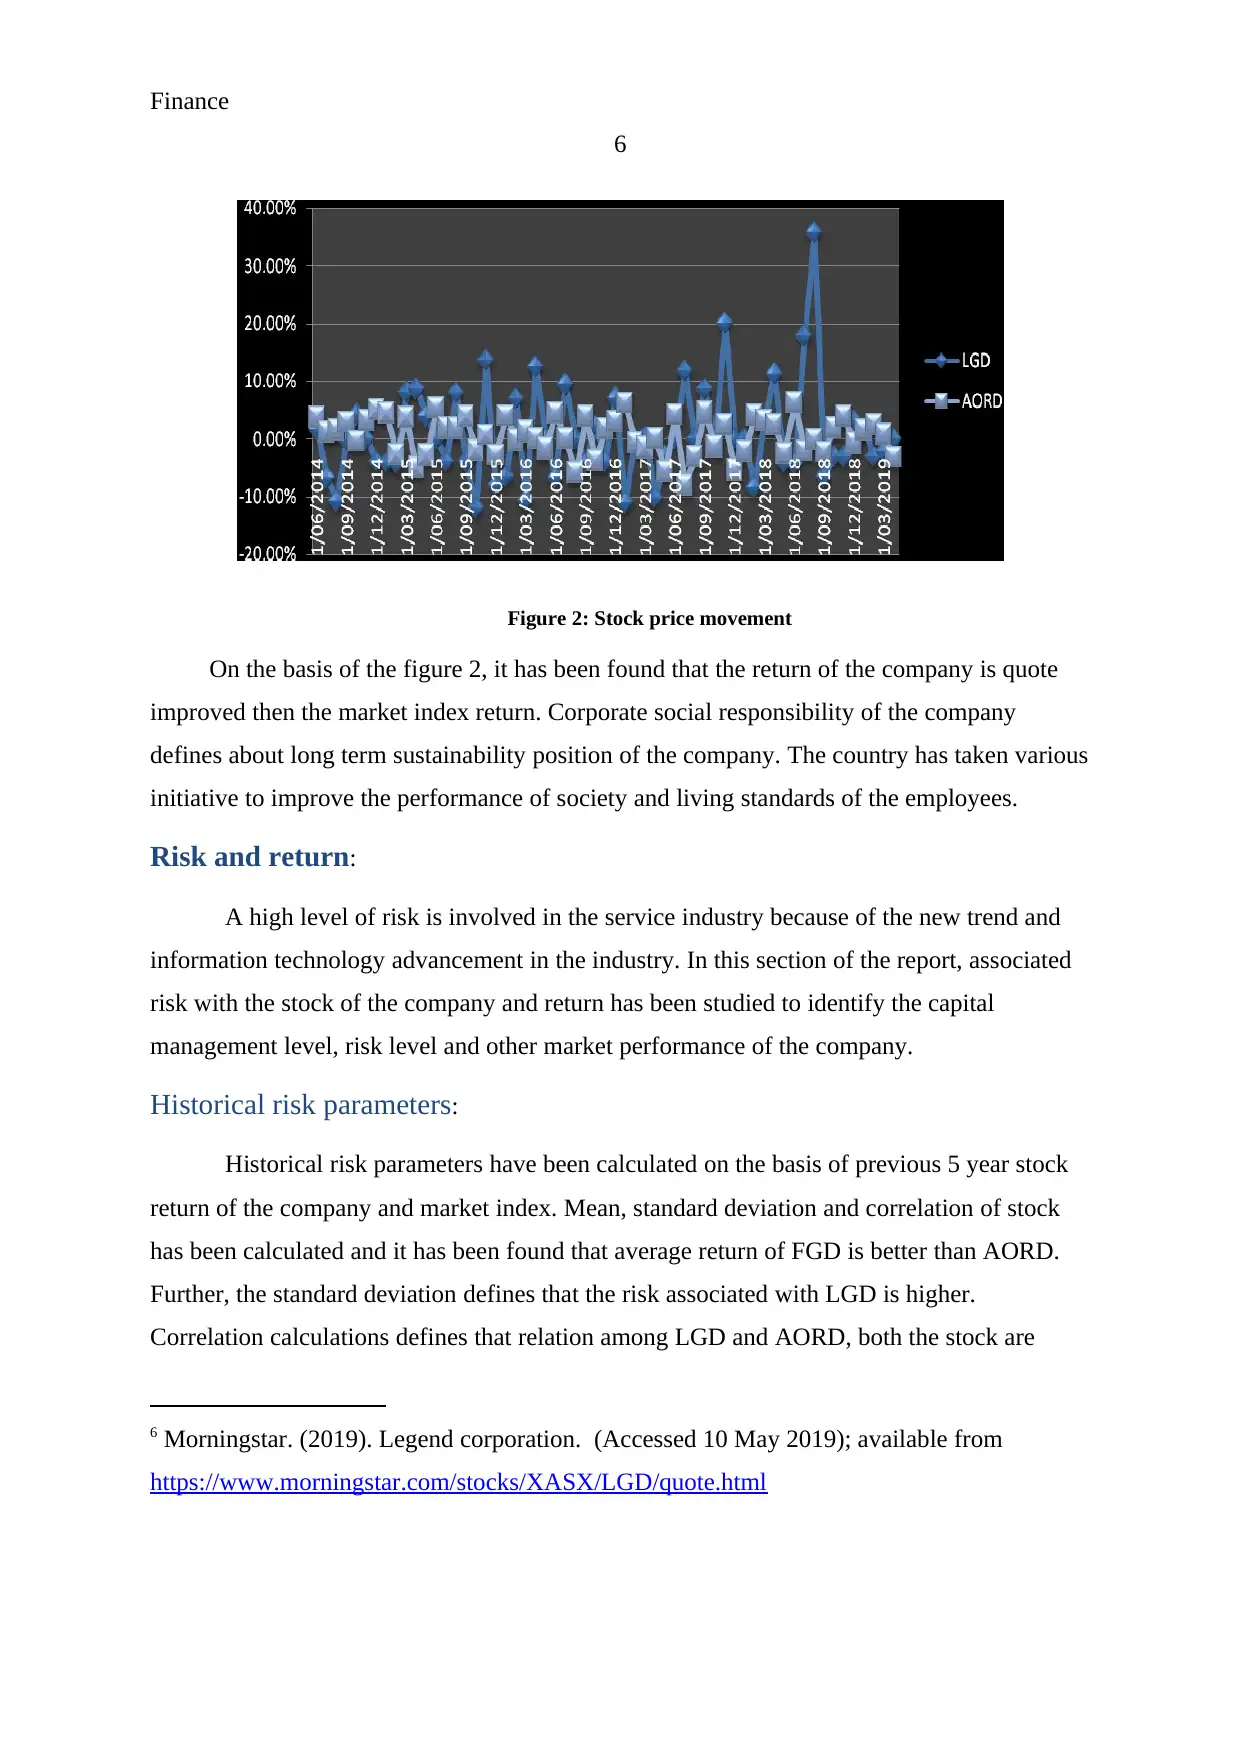
Figure 2: Stock price movement
On the basis of the figure 2, it has been found that the return of the company is quote
improved then the market index return. Corporate social responsibility of the company
defines about long term sustainability position of the company. The country has taken various
initiative to improve the performance of society and living standards of the employees.
Risk and return:
A high level of risk is involved in the service industry because of the new trend and
information technology advancement in the industry. In this section of the report, associated
risk with the stock of the company and return has been studied to identify the capital
management level, risk level and other market performance of the company.
Historical risk parameters:
Historical risk parameters have been calculated on the basis of previous 5 year stock
return of the company and market index. Mean, standard deviation and correlation of stock
has been calculated and it has been found that average return of FGD is better than AORD.
Further, the standard deviation defines that the risk associated with LGD is higher.
Correlation calculations defines that relation among LGD and AORD, both the stock are
6 Morningstar. (2019). Legend corporation. (Accessed 10 May 2019); available from
https://www.morningstar.com/stocks/XASX/LGD/quote.html
6
Figure 2: Stock price movement
On the basis of the figure 2, it has been found that the return of the company is quote
improved then the market index return. Corporate social responsibility of the company
defines about long term sustainability position of the company. The country has taken various
initiative to improve the performance of society and living standards of the employees.
Risk and return:
A high level of risk is involved in the service industry because of the new trend and
information technology advancement in the industry. In this section of the report, associated
risk with the stock of the company and return has been studied to identify the capital
management level, risk level and other market performance of the company.
Historical risk parameters:
Historical risk parameters have been calculated on the basis of previous 5 year stock
return of the company and market index. Mean, standard deviation and correlation of stock
has been calculated and it has been found that average return of FGD is better than AORD.
Further, the standard deviation defines that the risk associated with LGD is higher.
Correlation calculations defines that relation among LGD and AORD, both the stock are
6 Morningstar. (2019). Legend corporation. (Accessed 10 May 2019); available from
https://www.morningstar.com/stocks/XASX/LGD/quote.html
⊘ This is a preview!⊘
Do you want full access?
Subscribe today to unlock all pages.
Trusted by 1+ million students worldwide
Finance
7
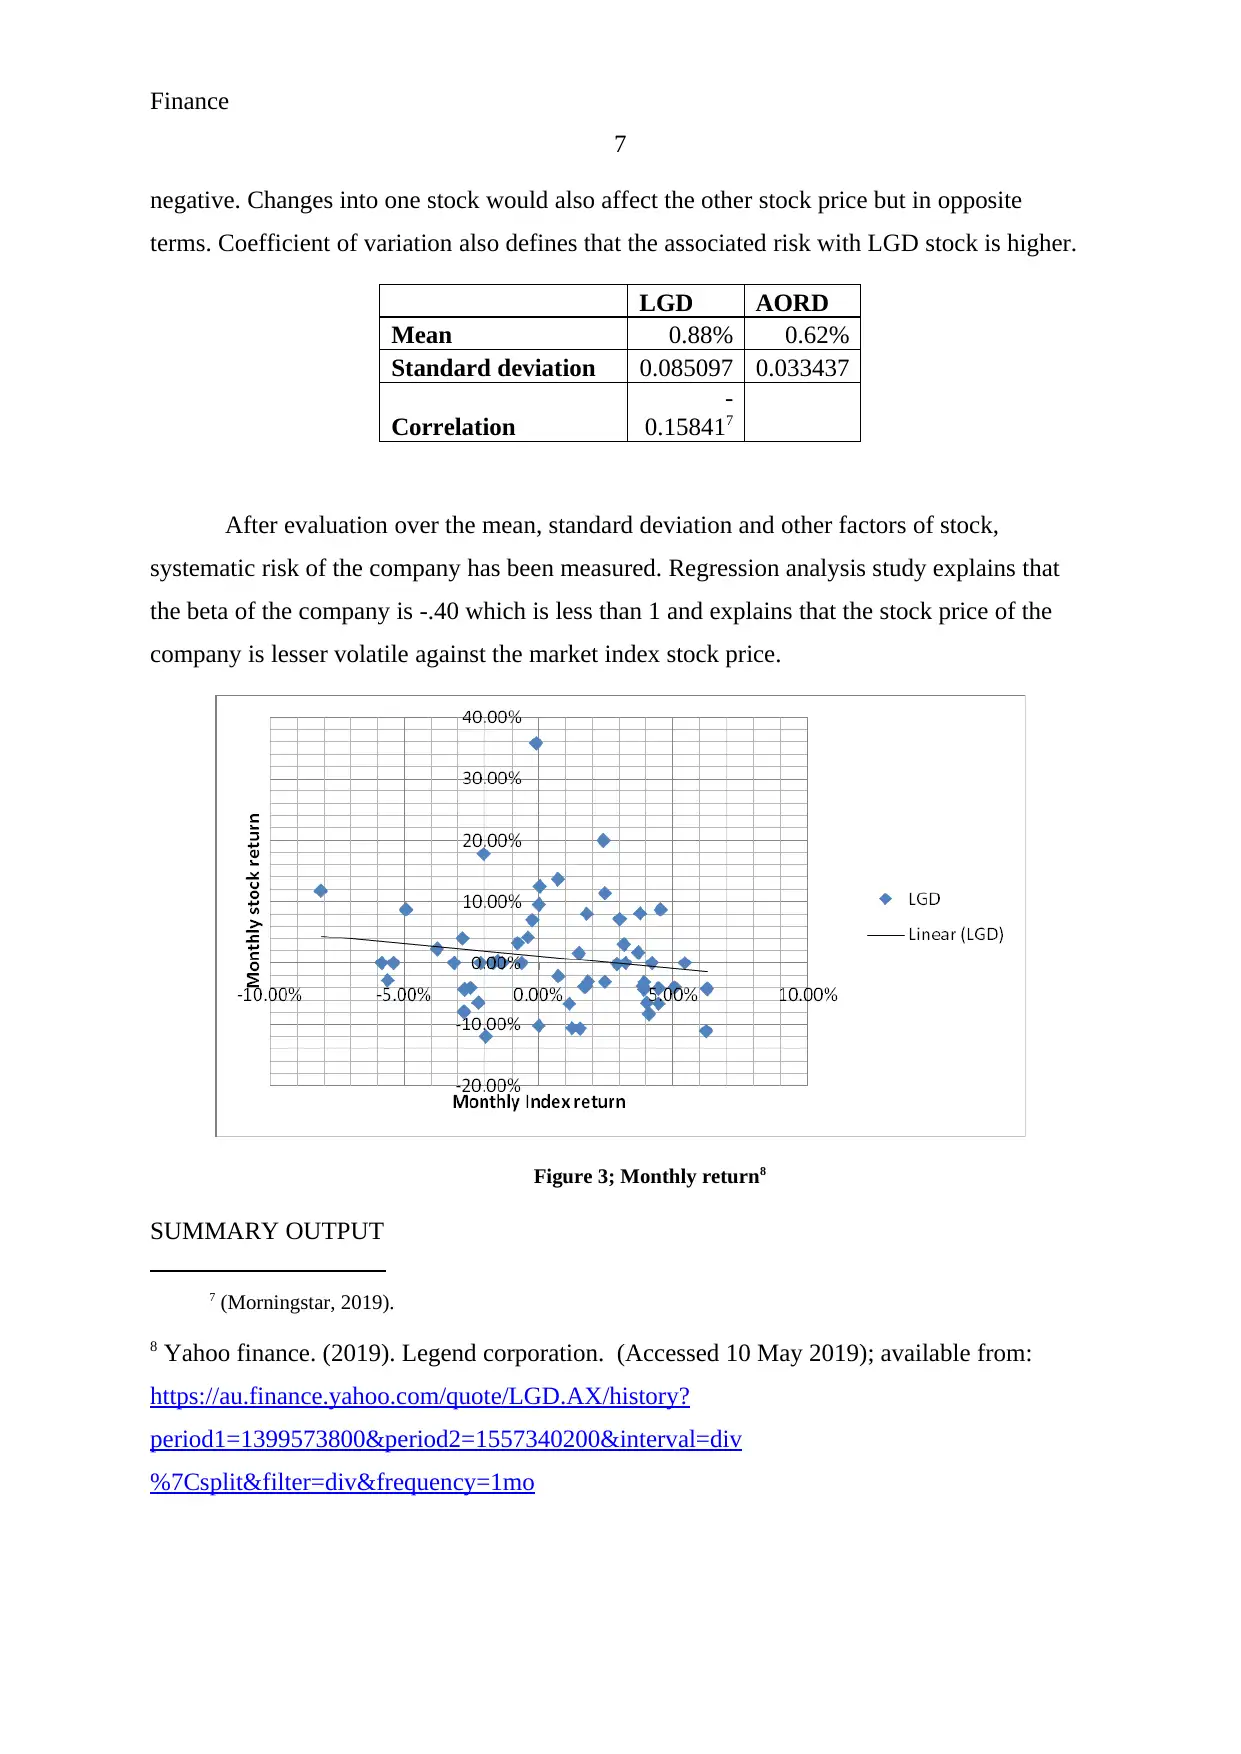
negative. Changes into one stock would also affect the other stock price but in opposite
terms. Coefficient of variation also defines that the associated risk with LGD stock is higher.
LGD AORD
Mean 0.88% 0.62%
Standard deviation 0.085097 0.033437
Correlation
-
0.158417
After evaluation over the mean, standard deviation and other factors of stock,
systematic risk of the company has been measured. Regression analysis study explains that
the beta of the company is -.40 which is less than 1 and explains that the stock price of the
company is lesser volatile against the market index stock price.
Figure 3; Monthly return8
SUMMARY OUTPUT
7 (Morningstar, 2019).
8 Yahoo finance. (2019). Legend corporation. (Accessed 10 May 2019); available from:
https://au.finance.yahoo.com/quote/LGD.AX/history?
period1=1399573800&period2=1557340200&interval=div
%7Csplit&filter=div&frequency=1mo
7
negative. Changes into one stock would also affect the other stock price but in opposite
terms. Coefficient of variation also defines that the associated risk with LGD stock is higher.
LGD AORD
Mean 0.88% 0.62%
Standard deviation 0.085097 0.033437
Correlation
-
0.158417
After evaluation over the mean, standard deviation and other factors of stock,
systematic risk of the company has been measured. Regression analysis study explains that
the beta of the company is -.40 which is less than 1 and explains that the stock price of the
company is lesser volatile against the market index stock price.
Figure 3; Monthly return8
SUMMARY OUTPUT
7 (Morningstar, 2019).
8 Yahoo finance. (2019). Legend corporation. (Accessed 10 May 2019); available from:
https://au.finance.yahoo.com/quote/LGD.AX/history?
period1=1399573800&period2=1557340200&interval=div
%7Csplit&filter=div&frequency=1mo
Paraphrase This Document
Need a fresh take? Get an instant paraphrase of this document with our AI Paraphraser
Finance
8
Regression Statistics
Multiple R
0.1584
11
R Square
0.0250
94
Adjusted R
Square
0.0079
91
Standard
Error
0.0847
56
Observatio
ns 59
ANOVA
df SS MS F
Significa
nce F
Regression 1 0.01054
0.010
54
1.467
183
0.23078
9
Residual 57 0.409468
0.007
184
Total 58 0.420007
Coeffic
ients
Standard
Error t Stat
P-
value
Lower
95%
Upper
95%
Lower
95.0%
Upper
95.0%
Intercept
0.0112
48 0.011225
1.002
043
0.320
558 -0.01123
0.0337
25
-
0.01123
0.03372
5
X Variable
1
-
0.4031
5 0.332835
-
1.211
27
0.230
789 -1.06965
0.2633
37
-
1.06965
0.26333
7
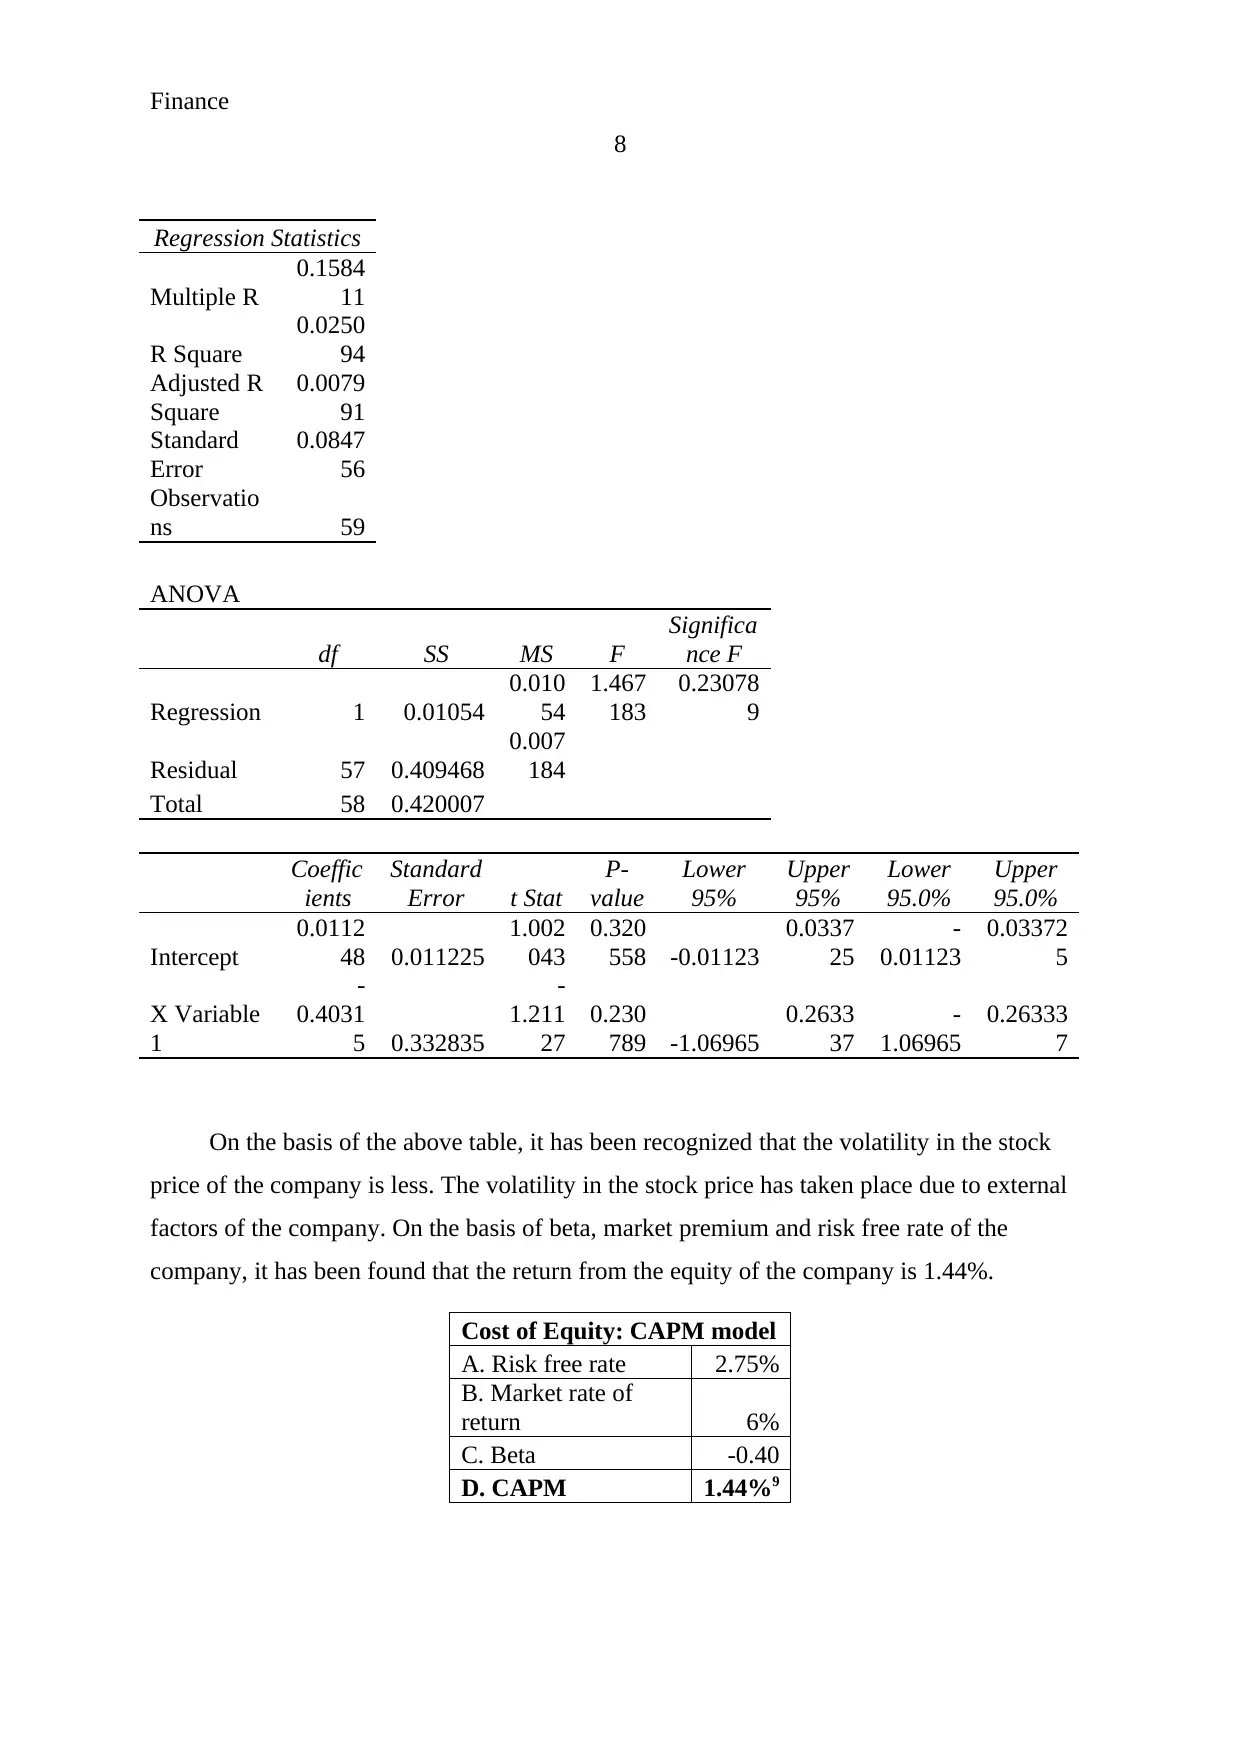
On the basis of the above table, it has been recognized that the volatility in the stock
price of the company is less. The volatility in the stock price has taken place due to external
factors of the company. On the basis of beta, market premium and risk free rate of the
company, it has been found that the return from the equity of the company is 1.44%.
Cost of Equity: CAPM model
A. Risk free rate 2.75%
B. Market rate of
return 6%
C. Beta -0.40
D. CAPM 1.44%9
8
Regression Statistics
Multiple R
0.1584
11
R Square
0.0250
94
Adjusted R
Square
0.0079
91
Standard
Error
0.0847
56
Observatio
ns 59
ANOVA
df SS MS F
Significa
nce F
Regression 1 0.01054
0.010
54
1.467
183
0.23078
9
Residual 57 0.409468
0.007
184
Total 58 0.420007
Coeffic
ients
Standard
Error t Stat
P-
value
Lower
95%
Upper
95%
Lower
95.0%
Upper
95.0%
Intercept
0.0112
48 0.011225
1.002
043
0.320
558 -0.01123
0.0337
25
-
0.01123
0.03372
5
X Variable
1
-
0.4031
5 0.332835
-
1.211
27
0.230
789 -1.06965
0.2633
37
-
1.06965
0.26333
7
On the basis of the above table, it has been recognized that the volatility in the stock
price of the company is less. The volatility in the stock price has taken place due to external
factors of the company. On the basis of beta, market premium and risk free rate of the
company, it has been found that the return from the equity of the company is 1.44%.
Cost of Equity: CAPM model
A. Risk free rate 2.75%
B. Market rate of
return 6%
C. Beta -0.40
D. CAPM 1.44%9
Finance
9
Being a manager of the firm, it has been found that the cost of equity of the company is
quite lower which could be further controlled through managing the capital structure and
applying various dividend distribution strategies.
Estimating default risk and cost of debt:
On the basis of rating given to the debt of the company, it has been found that the debt
of the company is of a rating. It explains that the risk level associated with the debt of the
company is quite lower and investors could invest into the debt without any hesitation.
Further, financial ratios have been conducted on the company:
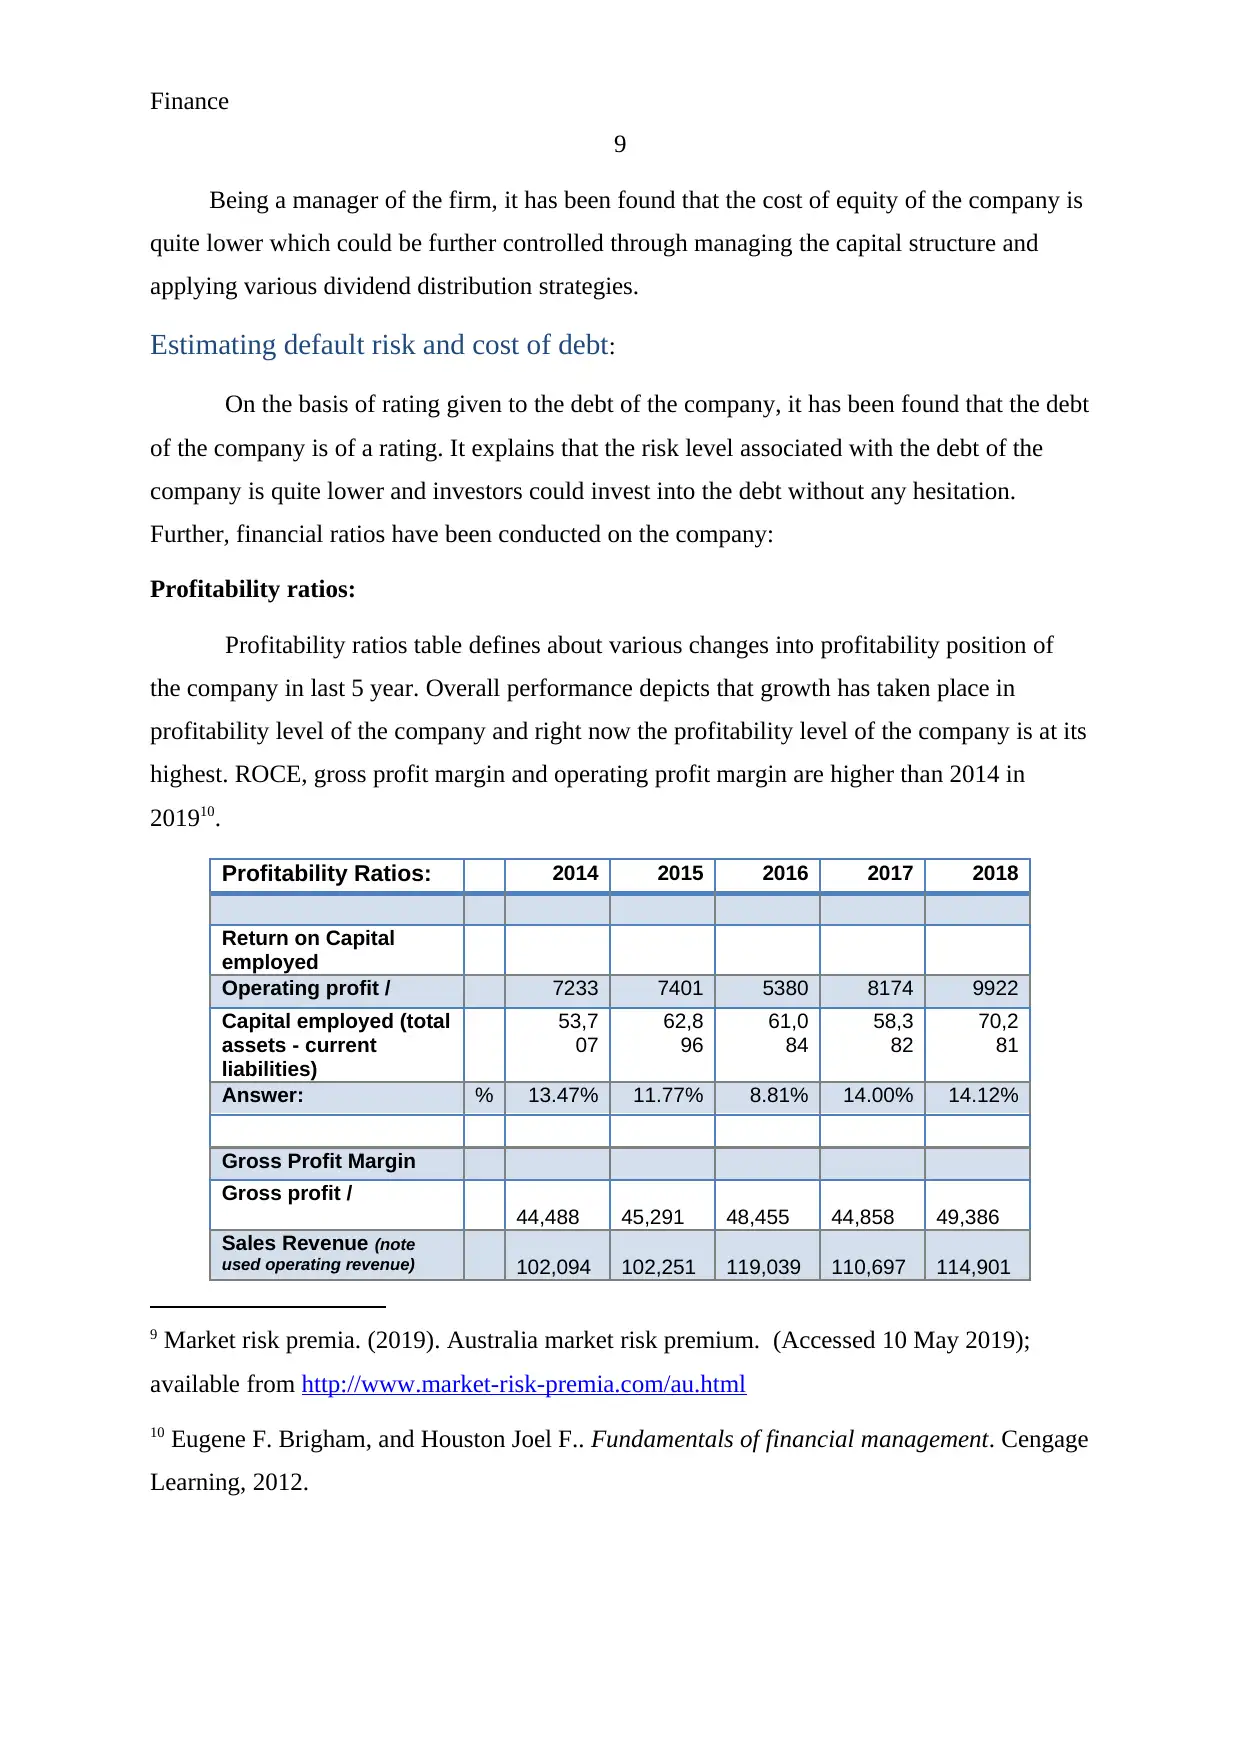
Profitability ratios:
Profitability ratios table defines about various changes into profitability position of
the company in last 5 year. Overall performance depicts that growth has taken place in
profitability level of the company and right now the profitability level of the company is at its
highest. ROCE, gross profit margin and operating profit margin are higher than 2014 in
201910.
Profitability Ratios: 2014 2015 2016 2017 2018
Return on Capital
employed
Operating profit / 7233 7401 5380 8174 9922
Capital employed (total
assets - current
liabilities)
53,7
07
62,8
96
61,0
84
58,3
82
70,2
81
Answer: % 13.47% 11.77% 8.81% 14.00% 14.12%
Gross Profit Margin
Gross profit /
44,488 45,291 48,455 44,858 49,386
Sales Revenue (note
used operating revenue) 102,094 102,251 119,039 110,697 114,901
9 Market risk premia. (2019). Australia market risk premium. (Accessed 10 May 2019);
available from http://www.market-risk-premia.com/au.html
10 Eugene F. Brigham, and Houston Joel F.. Fundamentals of financial management. Cengage
Learning, 2012.
9
Being a manager of the firm, it has been found that the cost of equity of the company is
quite lower which could be further controlled through managing the capital structure and
applying various dividend distribution strategies.
Estimating default risk and cost of debt:
On the basis of rating given to the debt of the company, it has been found that the debt
of the company is of a rating. It explains that the risk level associated with the debt of the
company is quite lower and investors could invest into the debt without any hesitation.
Further, financial ratios have been conducted on the company:
Profitability ratios:
Profitability ratios table defines about various changes into profitability position of
the company in last 5 year. Overall performance depicts that growth has taken place in
profitability level of the company and right now the profitability level of the company is at its
highest. ROCE, gross profit margin and operating profit margin are higher than 2014 in
201910.
Profitability Ratios: 2014 2015 2016 2017 2018
Return on Capital
employed
Operating profit / 7233 7401 5380 8174 9922
Capital employed (total
assets - current
liabilities)
53,7
07
62,8
96
61,0
84
58,3
82
70,2
81
Answer: % 13.47% 11.77% 8.81% 14.00% 14.12%
Gross Profit Margin
Gross profit /
44,488 45,291 48,455 44,858 49,386
Sales Revenue (note
used operating revenue) 102,094 102,251 119,039 110,697 114,901
9 Market risk premia. (2019). Australia market risk premium. (Accessed 10 May 2019);
available from http://www.market-risk-premia.com/au.html
10 Eugene F. Brigham, and Houston Joel F.. Fundamentals of financial management. Cengage
Learning, 2012.
⊘ This is a preview!⊘
Do you want full access?
Subscribe today to unlock all pages.
Trusted by 1+ million students worldwide
Finance
10
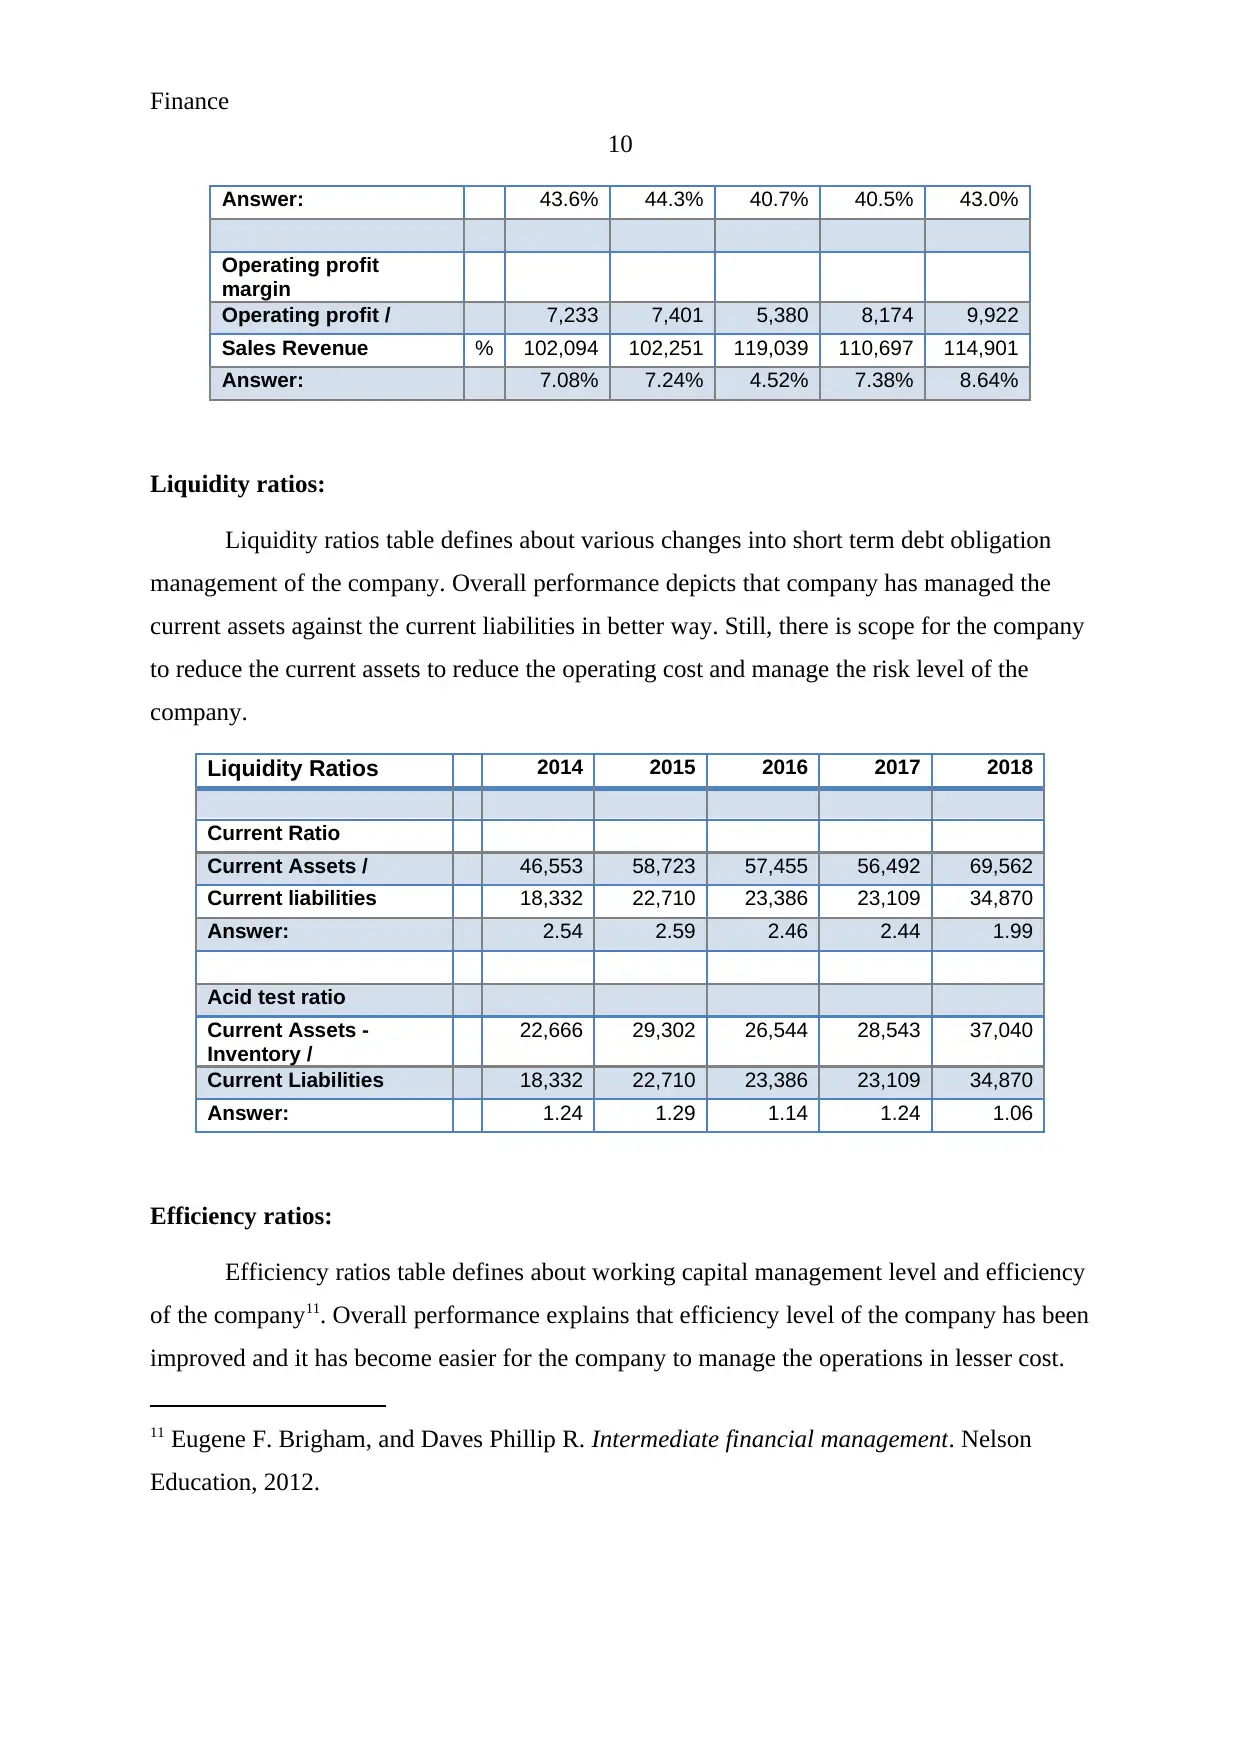
Answer: 43.6% 44.3% 40.7% 40.5% 43.0%
Operating profit
margin
Operating profit / 7,233 7,401 5,380 8,174 9,922
Sales Revenue % 102,094 102,251 119,039 110,697 114,901
Answer: 7.08% 7.24% 4.52% 7.38% 8.64%
Liquidity ratios:
Liquidity ratios table defines about various changes into short term debt obligation
management of the company. Overall performance depicts that company has managed the
current assets against the current liabilities in better way. Still, there is scope for the company
to reduce the current assets to reduce the operating cost and manage the risk level of the
company.
Liquidity Ratios 2014 2015 2016 2017 2018
Current Ratio
Current Assets / 46,553 58,723 57,455 56,492 69,562
Current liabilities 18,332 22,710 23,386 23,109 34,870
Answer: 2.54 2.59 2.46 2.44 1.99
Acid test ratio
Current Assets -
Inventory /
22,666 29,302 26,544 28,543 37,040
Current Liabilities 18,332 22,710 23,386 23,109 34,870
Answer: 1.24 1.29 1.14 1.24 1.06
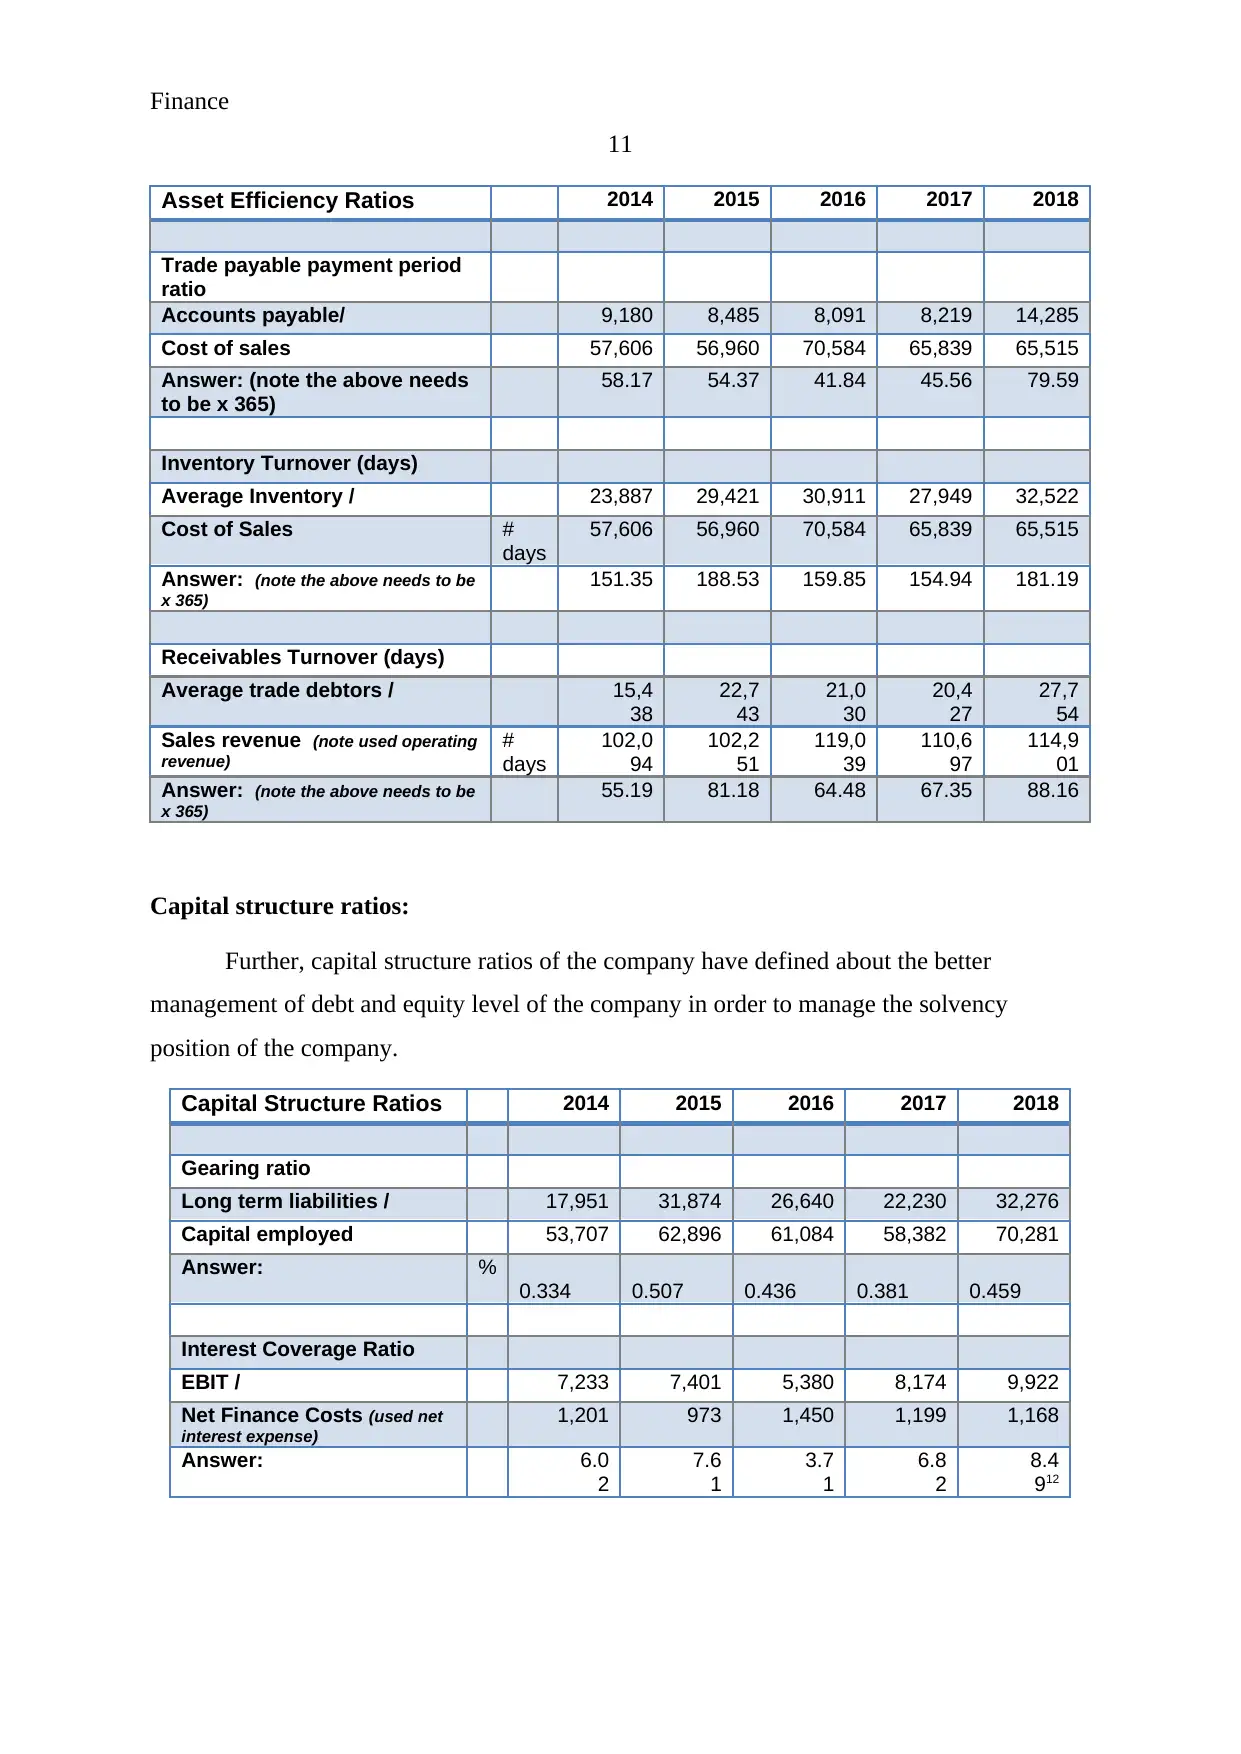
Efficiency ratios:
Efficiency ratios table defines about working capital management level and efficiency
of the company11. Overall performance explains that efficiency level of the company has been
improved and it has become easier for the company to manage the operations in lesser cost.
11 Eugene F. Brigham, and Daves Phillip R. Intermediate financial management. Nelson
Education, 2012.
10
Answer: 43.6% 44.3% 40.7% 40.5% 43.0%
Operating profit
margin
Operating profit / 7,233 7,401 5,380 8,174 9,922
Sales Revenue % 102,094 102,251 119,039 110,697 114,901
Answer: 7.08% 7.24% 4.52% 7.38% 8.64%
Liquidity ratios:
Liquidity ratios table defines about various changes into short term debt obligation
management of the company. Overall performance depicts that company has managed the
current assets against the current liabilities in better way. Still, there is scope for the company
to reduce the current assets to reduce the operating cost and manage the risk level of the
company.
Liquidity Ratios 2014 2015 2016 2017 2018
Current Ratio
Current Assets / 46,553 58,723 57,455 56,492 69,562
Current liabilities 18,332 22,710 23,386 23,109 34,870
Answer: 2.54 2.59 2.46 2.44 1.99
Acid test ratio
Current Assets -
Inventory /
22,666 29,302 26,544 28,543 37,040
Current Liabilities 18,332 22,710 23,386 23,109 34,870
Answer: 1.24 1.29 1.14 1.24 1.06
Efficiency ratios:
Efficiency ratios table defines about working capital management level and efficiency
of the company11. Overall performance explains that efficiency level of the company has been
improved and it has become easier for the company to manage the operations in lesser cost.
11 Eugene F. Brigham, and Daves Phillip R. Intermediate financial management. Nelson
Education, 2012.
Paraphrase This Document
Need a fresh take? Get an instant paraphrase of this document with our AI Paraphraser
Finance
11
Asset Efficiency Ratios 2014 2015 2016 2017 2018
Trade payable payment period
ratio
Accounts payable/ 9,180 8,485 8,091 8,219 14,285
Cost of sales 57,606 56,960 70,584 65,839 65,515
Answer: (note the above needs
to be x 365)
58.17 54.37 41.84 45.56 79.59
Inventory Turnover (days)
Average Inventory / 23,887 29,421 30,911 27,949 32,522
Cost of Sales #
days
57,606 56,960 70,584 65,839 65,515
Answer: (note the above needs to be
x 365)
151.35 188.53 159.85 154.94 181.19
Receivables Turnover (days)
Average trade debtors / 15,4
38
22,7
43
21,0
30
20,4
27
27,7
54
Sales revenue (note used operating
revenue)
#
days
102,0
94
102,2
51
119,0
39
110,6
97
114,9
01
Answer: (note the above needs to be
x 365)
55.19 81.18 64.48 67.35 88.16
Capital structure ratios:
Further, capital structure ratios of the company have defined about the better
management of debt and equity level of the company in order to manage the solvency
position of the company.
Capital Structure Ratios 2014 2015 2016 2017 2018
Gearing ratio
Long term liabilities / 17,951 31,874 26,640 22,230 32,276
Capital employed 53,707 62,896 61,084 58,382 70,281
Answer: %
0.334 0.507 0.436 0.381 0.459
Interest Coverage Ratio
EBIT / 7,233 7,401 5,380 8,174 9,922
Net Finance Costs (used net
interest expense)
1,201 973 1,450 1,199 1,168
Answer: 6.0
2
7.6
1
3.7
1
6.8
2
8.4
912
Finance
12
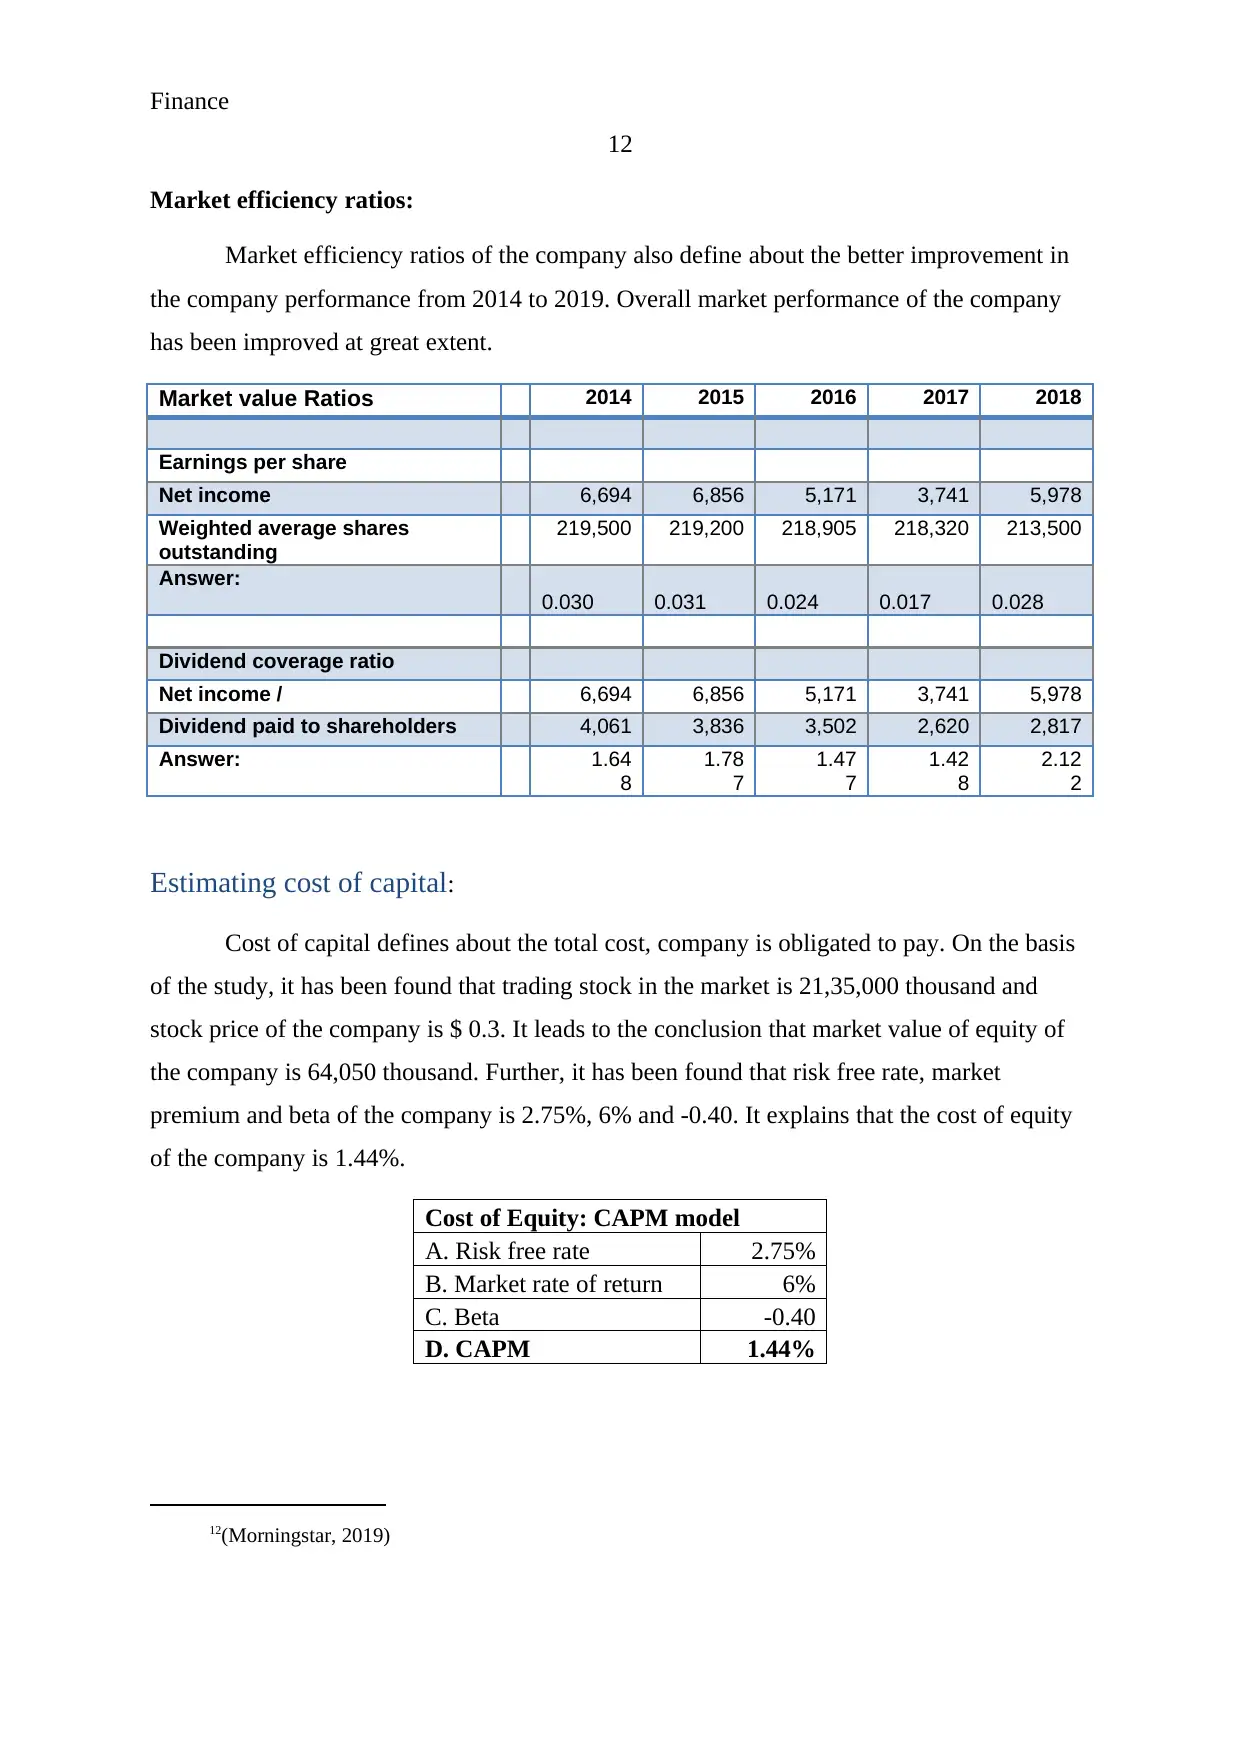
Market efficiency ratios:
Market efficiency ratios of the company also define about the better improvement in
the company performance from 2014 to 2019. Overall market performance of the company
has been improved at great extent.
Market value Ratios 2014 2015 2016 2017 2018
Earnings per share
Net income 6,694 6,856 5,171 3,741 5,978
Weighted average shares
outstanding
219,500 219,200 218,905 218,320 213,500
Answer:
0.030 0.031 0.024 0.017 0.028
Dividend coverage ratio
Net income / 6,694 6,856 5,171 3,741 5,978
Dividend paid to shareholders 4,061 3,836 3,502 2,620 2,817
Answer: 1.64
8
1.78
7
1.47
7
1.42
8
2.12
2
Estimating cost of capital:
Cost of capital defines about the total cost, company is obligated to pay. On the basis
of the study, it has been found that trading stock in the market is 21,35,000 thousand and
stock price of the company is $ 0.3. It leads to the conclusion that market value of equity of
the company is 64,050 thousand. Further, it has been found that risk free rate, market
premium and beta of the company is 2.75%, 6% and -0.40. It explains that the cost of equity
of the company is 1.44%.
Cost of Equity: CAPM model
A. Risk free rate 2.75%
B. Market rate of return 6%
C. Beta -0.40
D. CAPM 1.44%
12(Morningstar, 2019)
12
Market efficiency ratios:
Market efficiency ratios of the company also define about the better improvement in
the company performance from 2014 to 2019. Overall market performance of the company
has been improved at great extent.
Market value Ratios 2014 2015 2016 2017 2018
Earnings per share
Net income 6,694 6,856 5,171 3,741 5,978
Weighted average shares
outstanding
219,500 219,200 218,905 218,320 213,500
Answer:
0.030 0.031 0.024 0.017 0.028
Dividend coverage ratio
Net income / 6,694 6,856 5,171 3,741 5,978
Dividend paid to shareholders 4,061 3,836 3,502 2,620 2,817
Answer: 1.64
8
1.78
7
1.47
7
1.42
8
2.12
2
Estimating cost of capital:
Cost of capital defines about the total cost, company is obligated to pay. On the basis
of the study, it has been found that trading stock in the market is 21,35,000 thousand and
stock price of the company is $ 0.3. It leads to the conclusion that market value of equity of
the company is 64,050 thousand. Further, it has been found that risk free rate, market
premium and beta of the company is 2.75%, 6% and -0.40. It explains that the cost of equity
of the company is 1.44%.
Cost of Equity: CAPM model
A. Risk free rate 2.75%
B. Market rate of return 6%
C. Beta -0.40
D. CAPM 1.44%
12(Morningstar, 2019)
⊘ This is a preview!⊘
Do you want full access?
Subscribe today to unlock all pages.
Trusted by 1+ million students worldwide
1 out of 20
Related Documents


Your All-in-One AI-Powered Toolkit for Academic Success.
+13062052269
info@desklib.com
Available 24*7 on WhatsApp / Email
![[object Object]](/_next/static/media/star-bottom.7253800d.svg)
Unlock your academic potential
Copyright © 2020–2026 A2Z Services. All Rights Reserved. Developed and managed by ZUCOL.