Case Study: Financial Performance Analysis of Macro and Peer Firms
VerifiedAdded on 2020/07/22
|8
|1314
|54
Case Study
AI Summary
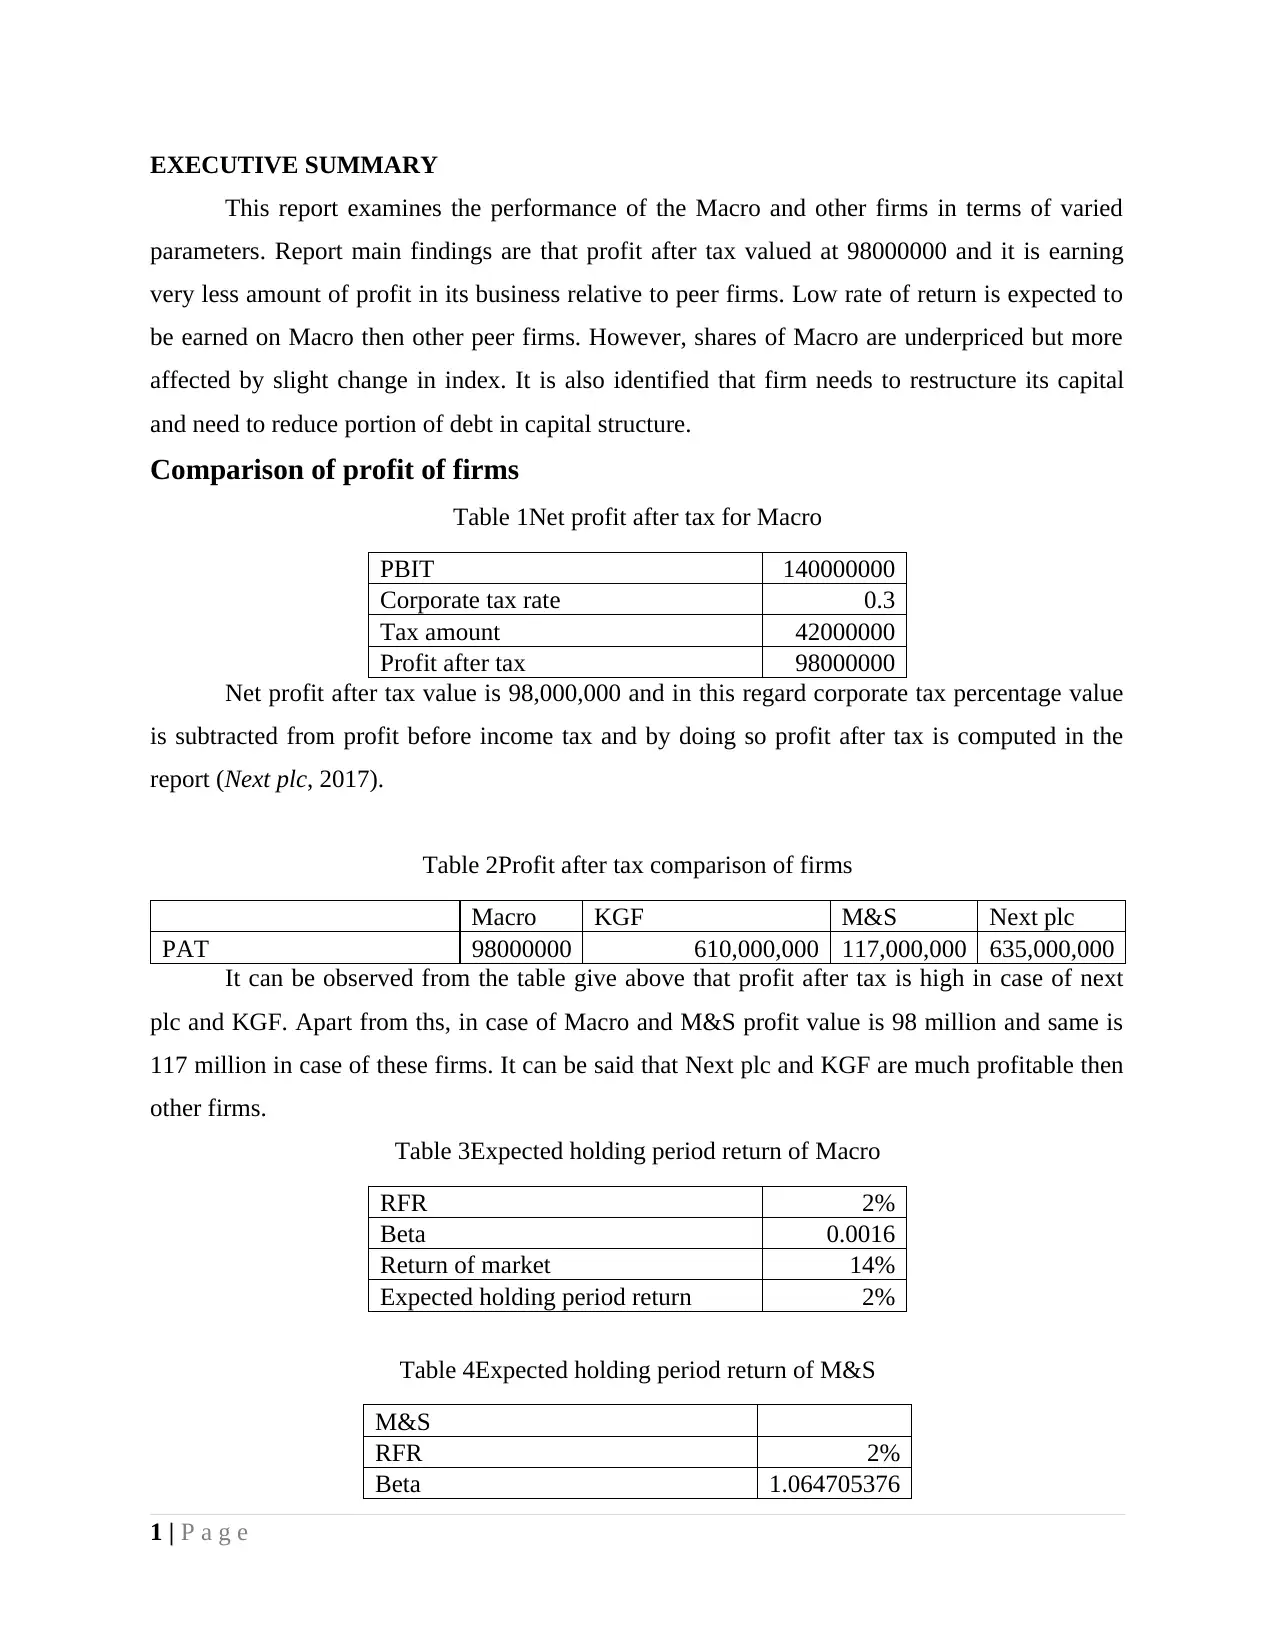
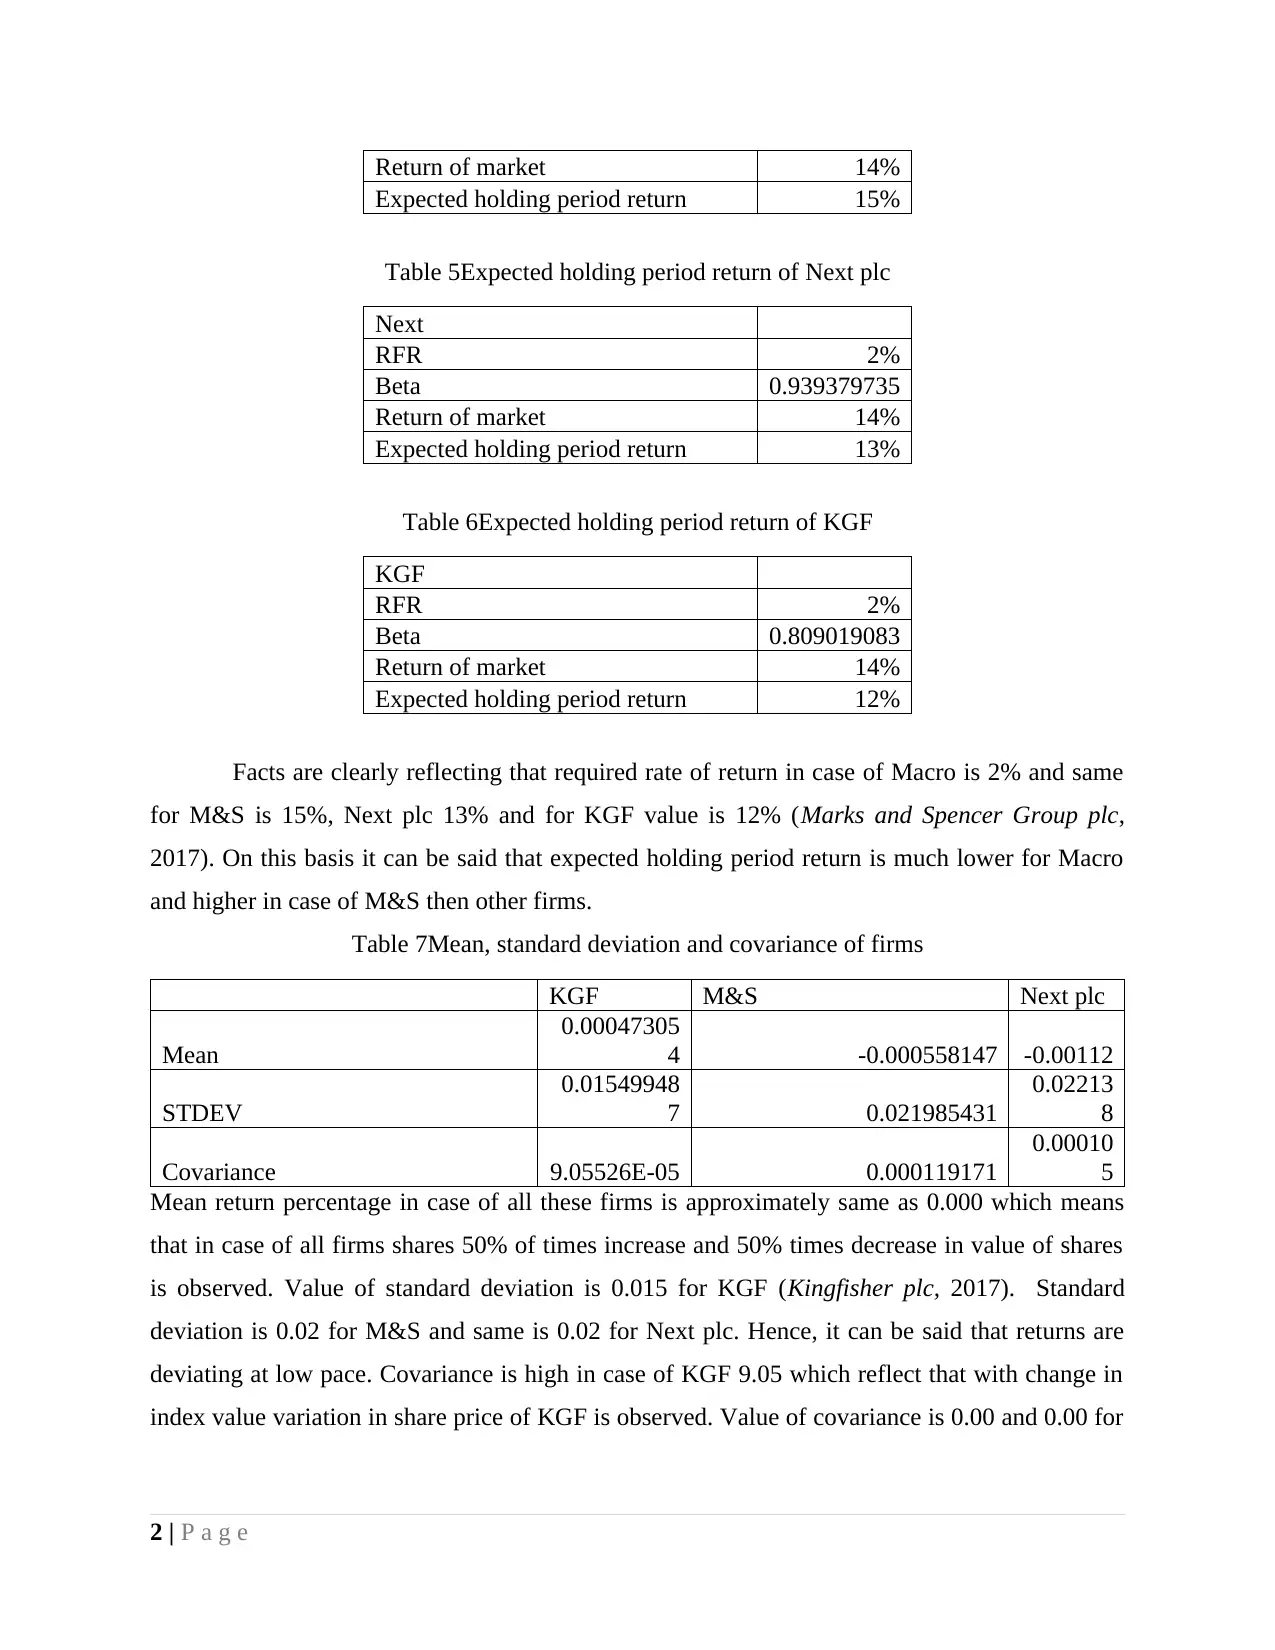
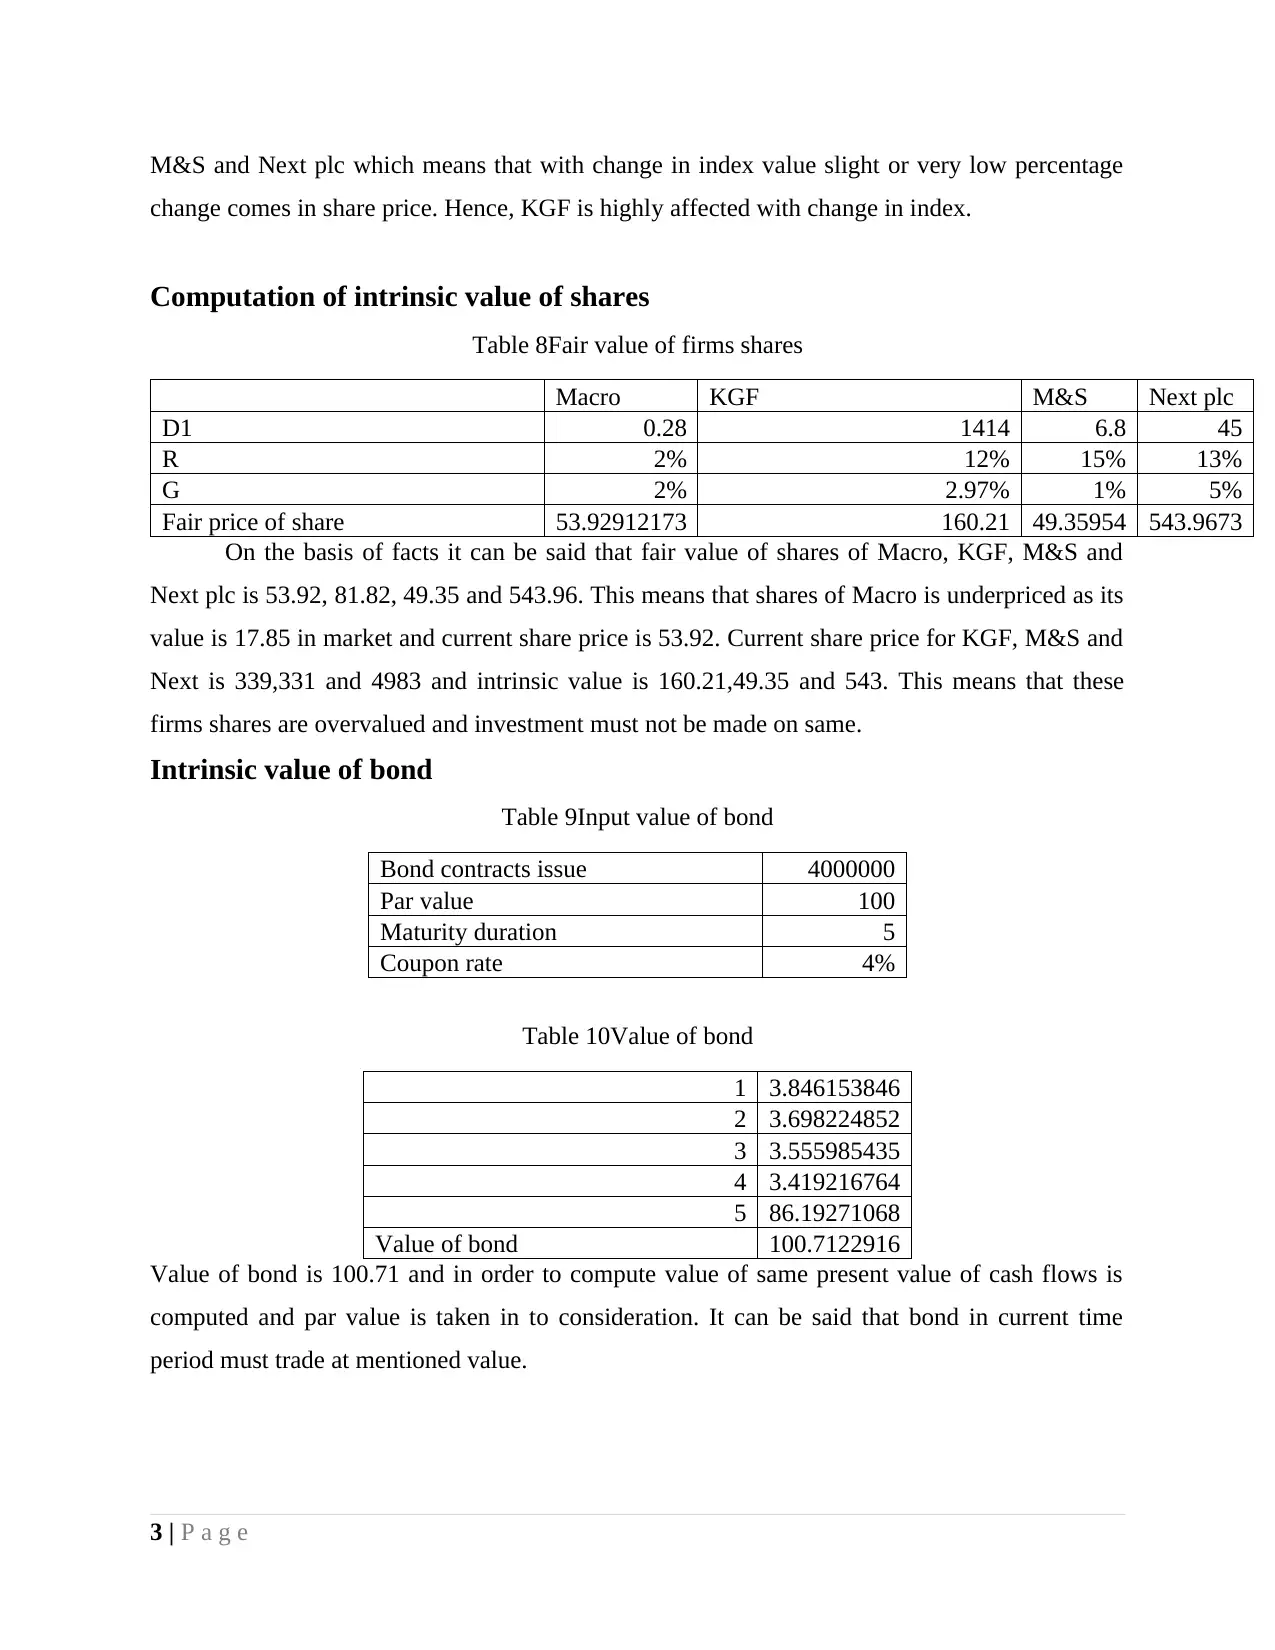
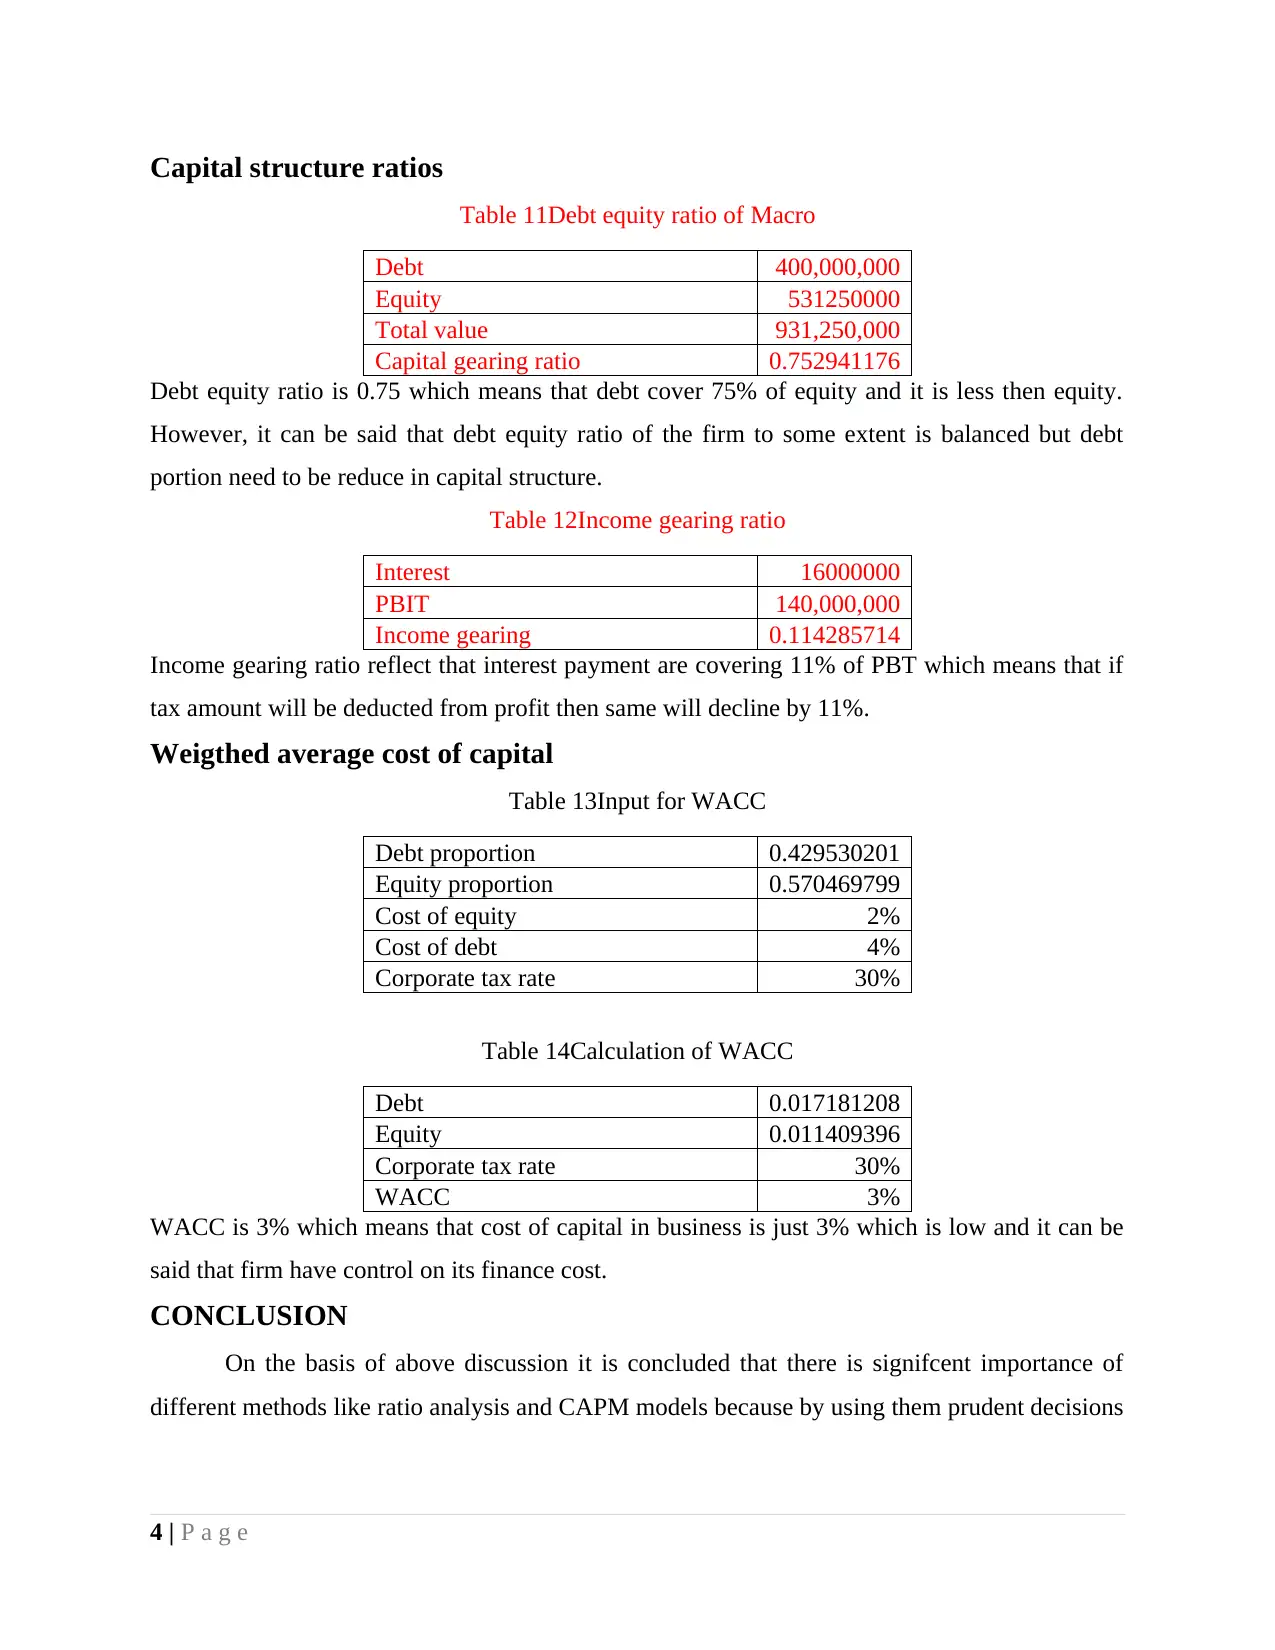
This case study provides a comprehensive financial analysis of Macro and its peer firms, examining key performance indicators and financial ratios. The analysis includes a comparison of profit after tax, expected holding period returns, and intrinsic share values. The study delves into the computat...

FINANCE CASE STUDY
Secure Best Marks with AI Grader
Need help grading? Try our AI Grader for instant feedback on your assignments.

TABLE OF CONTENTS
EXECUTIVE SUMMARY.............................................................................................................1
Comparison of profit of firms..........................................................................................................1
Computation of intrinsic value of shares.........................................................................................3
Intrinsic value of bond.....................................................................................................................3
Capital structure ratios.....................................................................................................................4
Weigthed average cost of capital.....................................................................................................4
CONCLUSION................................................................................................................................4
REFERENCES................................................................................................................................6
Table 1Net profit after tax for Macro..............................................................................................1
Table 2Profit after tax comparison of firms....................................................................................1
Table 3Expected holding period return of Macro............................................................................1
Table 4Expected holding period return of M&S.............................................................................1
Table 5Expected holding period return of Next plc........................................................................2
Table 6Expected holding period return of KGF..............................................................................2
Table 7Mean, standard deviation and covariance of firms..............................................................2
Table 8Fair value of firms shares....................................................................................................3
Table 9Input value of bond..............................................................................................................3
Table 10Value of bond....................................................................................................................3
Table 11Debt equity ratio of Macro................................................................................................4
Table 12Income gearing ratio..........................................................................................................4
Table 13Input for WACC................................................................................................................4
Table 14Calculation of WACC.......................................................................................................4

EXECUTIVE SUMMARY
This report examines the performance of the Macro and other firms in terms of varied
parameters. Report main findings are that profit after tax valued at 98000000 and it is earning
very less amount of profit in its business relative to peer firms. Low rate of return is expected to
be earned on Macro then other peer firms. However, shares of Macro are underpriced but more
affected by slight change in index. It is also identified that firm needs to restructure its capital
and need to reduce portion of debt in capital structure.
Comparison of profit of firms
Table 1Net profit after tax for Macro
PBIT 140000000
Corporate tax rate 0.3
Tax amount 42000000
Profit after tax 98000000
Net profit after tax value is 98,000,000 and in this regard corporate tax percentage value
is subtracted from profit before income tax and by doing so profit after tax is computed in the
report (Next plc, 2017).
Table 2Profit after tax comparison of firms
Macro KGF M&S Next plc
PAT 98000000 610,000,000 117,000,000 635,000,000
It can be observed from the table give above that profit after tax is high in case of next
plc and KGF. Apart from ths, in case of Macro and M&S profit value is 98 million and same is
117 million in case of these firms. It can be said that Next plc and KGF are much profitable then
other firms.
Table 3Expected holding period return of Macro
RFR 2%
Beta 0.0016
Return of market 14%
Expected holding period return 2%
Table 4Expected holding period return of M&S
M&S
RFR 2%
Beta 1.064705376
1 | P a g e

Return of market 14%
Expected holding period return 15%
Table 5Expected holding period return of Next plc
Next
RFR 2%
Beta 0.939379735
Return of market 14%
Expected holding period return 13%
Table 6Expected holding period return of KGF
KGF
RFR 2%
Beta 0.809019083
Return of market 14%
Expected holding period return 12%
Facts are clearly reflecting that required rate of return in case of Macro is 2% and same
for M&S is 15%, Next plc 13% and for KGF value is 12% (Marks and Spencer Group plc,
2017). On this basis it can be said that expected holding period return is much lower for Macro
and higher in case of M&S then other firms.
Table 7Mean, standard deviation and covariance of firms
KGF M&S Next plc
Mean
0.00047305
4 -0.000558147 -0.00112
STDEV
0.01549948
7 0.021985431
0.02213
8
Covariance 9.05526E-05 0.000119171
0.00010
5
Mean return percentage in case of all these firms is approximately same as 0.000 which means
that in case of all firms shares 50% of times increase and 50% times decrease in value of shares
is observed. Value of standard deviation is 0.015 for KGF (Kingfisher plc, 2017). Standard
deviation is 0.02 for M&S and same is 0.02 for Next plc. Hence, it can be said that returns are
deviating at low pace. Covariance is high in case of KGF 9.05 which reflect that with change in
index value variation in share price of KGF is observed. Value of covariance is 0.00 and 0.00 for
2 | P a g e
Secure Best Marks with AI Grader
Need help grading? Try our AI Grader for instant feedback on your assignments.

M&S and Next plc which means that with change in index value slight or very low percentage
change comes in share price. Hence, KGF is highly affected with change in index.
Computation of intrinsic value of shares
Table 8Fair value of firms shares
Macro KGF M&S Next plc
D1 0.28 1414 6.8 45
R 2% 12% 15% 13%
G 2% 2.97% 1% 5%
Fair price of share 53.92912173 160.21 49.35954 543.9673
On the basis of facts it can be said that fair value of shares of Macro, KGF, M&S and
Next plc is 53.92, 81.82, 49.35 and 543.96. This means that shares of Macro is underpriced as its
value is 17.85 in market and current share price is 53.92. Current share price for KGF, M&S and
Next is 339,331 and 4983 and intrinsic value is 160.21,49.35 and 543. This means that these
firms shares are overvalued and investment must not be made on same.
Intrinsic value of bond
Table 9Input value of bond
Bond contracts issue 4000000
Par value 100
Maturity duration 5
Coupon rate 4%
Table 10Value of bond
1 3.846153846
2 3.698224852
3 3.555985435
4 3.419216764
5 86.19271068
Value of bond 100.7122916
Value of bond is 100.71 and in order to compute value of same present value of cash flows is
computed and par value is taken in to consideration. It can be said that bond in current time
period must trade at mentioned value.
3 | P a g e

Capital structure ratios
Table 11Debt equity ratio of Macro
Debt 400,000,000
Equity 531250000
Total value 931,250,000
Capital gearing ratio 0.752941176
Debt equity ratio is 0.75 which means that debt cover 75% of equity and it is less then equity.
However, it can be said that debt equity ratio of the firm to some extent is balanced but debt
portion need to be reduce in capital structure.
Table 12Income gearing ratio
Interest 16000000
PBIT 140,000,000
Income gearing 0.114285714
Income gearing ratio reflect that interest payment are covering 11% of PBT which means that if
tax amount will be deducted from profit then same will decline by 11%.
Weigthed average cost of capital
Table 13Input for WACC
Debt proportion 0.429530201
Equity proportion 0.570469799
Cost of equity 2%
Cost of debt 4%
Corporate tax rate 30%
Table 14Calculation of WACC
Debt 0.017181208
Equity 0.011409396
Corporate tax rate 30%
WACC 3%
WACC is 3% which means that cost of capital in business is just 3% which is low and it can be
said that firm have control on its finance cost.
CONCLUSION
On the basis of above discussion it is concluded that there is signifcent importance of
different methods like ratio analysis and CAPM models because by using them prudent decisions
4 | P a g e

can be taken in respect to investment in any business firm. Thus, investors must widely use these
methods to make decisions.
5 | P a g e
methods to make decisions.
5 | P a g e
Paraphrase This Document
Need a fresh take? Get an instant paraphrase of this document with our AI Paraphraser

REFERENCES
Online
Kingfisher plc, 2017. [Online]. Available through:<
https://in.finance.yahoo.com/quote/KGF.L/financials?p=KGF.L>.
Marks and Spencer Group plc, 2017. [Online]. Available through:<
https://finance.yahoo.com/quote/MKS.L/history?
period1=1451500200&period2=1483122600&interval=1d&filter=history&frequency=1d>.
Next plc, 2017. [Online]. Available through:<
https://uk.finance.yahoo.com/quote/NXT.L/history?
period1=1451500200&period2=1483122600&interval=1d&filter=history&frequency=1d>.
6 | P a g e
1 out of 8
Related Documents

Your All-in-One AI-Powered Toolkit for Academic Success.
+13062052269
info@desklib.com
Available 24*7 on WhatsApp / Email
Unlock your academic potential
© 2024 | Zucol Services PVT LTD | All rights reserved.