MG5556 Financial Analysis, Management and Valuation Report
VerifiedAdded on 2022/12/06
|13
|3988
|52
Report
AI Summary
This report, prepared for the MG5556 Financial Resources Management module at Brunel Business School, presents a comprehensive financial analysis of two companies, Next PLC and Marks and Spencer, using data from 2019 and 2020. The report begins with an executive summary and introduction, outlining the objectives, methodology, and structure of the analysis. It then delves into a detailed examination of financial statements, employing various financial ratios to assess profitability, efficiency, shareholder investment, liquidity, and gearing. The analysis includes comparisons of key metrics such as gross profit margin, net profit margin, working capital turnover, dividend payout ratio, and current ratio. Furthermore, the report explores investment appraisal methods, discussing their application in the UK by large companies. Finally, it investigates valuation methods used by investment analysts, particularly focusing on the Gordon Dividend Growth Model and the Capital Asset Pricing Model (CAPM) to determine share value, concluding with a summary of findings and references. The analysis aims to provide insights into the financial health and performance of the selected companies, aiding in understanding their investment strategies and shareholder value creation.

MG 5556 Financial
Resources Management
Resources Management
Paraphrase This Document
Need a fresh take? Get an instant paraphrase of this document with our AI Paraphraser
EXECUTIVE SUMMARY
Financial Resource Management (FRM) is a system for concurrently managing cash, liquidity,
sales, expenses, and uncertainties, which are the five “core” financial tools. Even so, a more
comprehensive view of financial capital has increasingly gained any traction ever since.
Financial managers should aim to optimise shareholders capital by dividend payments and/or
increasing the stock valuation.

Contents
EXECUTIVE SUMMARY.........................................................................................................................3
PART ONE.................................................................................................................................................5
INTRODUCTION.......................................................................................................................................5
Report Objective..........................................................................................................................................6
Methodology...............................................................................................................................................6
Analysis and discussion...............................................................................................................................7
Part Two....................................................................................................................................................10
Summaries of investment appraisal methods.........................................................................................10
PART THREE...........................................................................................................................................12
Valuation methods used by investment analysts to value the share of the company..............................12
CONCLUSION.........................................................................................................................................13
REFERENCES..........................................................................................................................................14
⊘ This is a preview!⊘
Do you want full access?
Subscribe today to unlock all pages.
Trusted by 1+ million students worldwide
PART ONE
INTRODUCTION
The study of financial statements is a method for evaluating and analyzes the financial reports of
an enterprise in order to build improving trade income choices and decisions for expected
income. In assessing a company's liquid financial situation, the financial accounts are analyzed in
a manner that shows how the company prepares and coordination of its cash flow, the loss and
profits are taken into account. The comparison of data from the past and predicted values reveals
that the corporation takes most of the steps needed for potential contractual commitments in
financial activities and the suggestion on the way a company is paying its present liabilities. The
comparison of historical data and projected values reveals a significant change in financial
activity, such that the corporation takes the requisite steps in relation to future financial
commitments, proposes how existing liabilities are compensated, how a debt is paid back, the
substitution of fixed assets and the decision on a corresponding capital expenditure (Ying,
Hassan and Ahmad, 2019).
Financial ratios assess the financial and use details of a business to compare its activities. Parties
such as customers, loaners, employers, public authorities, workers and their different rivals use
financial percentages as comparisons of power and power. The study, nevertheless, has a certain
gap which hinders their efficacy. This discrepancy involves income reports that are presented
mainly in aggregate fashion, relying on personal estimates, diverse forecasting procedures and
strategies, and the dependence on the historical evidence collected to forecast the potential
valuation of the company. Two organizations will take account of this report.
The Next Plc supermarket chain, founded in Leicestershire in 1982, is a UK-based company that
manufactures trendy clothing, boards and household products, later on. Currently Next Plc is one
of the largest shops in Great Britain and Eire with over 500 and almost 200 stores in other
nations. Moreover, it managed to raise £100 million in 1998 over the next loan funding period.
Marks and Spencer, launched in 1884 is one of the leading supermarket chains in England and is
the rival of Next Plc. It is one in the previous studies showed in England that does not rely upon
Paraphrase This Document
Need a fresh take? Get an instant paraphrase of this document with our AI Paraphraser
the clothes for citizens but also offers a wide range of foodstuffs along with home furnishings
e.g. furniture, which has allowed them to grasp a greater market share. In 30 nations, M&S has
over 450 outlets.
Report Objective
The financial and investment options of a company are vital to managers' conducting their
operations and achieving a definite goal of management. To emphasize and understand monetary
management with a clear end target. The study evaluates Next Plc's cash performance and role,
as seen in FTSE 350. Money planning is of importance to businesses because it lets managers
decide more and assess the company's present and potential success by financial instruments
(Gudjonsson and et.al, 2020).
It is therefore necessary to consider the financial instruments to show Next Plc's profitability
relative to Marks and Spencer (M&S).
Methodology
Financial ratios are the instruments used by management to assess the efficiency of the enterprise
and make comparisons across an industrial sector in decision-making. When calculating these
ratios, administrators would be able to use them more to demonstrate the company's strengths
and disadvantages and therefore set targets for developing plans to operate the business
successfully and efficiently. Therefore, financial ratios for 2019 and 2020 are determined in
order to consider Next Plc's results. These two year averages are calculated to determine whether
it has been able to increase its efficiency relative to 2019. These ratios between these two years
are calculated to determine whether the corporation has been capable in comparison to 2019, of
improving its results. Marks and Spencer are also selected and percentages for Next Plc are
calculated for this business for the same two year periods 2019 and 2020. More importantly, the
analysis of the ratios shows which business did well. Estimation takes a crucial role in
determining whether the corporation makes profit or lose a vital portion of the overall
speculation return, to decide the worth of the company. To this end, the growth assessment
model of Gordon Dividend is selected for the Next Plc evaluation.
We take the distribution, the dividend rate of growth and the cost of the shares to determine this
dividend growth formula for the next year. We will use the profit retention model to measure the
dividend growth model, and similarly, we will use the capital asset valuation model to obtain the
share price (Oláh and et.al, 2019).
Analysis and discussion
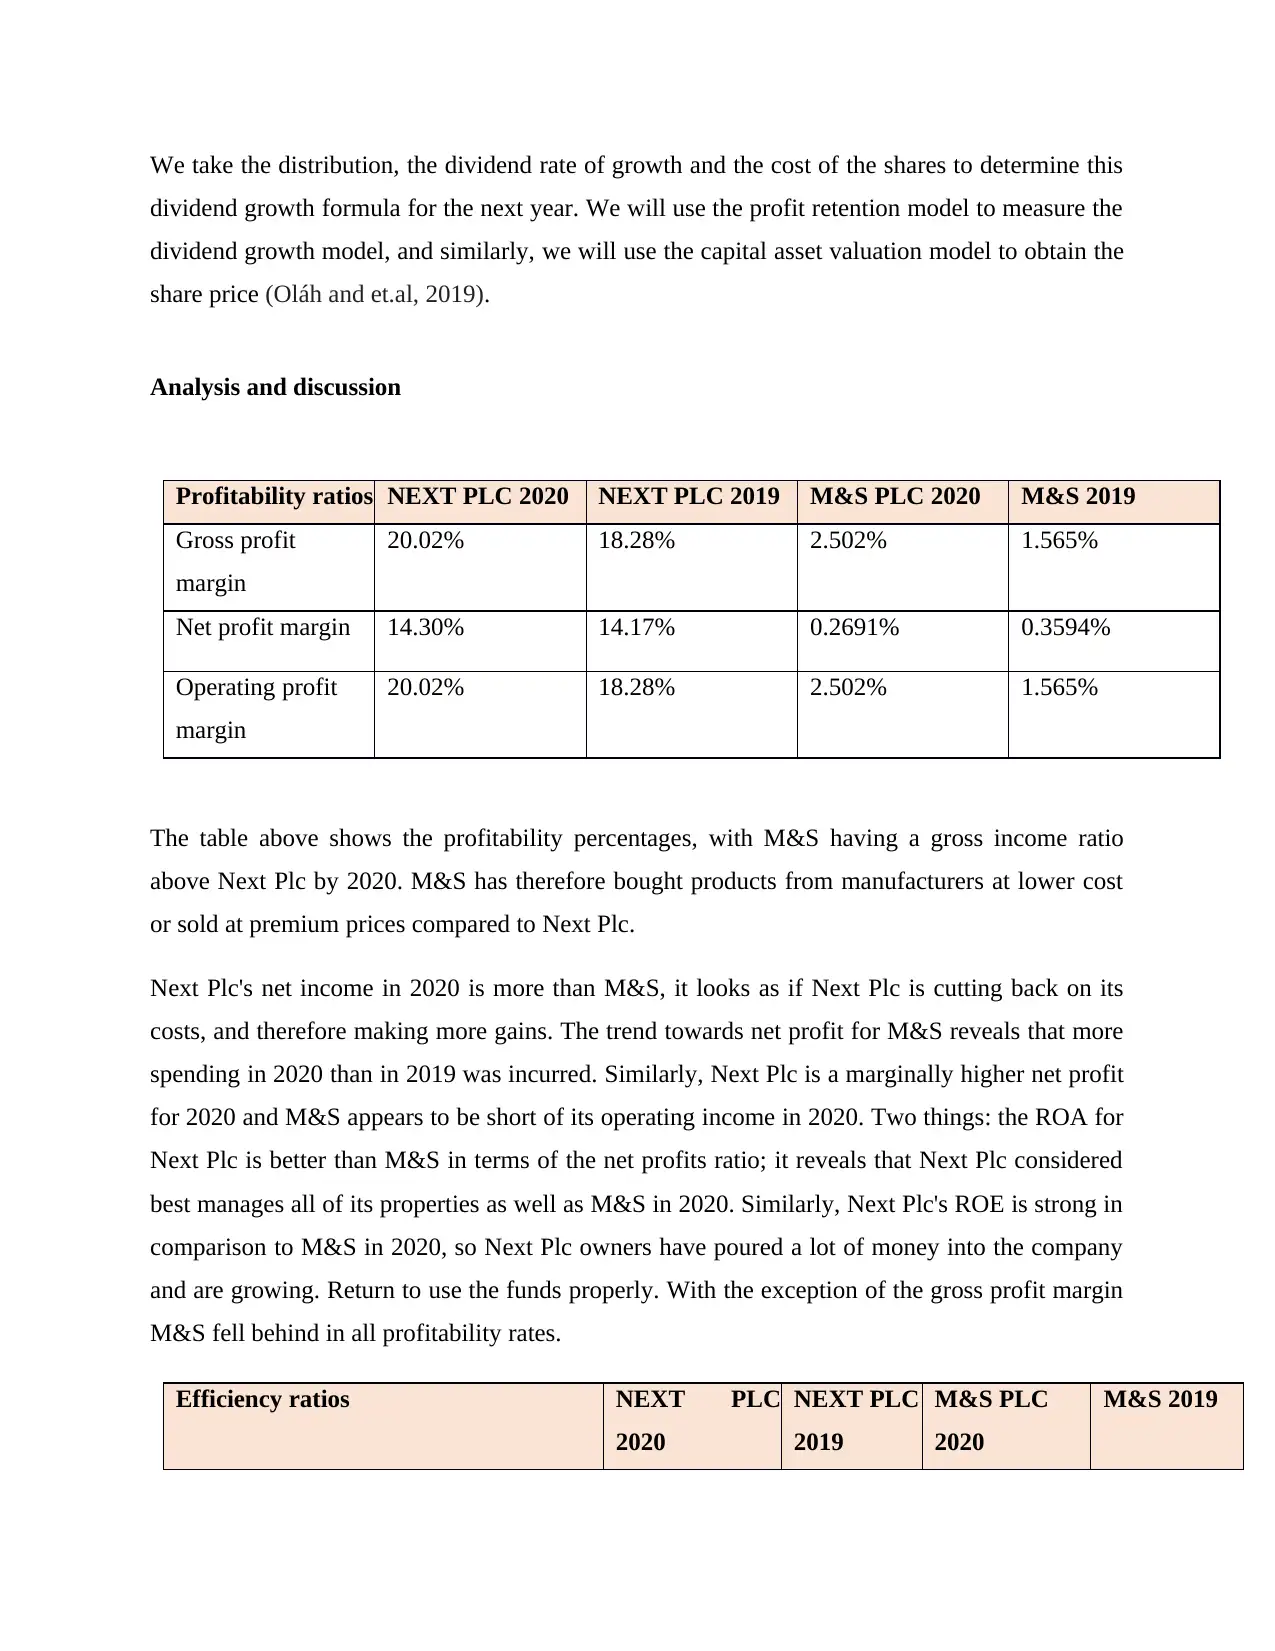
Profitability ratios NEXT PLC 2020 NEXT PLC 2019 M&S PLC 2020 M&S 2019
Gross profit
margin
20.02% 18.28% 2.502% 1.565%
Net profit margin 14.30% 14.17% 0.2691% 0.3594%
Operating profit
margin
20.02% 18.28% 2.502% 1.565%
The table above shows the profitability percentages, with M&S having a gross income ratio
above Next Plc by 2020. M&S has therefore bought products from manufacturers at lower cost
or sold at premium prices compared to Next Plc.
Next Plc's net income in 2020 is more than M&S, it looks as if Next Plc is cutting back on its
costs, and therefore making more gains. The trend towards net profit for M&S reveals that more
spending in 2020 than in 2019 was incurred. Similarly, Next Plc is a marginally higher net profit
for 2020 and M&S appears to be short of its operating income in 2020. Two things: the ROA for
Next Plc is better than M&S in terms of the net profits ratio; it reveals that Next Plc considered
best manages all of its properties as well as M&S in 2020. Similarly, Next Plc's ROE is strong in
comparison to M&S in 2020, so Next Plc owners have poured a lot of money into the company
and are growing. Return to use the funds properly. With the exception of the gross profit margin
M&S fell behind in all profitability rates.
Efficiency ratios NEXT PLC
2020
NEXT PLC
2019
M&S PLC
2020
M&S 2019
dividend growth formula for the next year. We will use the profit retention model to measure the
dividend growth model, and similarly, we will use the capital asset valuation model to obtain the
share price (Oláh and et.al, 2019).
Analysis and discussion
Profitability ratios NEXT PLC 2020 NEXT PLC 2019 M&S PLC 2020 M&S 2019
Gross profit
margin
20.02% 18.28% 2.502% 1.565%
Net profit margin 14.30% 14.17% 0.2691% 0.3594%
Operating profit
margin
20.02% 18.28% 2.502% 1.565%
The table above shows the profitability percentages, with M&S having a gross income ratio
above Next Plc by 2020. M&S has therefore bought products from manufacturers at lower cost
or sold at premium prices compared to Next Plc.
Next Plc's net income in 2020 is more than M&S, it looks as if Next Plc is cutting back on its
costs, and therefore making more gains. The trend towards net profit for M&S reveals that more
spending in 2020 than in 2019 was incurred. Similarly, Next Plc is a marginally higher net profit
for 2020 and M&S appears to be short of its operating income in 2020. Two things: the ROA for
Next Plc is better than M&S in terms of the net profits ratio; it reveals that Next Plc considered
best manages all of its properties as well as M&S in 2020. Similarly, Next Plc's ROE is strong in
comparison to M&S in 2020, so Next Plc owners have poured a lot of money into the company
and are growing. Return to use the funds properly. With the exception of the gross profit margin
M&S fell behind in all profitability rates.
Efficiency ratios NEXT PLC
2020
NEXT PLC
2019
M&S PLC
2020
M&S 2019
⊘ This is a preview!⊘
Do you want full access?
Subscribe today to unlock all pages.
Trusted by 1+ million students worldwide
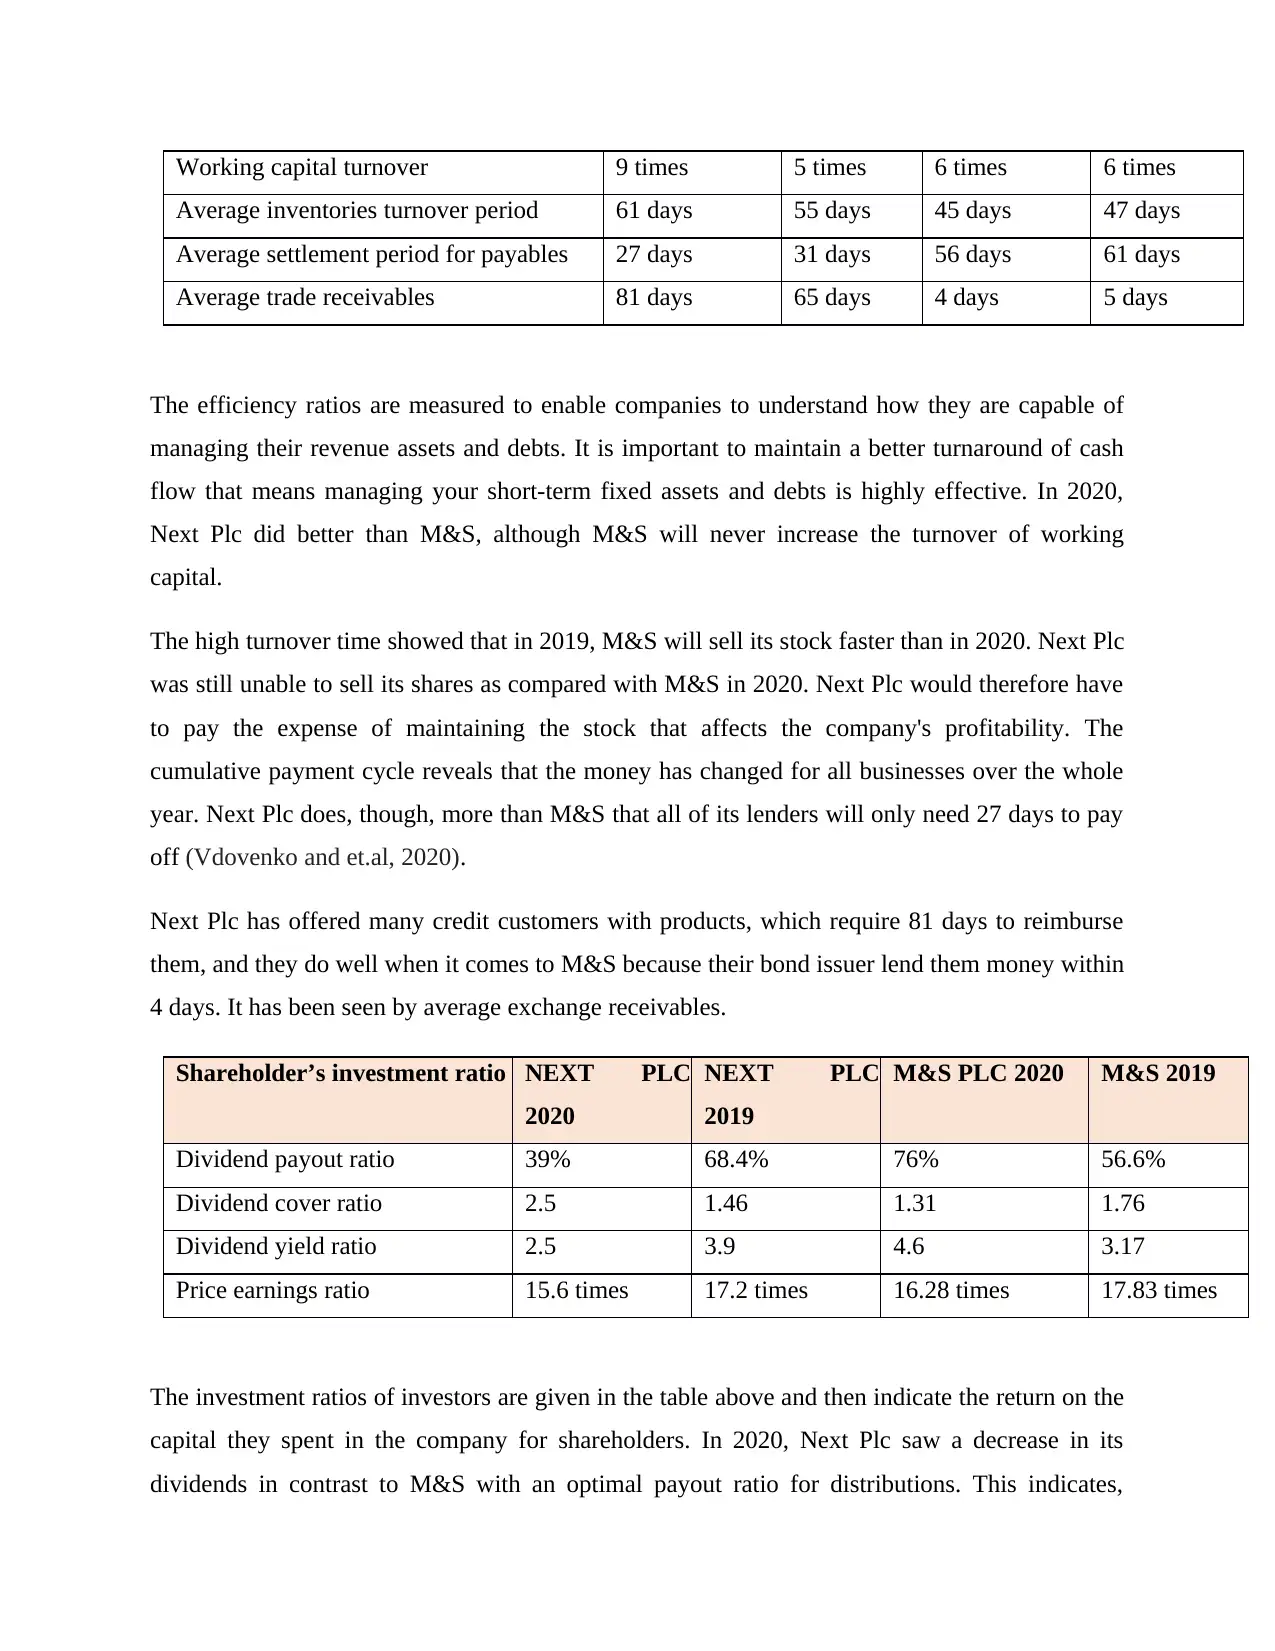
Working capital turnover 9 times 5 times 6 times 6 times
Average inventories turnover period 61 days 55 days 45 days 47 days
Average settlement period for payables 27 days 31 days 56 days 61 days
Average trade receivables 81 days 65 days 4 days 5 days
The efficiency ratios are measured to enable companies to understand how they are capable of
managing their revenue assets and debts. It is important to maintain a better turnaround of cash
flow that means managing your short-term fixed assets and debts is highly effective. In 2020,
Next Plc did better than M&S, although M&S will never increase the turnover of working
capital.
The high turnover time showed that in 2019, M&S will sell its stock faster than in 2020. Next Plc
was still unable to sell its shares as compared with M&S in 2020. Next Plc would therefore have
to pay the expense of maintaining the stock that affects the company's profitability. The
cumulative payment cycle reveals that the money has changed for all businesses over the whole
year. Next Plc does, though, more than M&S that all of its lenders will only need 27 days to pay
off (Vdovenko and et.al, 2020).
Next Plc has offered many credit customers with products, which require 81 days to reimburse
them, and they do well when it comes to M&S because their bond issuer lend them money within
4 days. It has been seen by average exchange receivables.
Shareholder’s investment ratio NEXT PLC
2020
NEXT PLC
2019
M&S PLC 2020 M&S 2019
Dividend payout ratio 39% 68.4% 76% 56.6%
Dividend cover ratio 2.5 1.46 1.31 1.76
Dividend yield ratio 2.5 3.9 4.6 3.17
Price earnings ratio 15.6 times 17.2 times 16.28 times 17.83 times
The investment ratios of investors are given in the table above and then indicate the return on the
capital they spent in the company for shareholders. In 2020, Next Plc saw a decrease in its
dividends in contrast to M&S with an optimal payout ratio for distributions. This indicates,
Paraphrase This Document
Need a fresh take? Get an instant paraphrase of this document with our AI Paraphraser
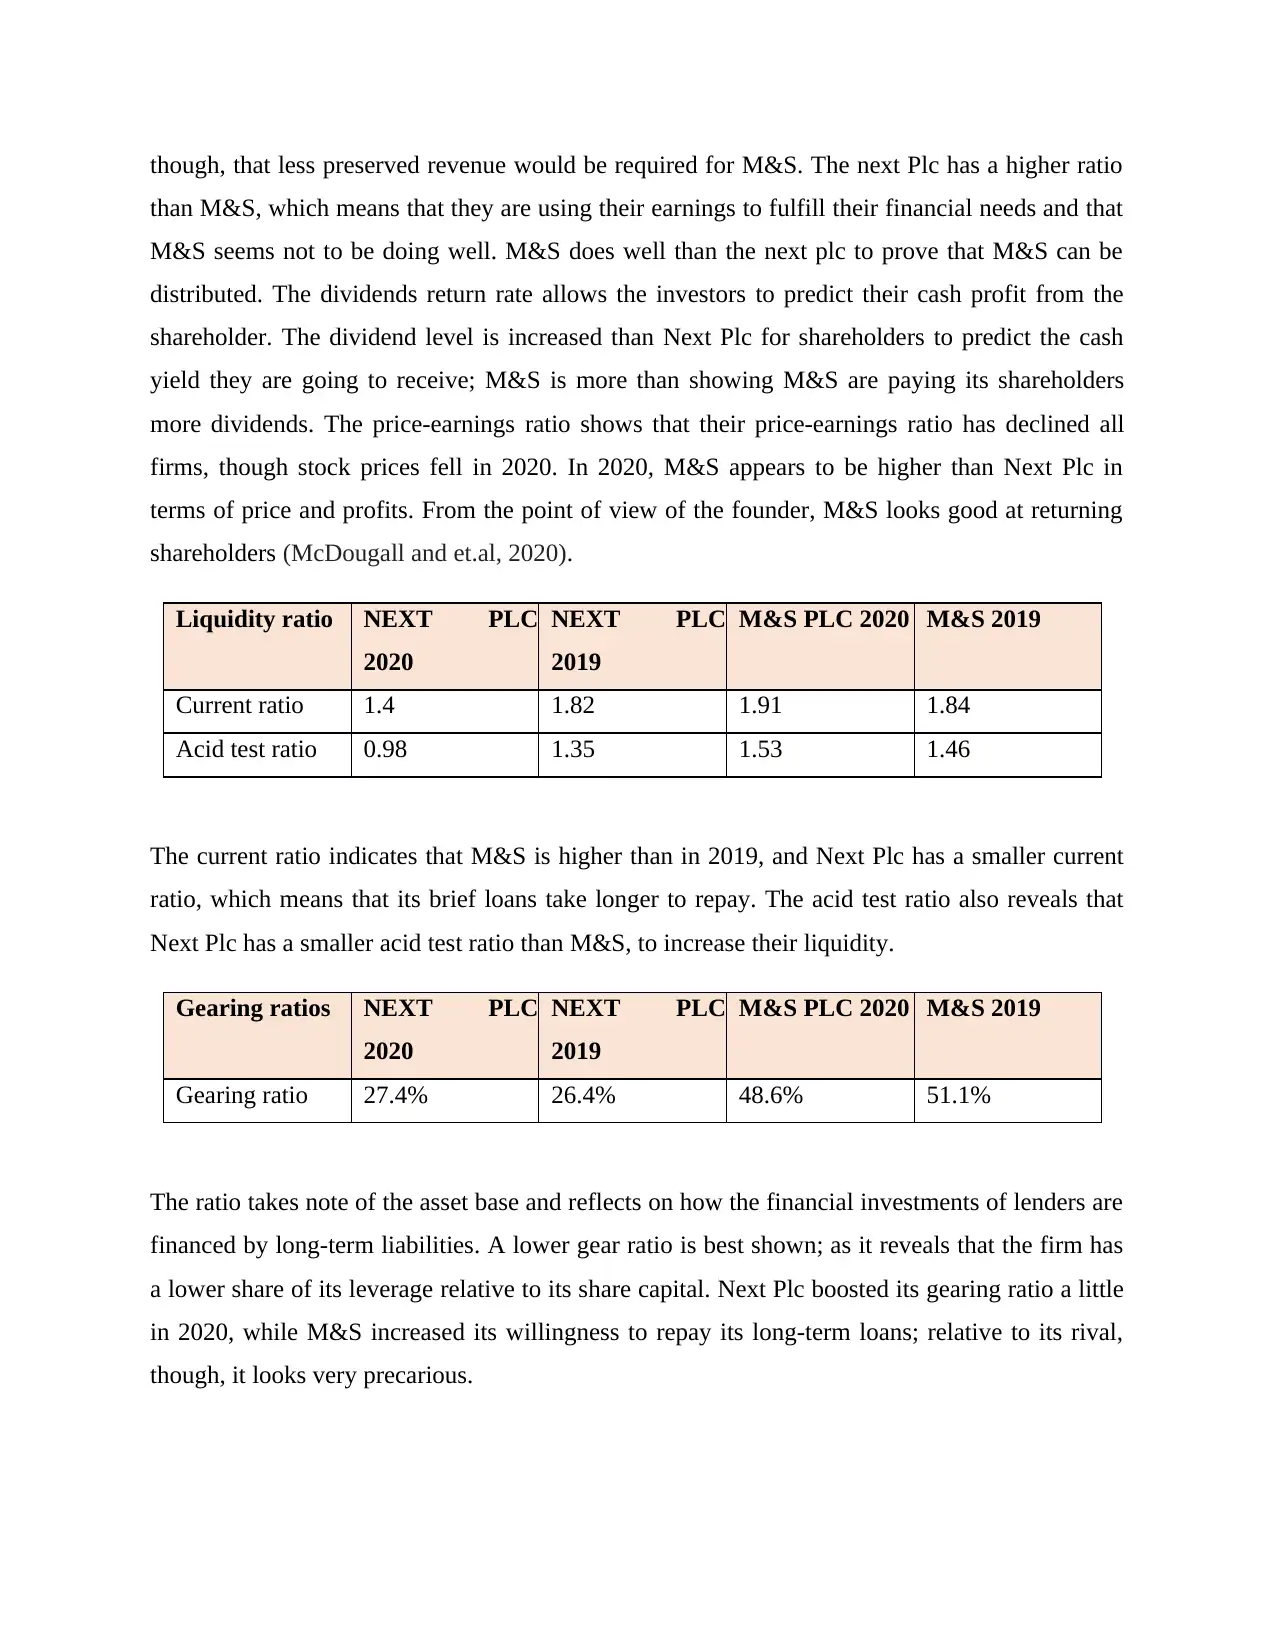
though, that less preserved revenue would be required for M&S. The next Plc has a higher ratio
than M&S, which means that they are using their earnings to fulfill their financial needs and that
M&S seems not to be doing well. M&S does well than the next plc to prove that M&S can be
distributed. The dividends return rate allows the investors to predict their cash profit from the
shareholder. The dividend level is increased than Next Plc for shareholders to predict the cash
yield they are going to receive; M&S is more than showing M&S are paying its shareholders
more dividends. The price-earnings ratio shows that their price-earnings ratio has declined all
firms, though stock prices fell in 2020. In 2020, M&S appears to be higher than Next Plc in
terms of price and profits. From the point of view of the founder, M&S looks good at returning
shareholders (McDougall and et.al, 2020).
Liquidity ratio NEXT PLC
2020
NEXT PLC
2019
M&S PLC 2020 M&S 2019
Current ratio 1.4 1.82 1.91 1.84
Acid test ratio 0.98 1.35 1.53 1.46
The current ratio indicates that M&S is higher than in 2019, and Next Plc has a smaller current
ratio, which means that its brief loans take longer to repay. The acid test ratio also reveals that
Next Plc has a smaller acid test ratio than M&S, to increase their liquidity.
Gearing ratios NEXT PLC
2020
NEXT PLC
2019
M&S PLC 2020 M&S 2019
Gearing ratio 27.4% 26.4% 48.6% 51.1%
The ratio takes note of the asset base and reflects on how the financial investments of lenders are
financed by long-term liabilities. A lower gear ratio is best shown; as it reveals that the firm has
a lower share of its leverage relative to its share capital. Next Plc boosted its gearing ratio a little
in 2020, while M&S increased its willingness to repay its long-term loans; relative to its rival,
though, it looks very precarious.
Part Two
Summaries of investment appraisal methods
According to Peter Atrill, Investment Appraisal methods (NPV and IRR) show a steady
increase in usage over time. Such as, Payback, accounting cost of return, and the discounted cash
flow approaches of net present value (NPV) and intrinsic rate of return are both used in equity
valuation (IRR) are methods of investment apprasal. Investment choices are critical for a
company because they determine the organization's potential viability and development. The
primary goal of a company is to maximize the profits of its owners. As a result, a company
would invest in each venture which is valued more than all the expenses. The disparity between
the project's worth and its expenses is the Net Present Value. To companies wishing, an
investment is needed in ventures with favorable net present values (NPVs).
Net present value: The firm's goal is to make money by producing products and services
utilizing current and potential capital. In order to generate income, inflows must be larger than
the amount of all expected cash outflows. The net present value of a capital spending project is
calculated by discounting both revenue outflows and capital flows attributed to the venture by
either a defined amount, such as the individual's cost of equity. The formula calculates the yield
by discounting the investment's net cash flows by the basic minimum rate of return and
subtracting the original cost. The project is appropriate if the return is favourable. Whether it's
disappointing, the idea won't be willing to spend for itself, because it'll be rejected (Solikin and
et.al, 2019). The process of estimating the current cost is represented as "discounting," and the
parameters from which the capital expenditures have been compounded are recognized as
"discount factors."
Advantage:
It is founded on the premise that cash flows, and therefore distributions, decide the equity
of owners.
Incomes are objective, but cash flows are not.
It understands the concept of money's time worth (Cihon and et.al, 2019).
It calls the overall gains resulting from initiatives over the course of its life.
⊘ This is a preview!⊘
Do you want full access?
Subscribe today to unlock all pages.
Trusted by 1+ million students worldwide
Because of the long period of time, the projected discount rate usually varies. By
changing the numerator, this rate can be used to calculate the NPV.
This type of leadership is effective for choosing projects that are mutually incompatible.
(When two variables are correlated incompatible, accepting one is equivalent to rejecting
another.)
Disadvantage:
(a) As opposed to the accounting rate of return system or the payback time method, it is more
complex to quantify and comprehend.
(b) Calculating the optimal rates of return poses significant challenges. In most cases, the cost of
capital is used to determine the optimal rate. Calculating the cost of money is a difficult task in
and of itself. In addition, target rates of return can fluctuate throughout the year.
(c) This is an absolute measurement process. When comparing two works, this approach would
benefit the project with the positive Return (Gopikumar and et.al, 2021).
Internal rate of return: The internal rate of return (IRR) is a percentage discount rate used during
capital spending evaluations that equalises the development's expense and potential financial
ratios. It's the rate of return that compares the present price of expected net cash flows to the
original investment. The IRR is also known as the rate where the net present value of an
investment is equal to zero. IRR is calculated using the bank loan rate or the potential cost of
financing to borrow, which is also known as the individual discounting rate or accounting rate.
The association seen between project's IRR (96) and the minimal reasonable rate of return is
used to determine the development's feasibility.
Advantage:
(a) It calculates the average value of capital.
(b) It takes net cash inflows and outflows into consideration.
(c) It is simpler to comprehend. For example, an investment portfolio IRR is 20% so it can
compare it to the expected return on investment.
Paraphrase This Document
Need a fresh take? Get an instant paraphrase of this document with our AI Paraphraser
Disadvantage:
(a) It does not use the idea of an optimal rate of return, instead using a rate of return that
indicates the viability of a capital budgeting.
(b) It necessitates time-consuming estimates dependent on the trial-and-error process.
(c) It generates a variety of rates, and may be misleading.
(d) Projects chosen mostly for their higher IRR may not be lucrative (Lee, 2019).
(e) Cashflows cannot be adequately assessed until the project's life can be accurately measured.
PART THREE
Valuation methods used by investment analysts to value the share of the company
The method of determining the value of a company's stock is known as equity valuation.
Share estimation is dependent on mathematical methods, and the value of a share can fluctuate
depending on consumer demand and availability. The share price of publically traded firms listed
can be accurately demonstrated. However, in the case of private firms where shares are not
globally recognized, equity assessment is extremely necessary and difficult.
The market-based strategy often uses similar public company share prices as well as
comparative private company asset or portfolio transactions. Private company information can be
used in a variety of specialized directories on the market. What's even more critical is how to
pick comparative companies – there are a number of factors to consider when doing so, including
the scope and volume of the market, sector, scale, financial status of industry averages, contains
information, and so on. While using the yield equation (expected rate of return on that
investment), there's many two related approaches that are discussed below:
Earning yield: The effective rate of return on an investor's investment is referred to as yield. It is
often measured as the percentage form. The Yield-Basis Method is named for the fact that it is
used to value shares based on their yield (Mantri, Shah and Thiruppathi, 2020). The estimated
earnings and the regular rate of return are used to value stocks. The following formula is used to
measure the worth per unit in this technique:
Expected rate of earning = Profit after tax / equity share paid up value *100
Value per share = Expected rate or earning / normal rate of return * paid up equity value
Dividend yield: The estimated dividend and the standard rate of return are used to value shares
in this process. The following equations are used to measure the worth per share:
Expected rate of return = (Profit available for dividend/paid up equity share capital) * 100
Yield method: Under the Net Asset Method, the investment's protection is assigned optimum
concentration. When it comes to investing in stocks, one must still be cautious. Security is still
considered, even though the return is poor. Around the same time, the yield approach focuses on
the return that an investor anticipates from his money. The yield is the potential return on an
investor’s holdings, including dividends, incentive shares, and corrects issue. If the yield is
higher, the share price would be higher as well. The estimated rate of return is compared to the
usual rate of return in this approach to determine the value of securities (Pickles, 2020).
CONCLUSION
As per the above report it has been concluded that the sources of funding from which
businesses receive the funds they will need finance their acquisitions, capital, and ongoing
operations. The mechanism whereby firms successfully control their different resources is known
as resource management. These resources may be invisible, such as people and time, or physical,
such as machinery, supplies, and money. It entails preparation to ensure that the appropriate
personnel are allocated to the appropriate activities. Individuals, programmers, machinery, and
materials all have plans and budgets to manage. There are calculating financial ratios of selected
company to analysis the financial performance of company. Along with analysis the investment
appraisal method that help in investment decision and these are, NPV and IRR. At the end of the
report know different methods of valuation of share in company.
⊘ This is a preview!⊘
Do you want full access?
Subscribe today to unlock all pages.
Trusted by 1+ million students worldwide
1 out of 13
Related Documents


Your All-in-One AI-Powered Toolkit for Academic Success.
+13062052269
info@desklib.com
Available 24*7 on WhatsApp / Email
![[object Object]](/_next/static/media/star-bottom.7253800d.svg)
Unlock your academic potential
Copyright © 2020–2026 A2Z Services. All Rights Reserved. Developed and managed by ZUCOL.