Financial Performance Evaluation of Marks and Spencer: A Report
VerifiedAdded on 2020/10/22
|17
|4082
|98
Report
AI Summary
This report provides a comprehensive analysis of Marks and Spencer's financial performance. It begins with a ratio analysis, comparing M&S to competitors like Tesco and Sainsbury, evaluating gross profit, net profit, current ratio, debt/equity ratio, and fixed asset turnover. The analysis reveals insights into M&S's profitability and financial health, highlighting areas for improvement. The report then explores Kaplan and Norton's Balanced Scorecard as a strategic management system, explaining its framework and application. It proposes a balanced scorecard specifically for Marks and Spencer, outlining critical success factors for the company's growth and success. The report concludes with a summary of the findings and recommendations for enhancing M&S's financial performance, emphasizing the importance of addressing liquidity issues while maintaining profitability. The document is contributed by a student to be published on the website Desklib.
FINANCIAL
PERFORMANCE
MANAGEMENT
PERFORMANCE
MANAGEMENT
Paraphrase This Document
Need a fresh take? Get an instant paraphrase of this document with our AI Paraphraser
Table of Contents
INTRODUCTION...........................................................................................................................3
QUESTION 1 ..................................................................................................................................3
Ratio analysis to evaluate the financial performance of Marks and Spencer.........................3
QUESTION 2 ..................................................................................................................................9
Kaplan and Norton’s Balanced Scorecard as a Strategic Management System.....................9
QUESTION 3 ................................................................................................................................12
Proposed balance scorecard for Marks and Spencer ...........................................................12
Critical success factors ........................................................................................................14
CONCLUSION .............................................................................................................................15
REFERENCES..............................................................................................................................16
INTRODUCTION
Financial performance management is elated to monitoring the performance of the
organisation on the basis of the financial data to enhance the performance and profitability of
firm. In this study, Marks and Spencer will be consider which is an international organisation
performing its operations indifferent regions. It is offering different products which consist of
clothing, home appliance and luxury food products. This assignment will provide information
about the ration analysis in order to evaluate the financial performance of the organisation.
Moreover, it will contain the information regarding the balance scorecard for measuring the
performance of the organisation to improve the performance for the growth and success of the
organisation. Furthermore, it will develop a balance scorecard for the company to include the
critical success factors of the organisation.
QUESTION 1
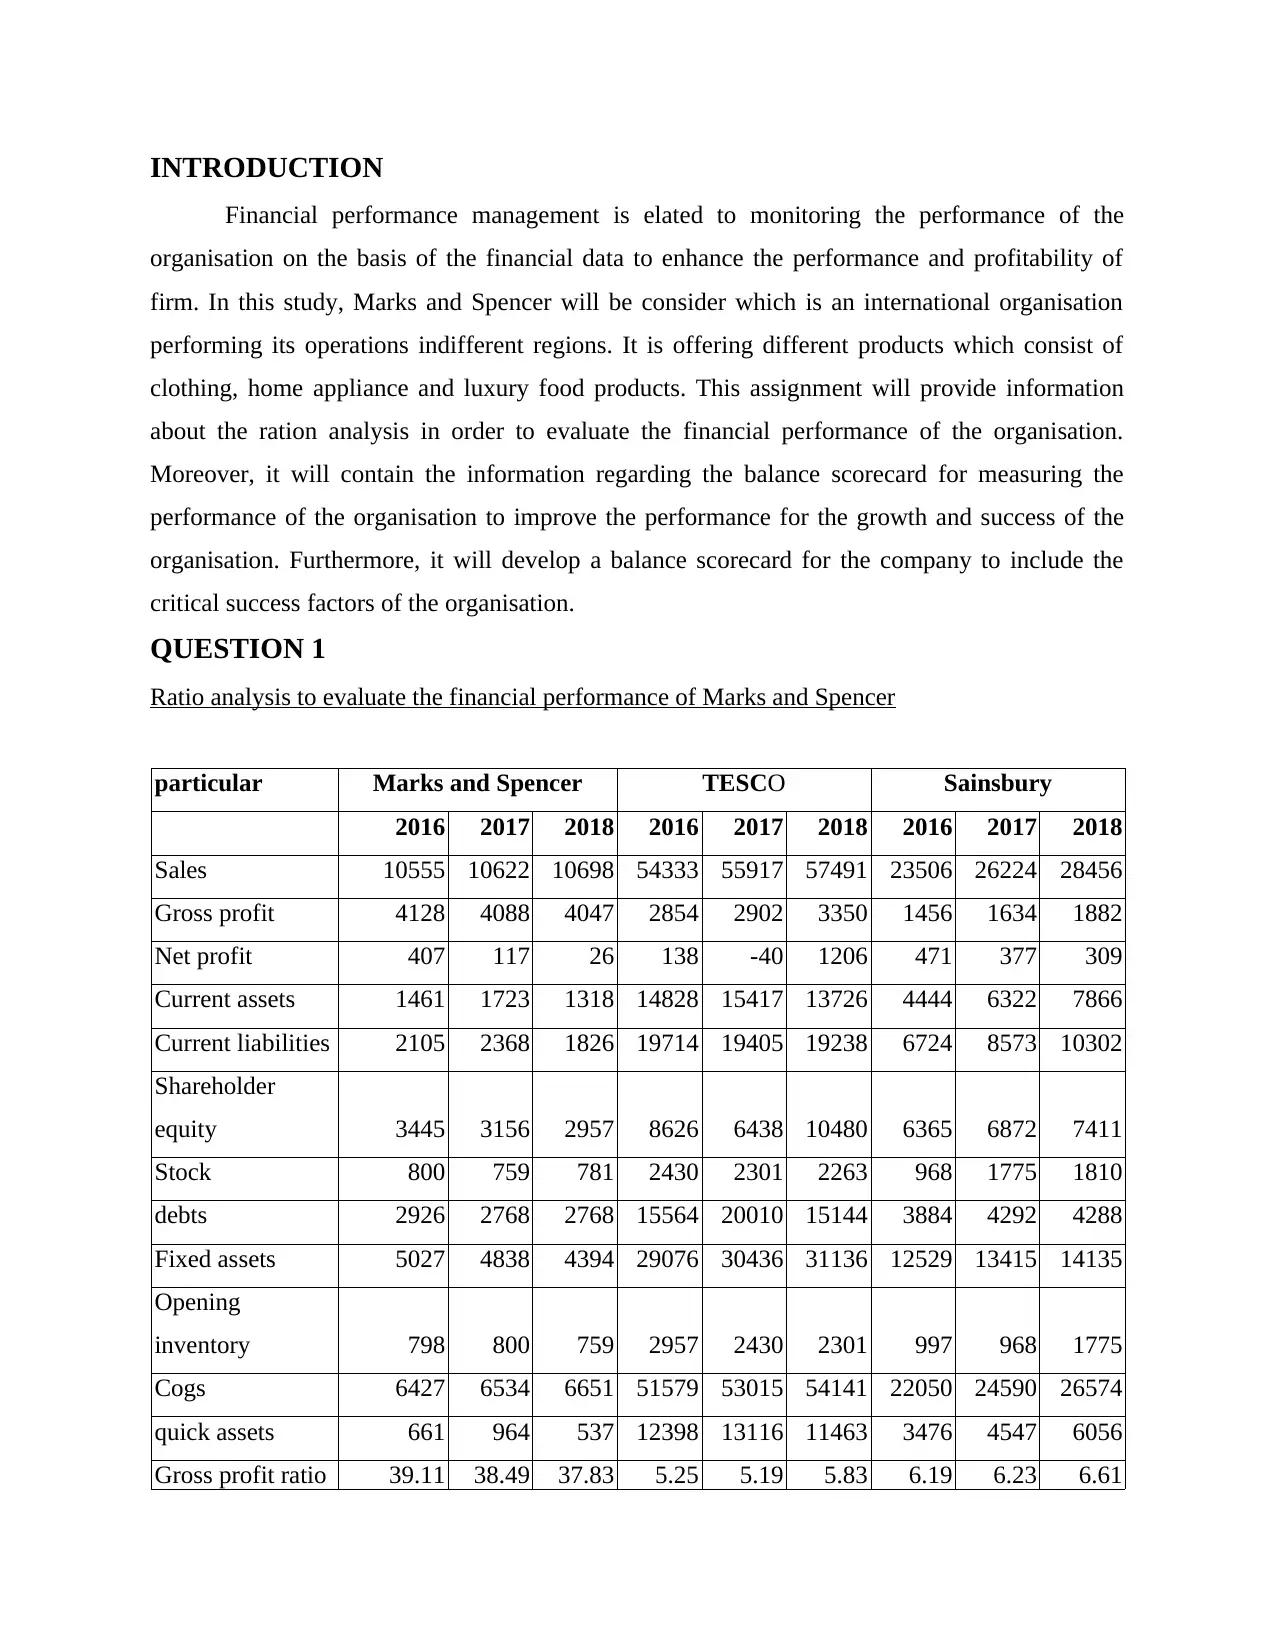
Ratio analysis to evaluate the financial performance of Marks and Spencer
particular Marks and Spencer TESCO Sainsbury
2016 2017 2018 2016 2017 2018 2016 2017 2018
Sales 10555 10622 10698 54333 55917 57491 23506 26224 28456
Gross profit 4128 4088 4047 2854 2902 3350 1456 1634 1882
Net profit 407 117 26 138 -40 1206 471 377 309
Current assets 1461 1723 1318 14828 15417 13726 4444 6322 7866
Current liabilities 2105 2368 1826 19714 19405 19238 6724 8573 10302
Shareholder
equity 3445 3156 2957 8626 6438 10480 6365 6872 7411
Stock 800 759 781 2430 2301 2263 968 1775 1810
debts 2926 2768 2768 15564 20010 15144 3884 4292 4288
Fixed assets 5027 4838 4394 29076 30436 31136 12529 13415 14135
Opening
inventory 798 800 759 2957 2430 2301 997 968 1775
Cogs 6427 6534 6651 51579 53015 54141 22050 24590 26574
quick assets 661 964 537 12398 13116 11463 3476 4547 6056
Gross profit ratio 39.11 38.49 37.83 5.25 5.19 5.83 6.19 6.23 6.61
Financial performance management is elated to monitoring the performance of the
organisation on the basis of the financial data to enhance the performance and profitability of
firm. In this study, Marks and Spencer will be consider which is an international organisation
performing its operations indifferent regions. It is offering different products which consist of
clothing, home appliance and luxury food products. This assignment will provide information
about the ration analysis in order to evaluate the financial performance of the organisation.
Moreover, it will contain the information regarding the balance scorecard for measuring the
performance of the organisation to improve the performance for the growth and success of the
organisation. Furthermore, it will develop a balance scorecard for the company to include the
critical success factors of the organisation.
QUESTION 1
Ratio analysis to evaluate the financial performance of Marks and Spencer
particular Marks and Spencer TESCO Sainsbury
2016 2017 2018 2016 2017 2018 2016 2017 2018
Sales 10555 10622 10698 54333 55917 57491 23506 26224 28456
Gross profit 4128 4088 4047 2854 2902 3350 1456 1634 1882
Net profit 407 117 26 138 -40 1206 471 377 309
Current assets 1461 1723 1318 14828 15417 13726 4444 6322 7866
Current liabilities 2105 2368 1826 19714 19405 19238 6724 8573 10302
Shareholder
equity 3445 3156 2957 8626 6438 10480 6365 6872 7411
Stock 800 759 781 2430 2301 2263 968 1775 1810
debts 2926 2768 2768 15564 20010 15144 3884 4292 4288
Fixed assets 5027 4838 4394 29076 30436 31136 12529 13415 14135
Opening
inventory 798 800 759 2957 2430 2301 997 968 1775
Cogs 6427 6534 6651 51579 53015 54141 22050 24590 26574
quick assets 661 964 537 12398 13116 11463 3476 4547 6056
Gross profit ratio 39.11 38.49 37.83 5.25 5.19 5.83 6.19 6.23 6.61
⊘ This is a preview!⊘
Do you want full access?
Subscribe today to unlock all pages.
Trusted by 1+ million students worldwide
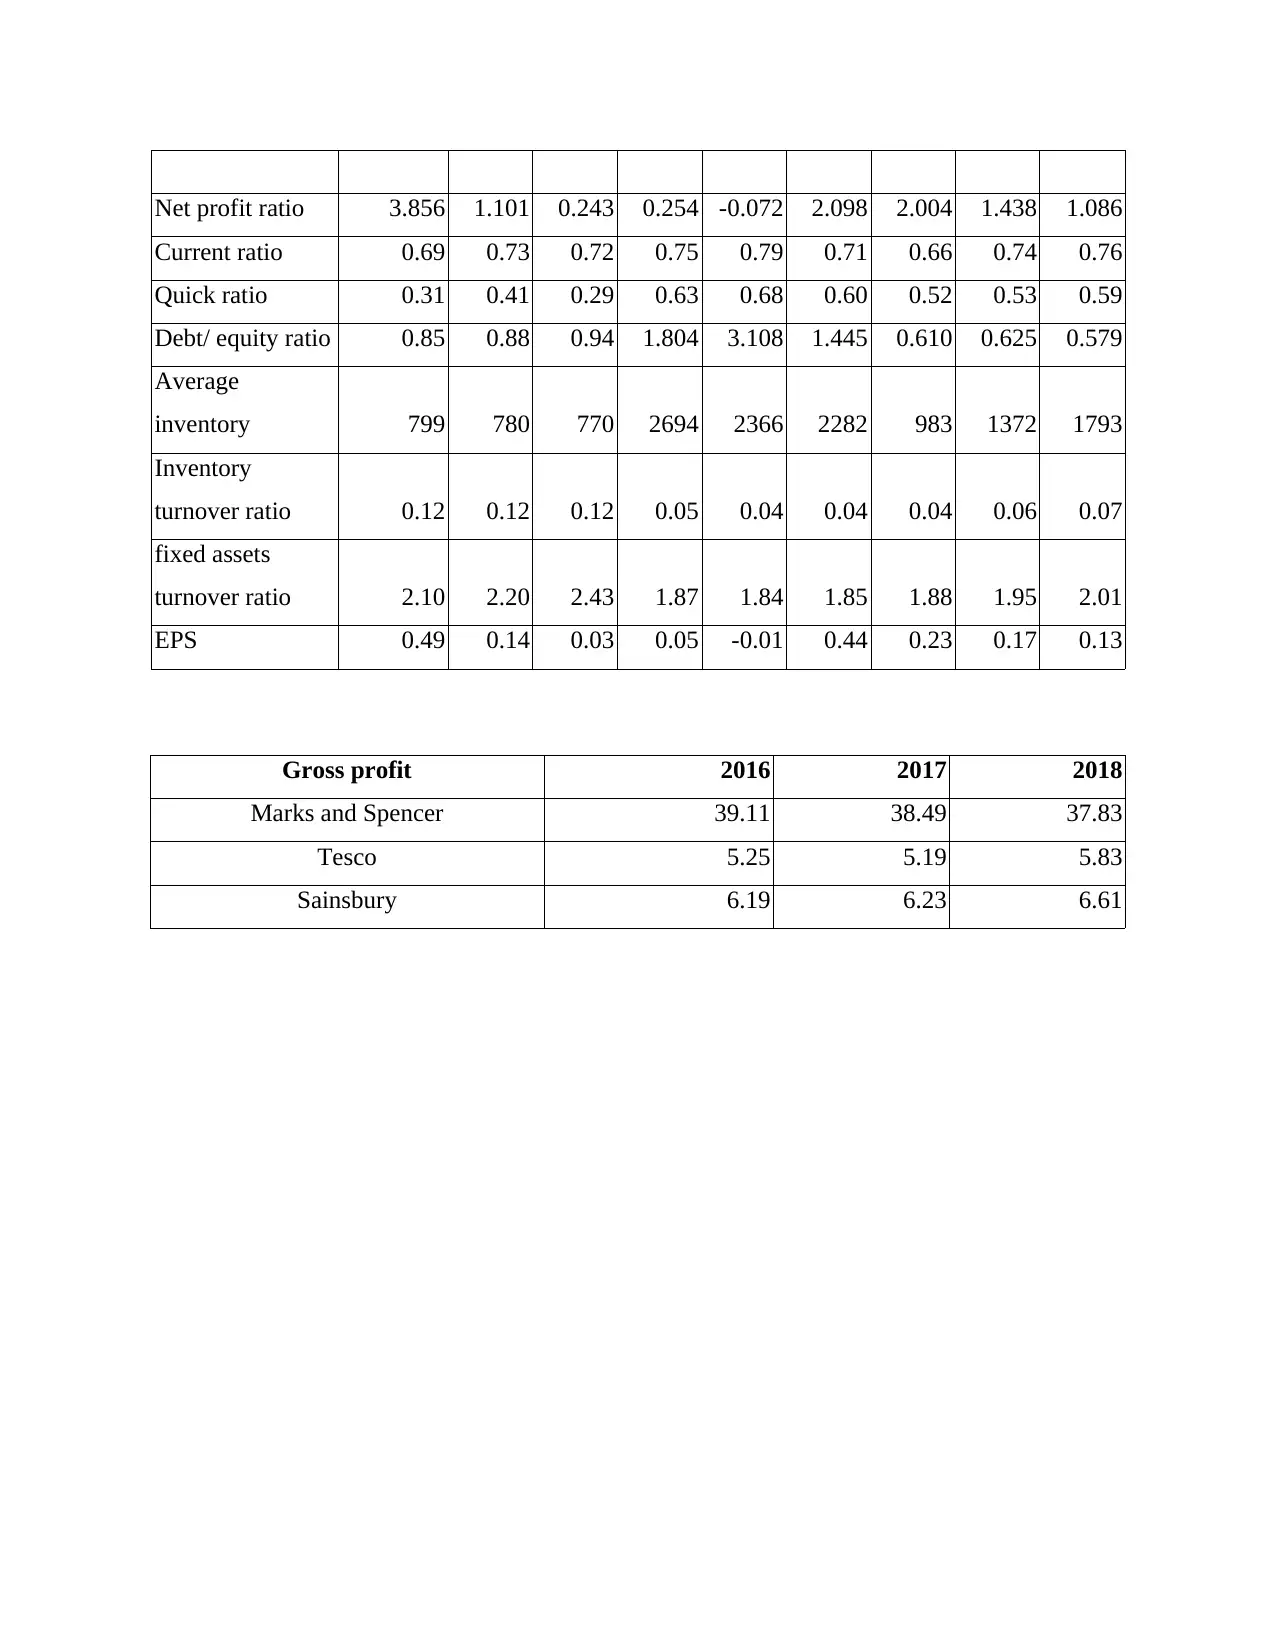
Net profit ratio 3.856 1.101 0.243 0.254 -0.072 2.098 2.004 1.438 1.086
Current ratio 0.69 0.73 0.72 0.75 0.79 0.71 0.66 0.74 0.76
Quick ratio 0.31 0.41 0.29 0.63 0.68 0.60 0.52 0.53 0.59
Debt/ equity ratio 0.85 0.88 0.94 1.804 3.108 1.445 0.610 0.625 0.579
Average
inventory 799 780 770 2694 2366 2282 983 1372 1793
Inventory
turnover ratio 0.12 0.12 0.12 0.05 0.04 0.04 0.04 0.06 0.07
fixed assets
turnover ratio 2.10 2.20 2.43 1.87 1.84 1.85 1.88 1.95 2.01
EPS 0.49 0.14 0.03 0.05 -0.01 0.44 0.23 0.17 0.13
Gross profit 2016 2017 2018
Marks and Spencer 39.11 38.49 37.83
Tesco 5.25 5.19 5.83
Sainsbury 6.19 6.23 6.61
Paraphrase This Document
Need a fresh take? Get an instant paraphrase of this document with our AI Paraphraser
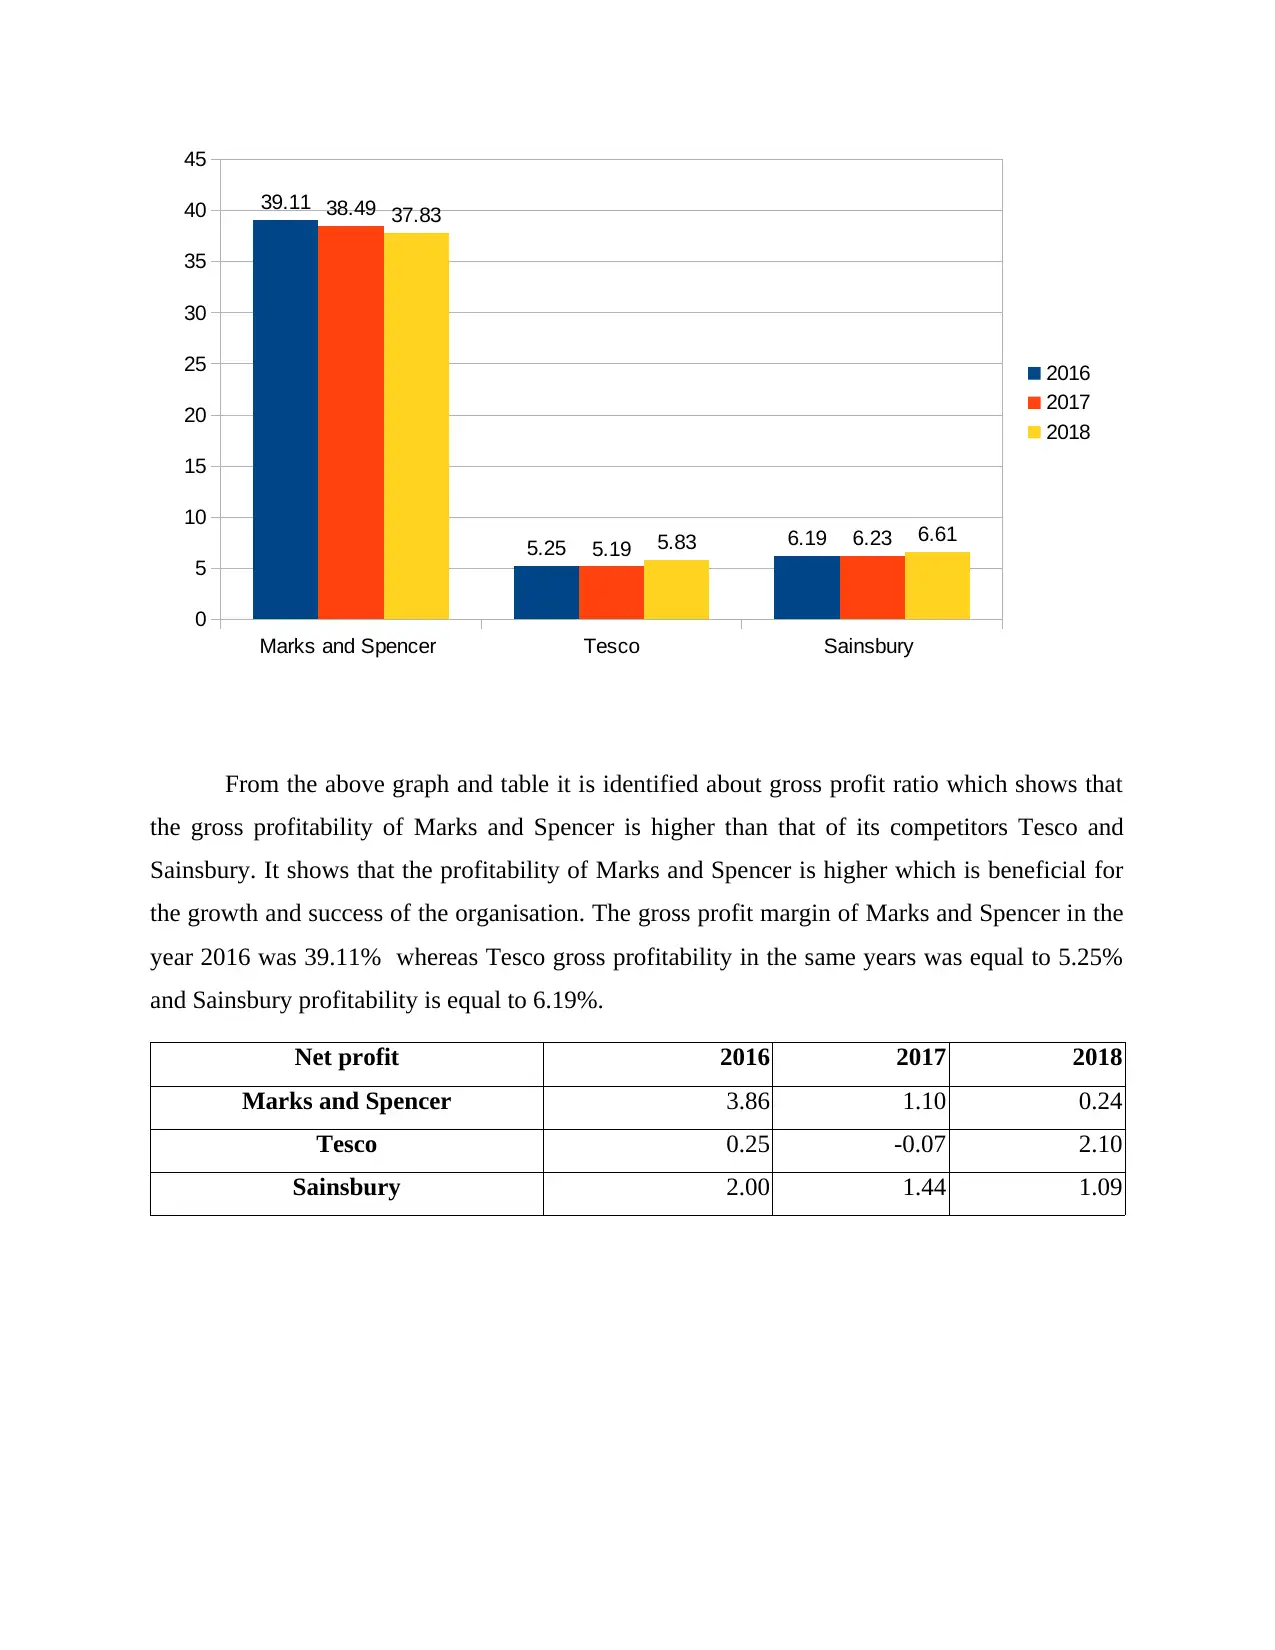
From the above graph and table it is identified about gross profit ratio which shows that
the gross profitability of Marks and Spencer is higher than that of its competitors Tesco and
Sainsbury. It shows that the profitability of Marks and Spencer is higher which is beneficial for
the growth and success of the organisation. The gross profit margin of Marks and Spencer in the
year 2016 was 39.11% whereas Tesco gross profitability in the same years was equal to 5.25%
and Sainsbury profitability is equal to 6.19%.
Net profit 2016 2017 2018
Marks and Spencer 3.86 1.10 0.24
Tesco 0.25 -0.07 2.10
Sainsbury 2.00 1.44 1.09
Marks and Spencer Tesco Sainsbury
0
5
10
15
20
25
30
35
40
45
39.11
5.25 6.19
38.49
5.19 6.23
37.83
5.83 6.61
2016
2017
2018
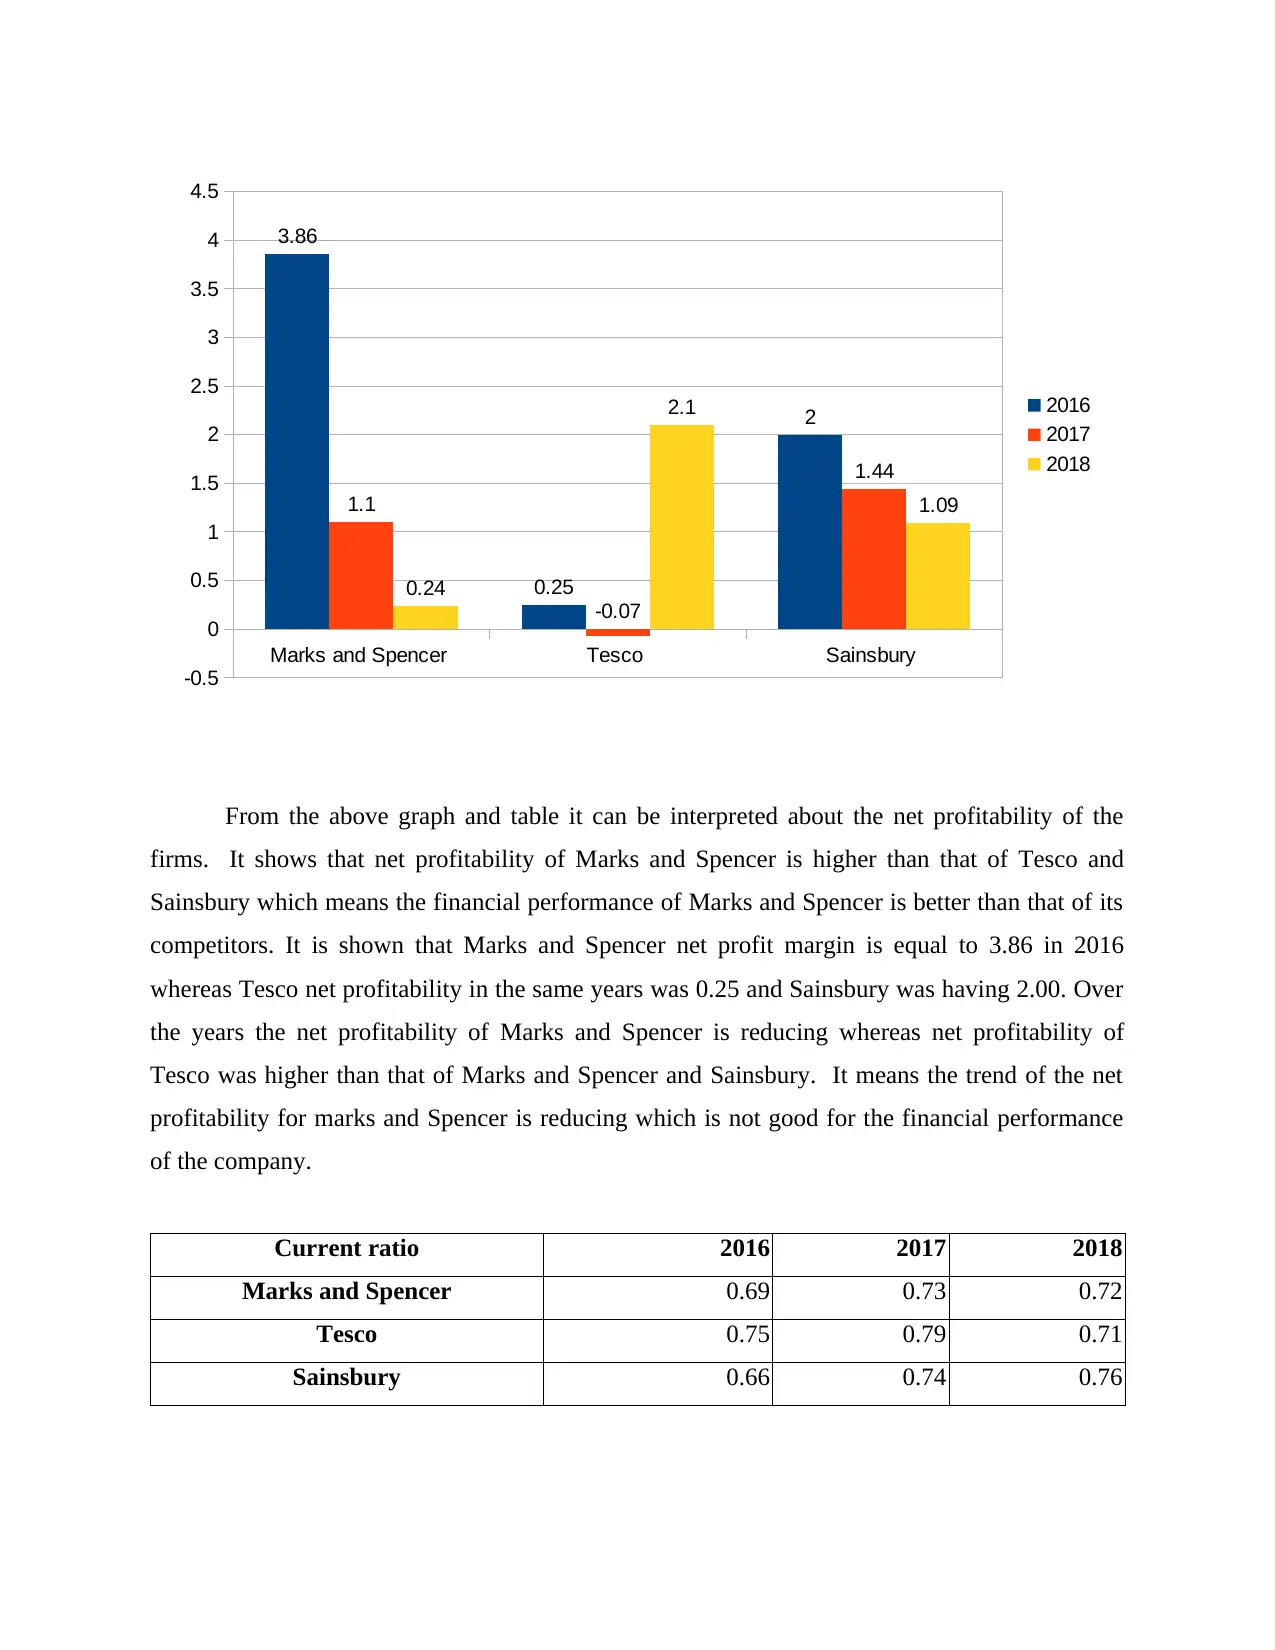
From the above graph and table it can be interpreted about the net profitability of the
firms. It shows that net profitability of Marks and Spencer is higher than that of Tesco and
Sainsbury which means the financial performance of Marks and Spencer is better than that of its
competitors. It is shown that Marks and Spencer net profit margin is equal to 3.86 in 2016
whereas Tesco net profitability in the same years was 0.25 and Sainsbury was having 2.00. Over
the years the net profitability of Marks and Spencer is reducing whereas net profitability of
Tesco was higher than that of Marks and Spencer and Sainsbury. It means the trend of the net
profitability for marks and Spencer is reducing which is not good for the financial performance
of the company.
Current ratio 2016 2017 2018
Marks and Spencer 0.69 0.73 0.72
Tesco 0.75 0.79 0.71
Sainsbury 0.66 0.74 0.76
Marks and Spencer Tesco Sainsbury
-0.5
0
0.5
1
1.5
2
2.5
3
3.5
4
4.5
3.86
0.25
2
1.1
-0.07
1.44
0.24
2.1
1.09
2016
2017
2018
⊘ This is a preview!⊘
Do you want full access?
Subscribe today to unlock all pages.
Trusted by 1+ million students worldwide
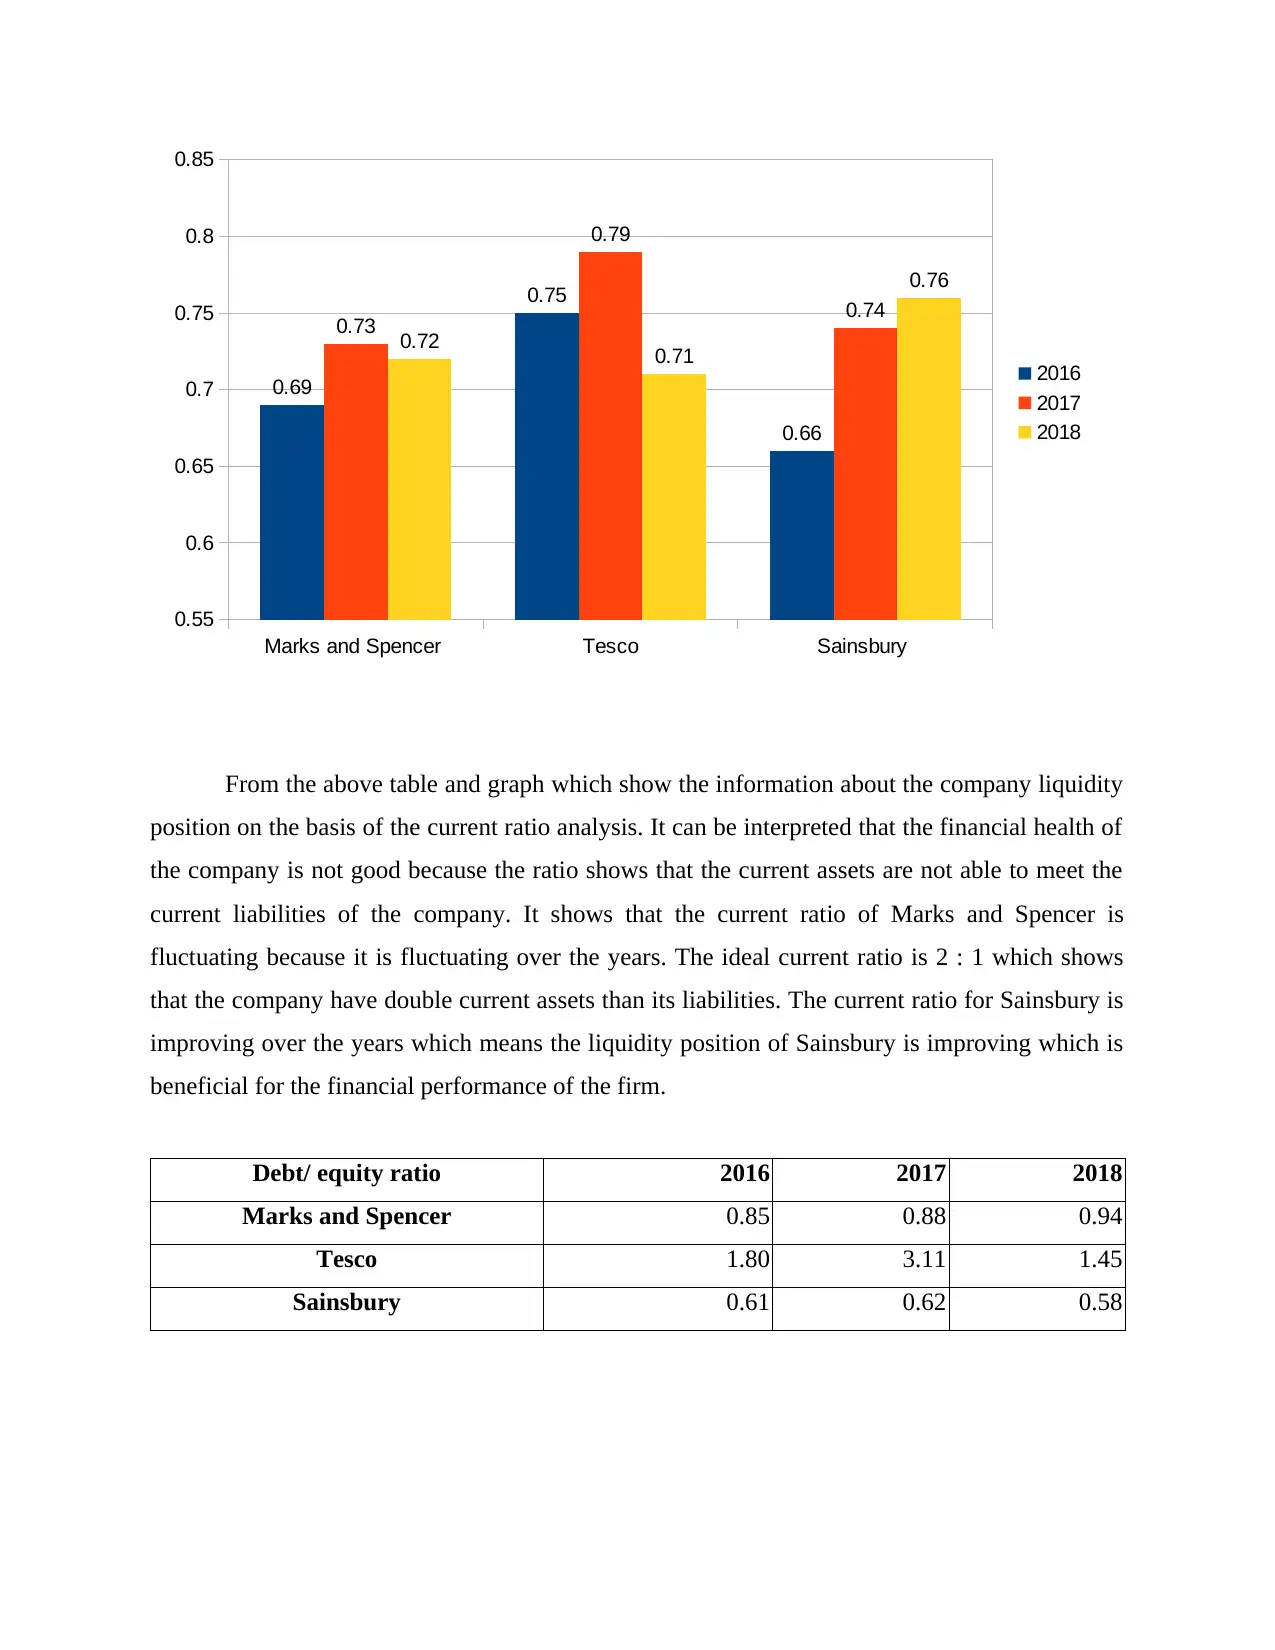
From the above table and graph which show the information about the company liquidity
position on the basis of the current ratio analysis. It can be interpreted that the financial health of
the company is not good because the ratio shows that the current assets are not able to meet the
current liabilities of the company. It shows that the current ratio of Marks and Spencer is
fluctuating because it is fluctuating over the years. The ideal current ratio is 2 : 1 which shows
that the company have double current assets than its liabilities. The current ratio for Sainsbury is
improving over the years which means the liquidity position of Sainsbury is improving which is
beneficial for the financial performance of the firm.
Debt/ equity ratio 2016 2017 2018
Marks and Spencer 0.85 0.88 0.94
Tesco 1.80 3.11 1.45
Sainsbury 0.61 0.62 0.58
Marks and Spencer Tesco Sainsbury
0.55
0.6
0.65
0.7
0.75
0.8
0.85
0.69
0.75
0.66
0.73
0.79
0.74
0.72 0.71
0.76
2016
2017
2018
Paraphrase This Document
Need a fresh take? Get an instant paraphrase of this document with our AI Paraphraser
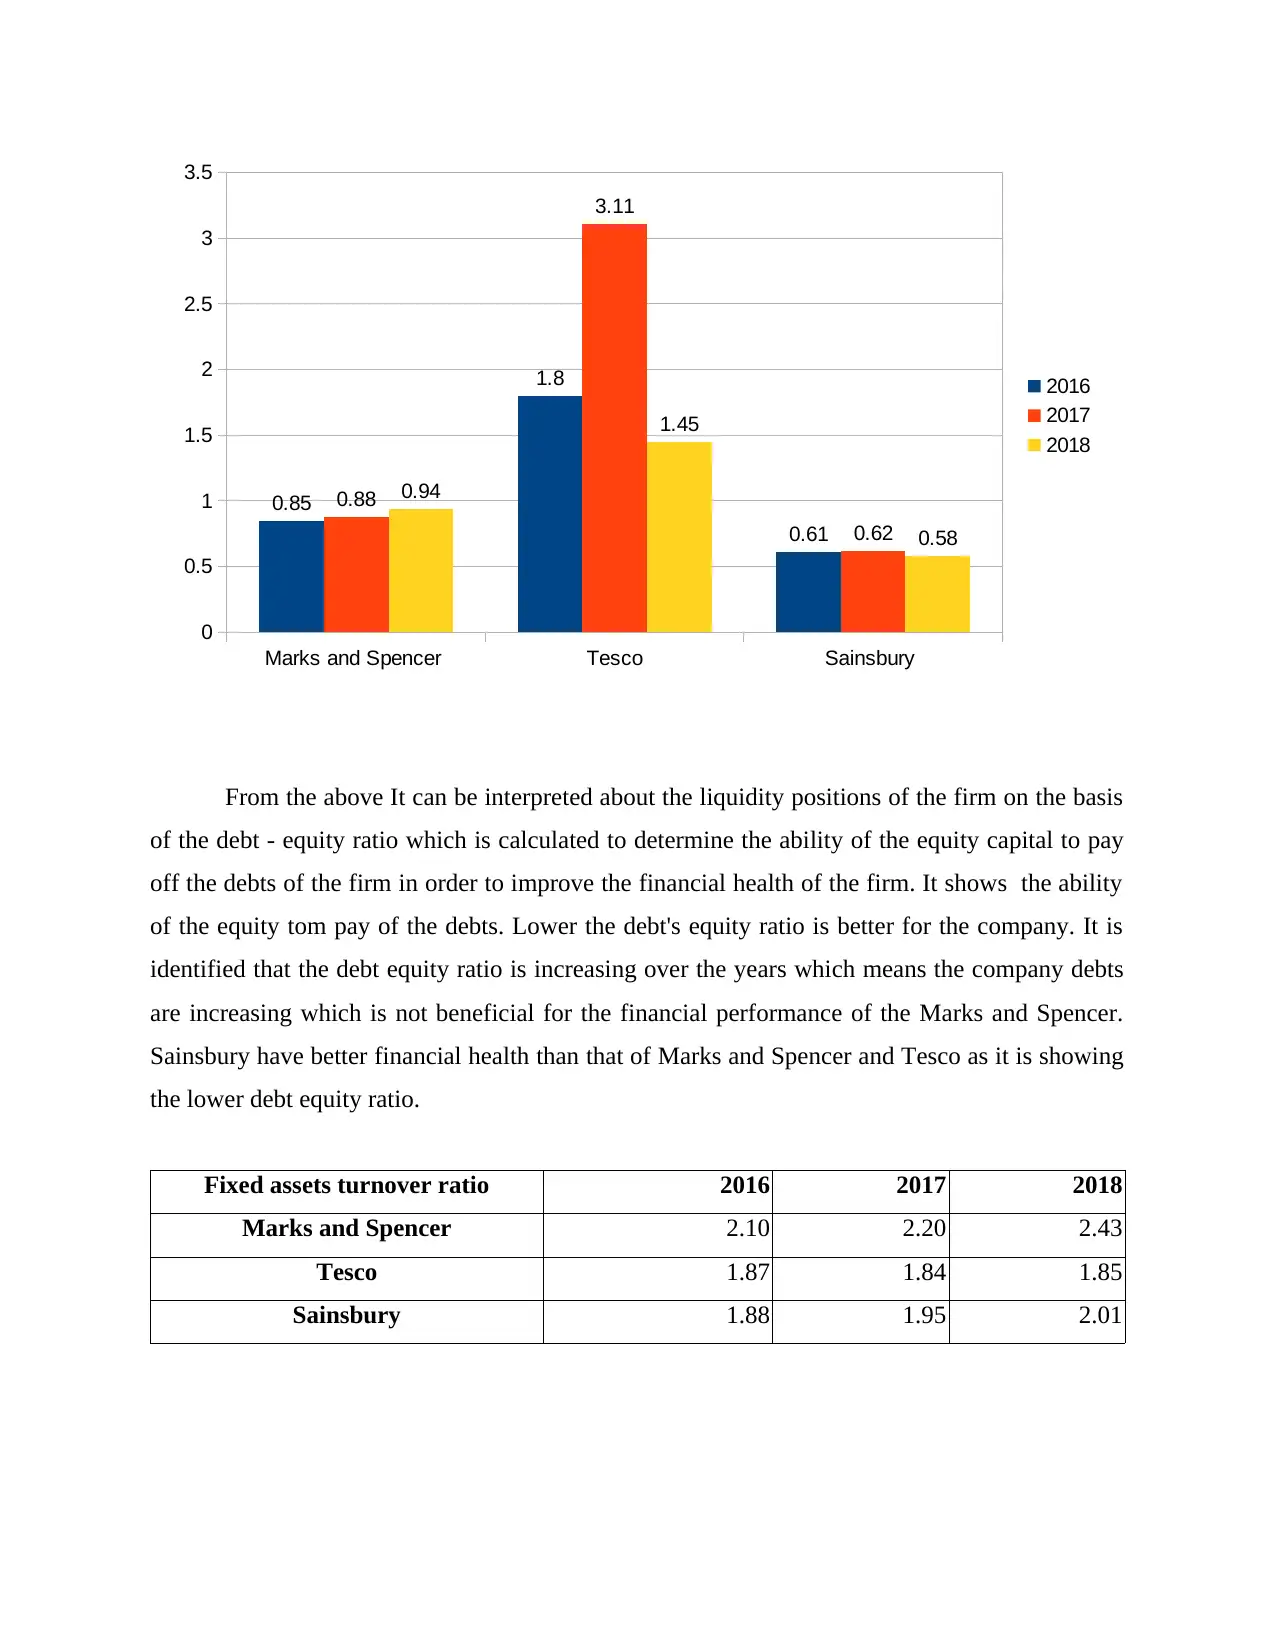
From the above It can be interpreted about the liquidity positions of the firm on the basis
of the debt - equity ratio which is calculated to determine the ability of the equity capital to pay
off the debts of the firm in order to improve the financial health of the firm. It shows the ability
of the equity tom pay of the debts. Lower the debt's equity ratio is better for the company. It is
identified that the debt equity ratio is increasing over the years which means the company debts
are increasing which is not beneficial for the financial performance of the Marks and Spencer.
Sainsbury have better financial health than that of Marks and Spencer and Tesco as it is showing
the lower debt equity ratio.
Fixed assets turnover ratio 2016 2017 2018
Marks and Spencer 2.10 2.20 2.43
Tesco 1.87 1.84 1.85
Sainsbury 1.88 1.95 2.01
Marks and Spencer Tesco Sainsbury
0
0.5
1
1.5
2
2.5
3
3.5
0.85
1.8
0.61
0.88
3.11
0.62
0.94
1.45
0.58
2016
2017
2018
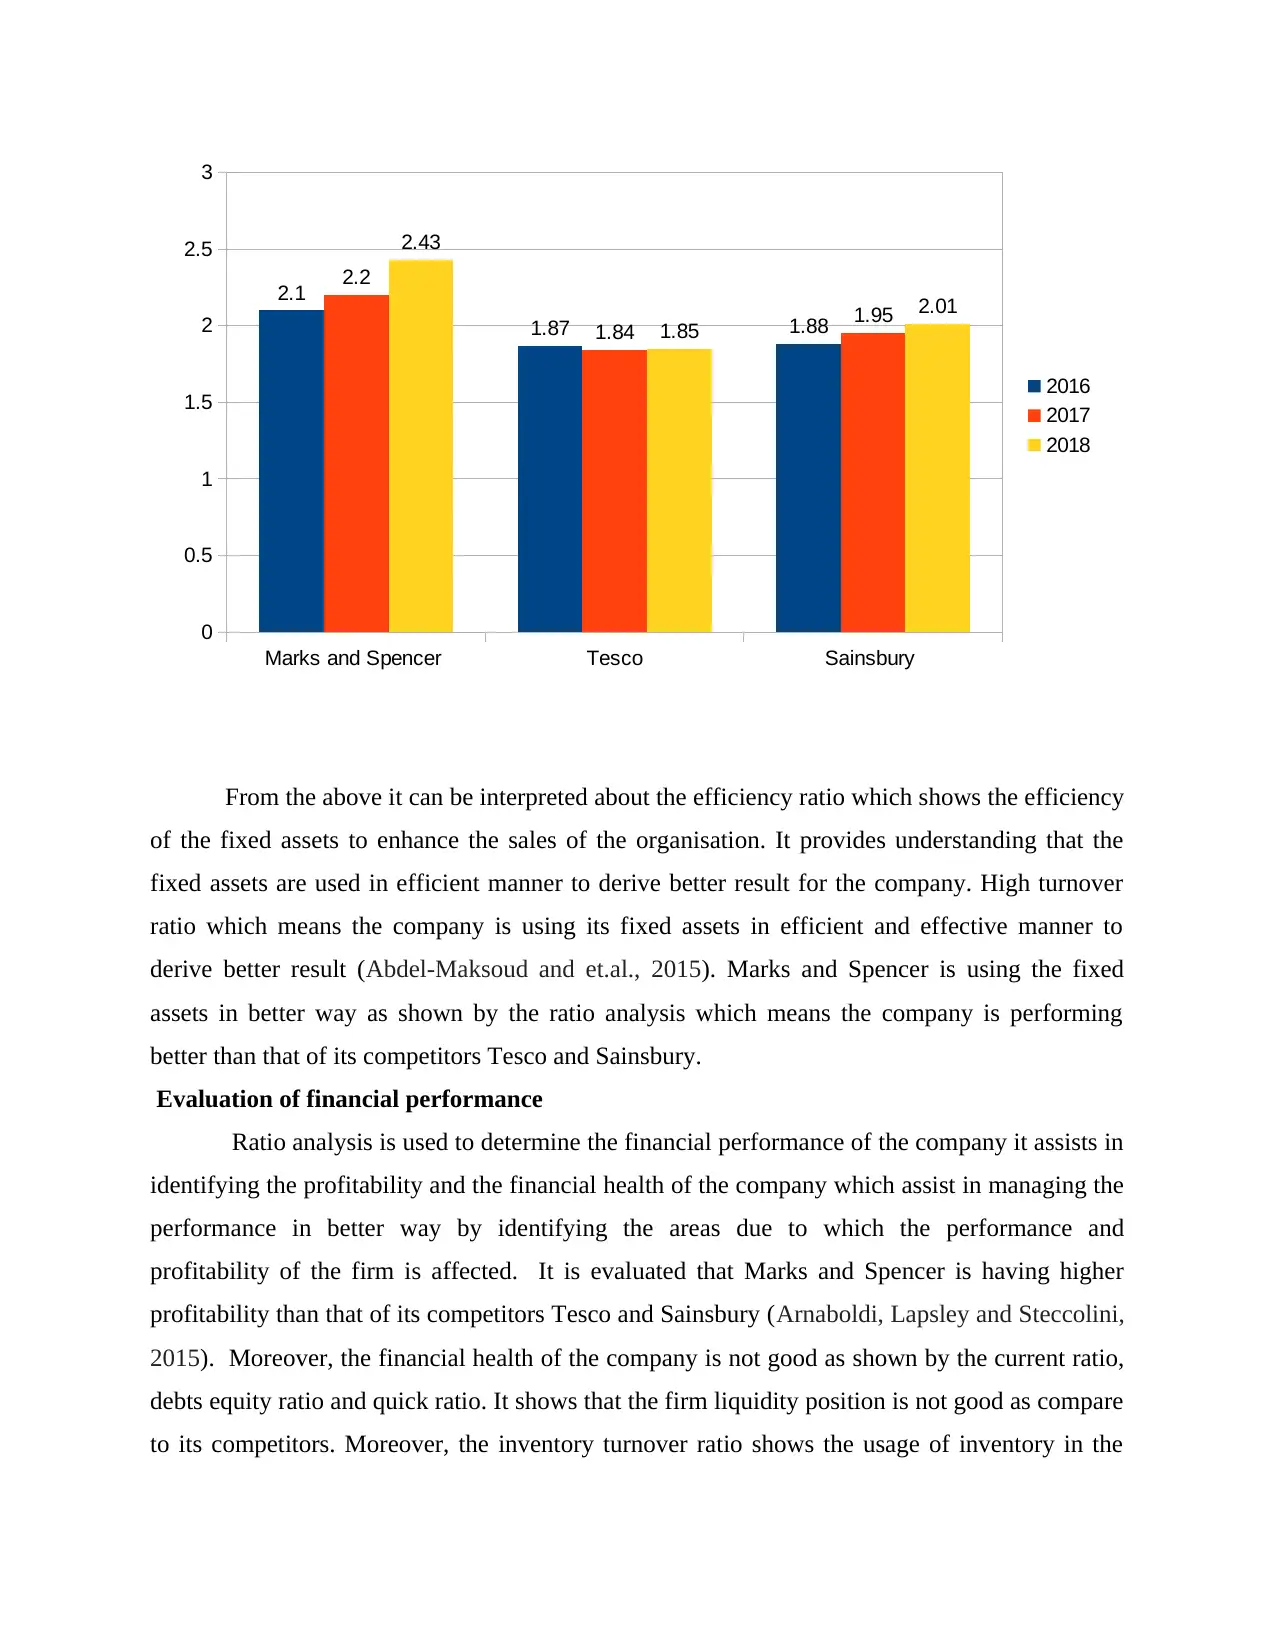
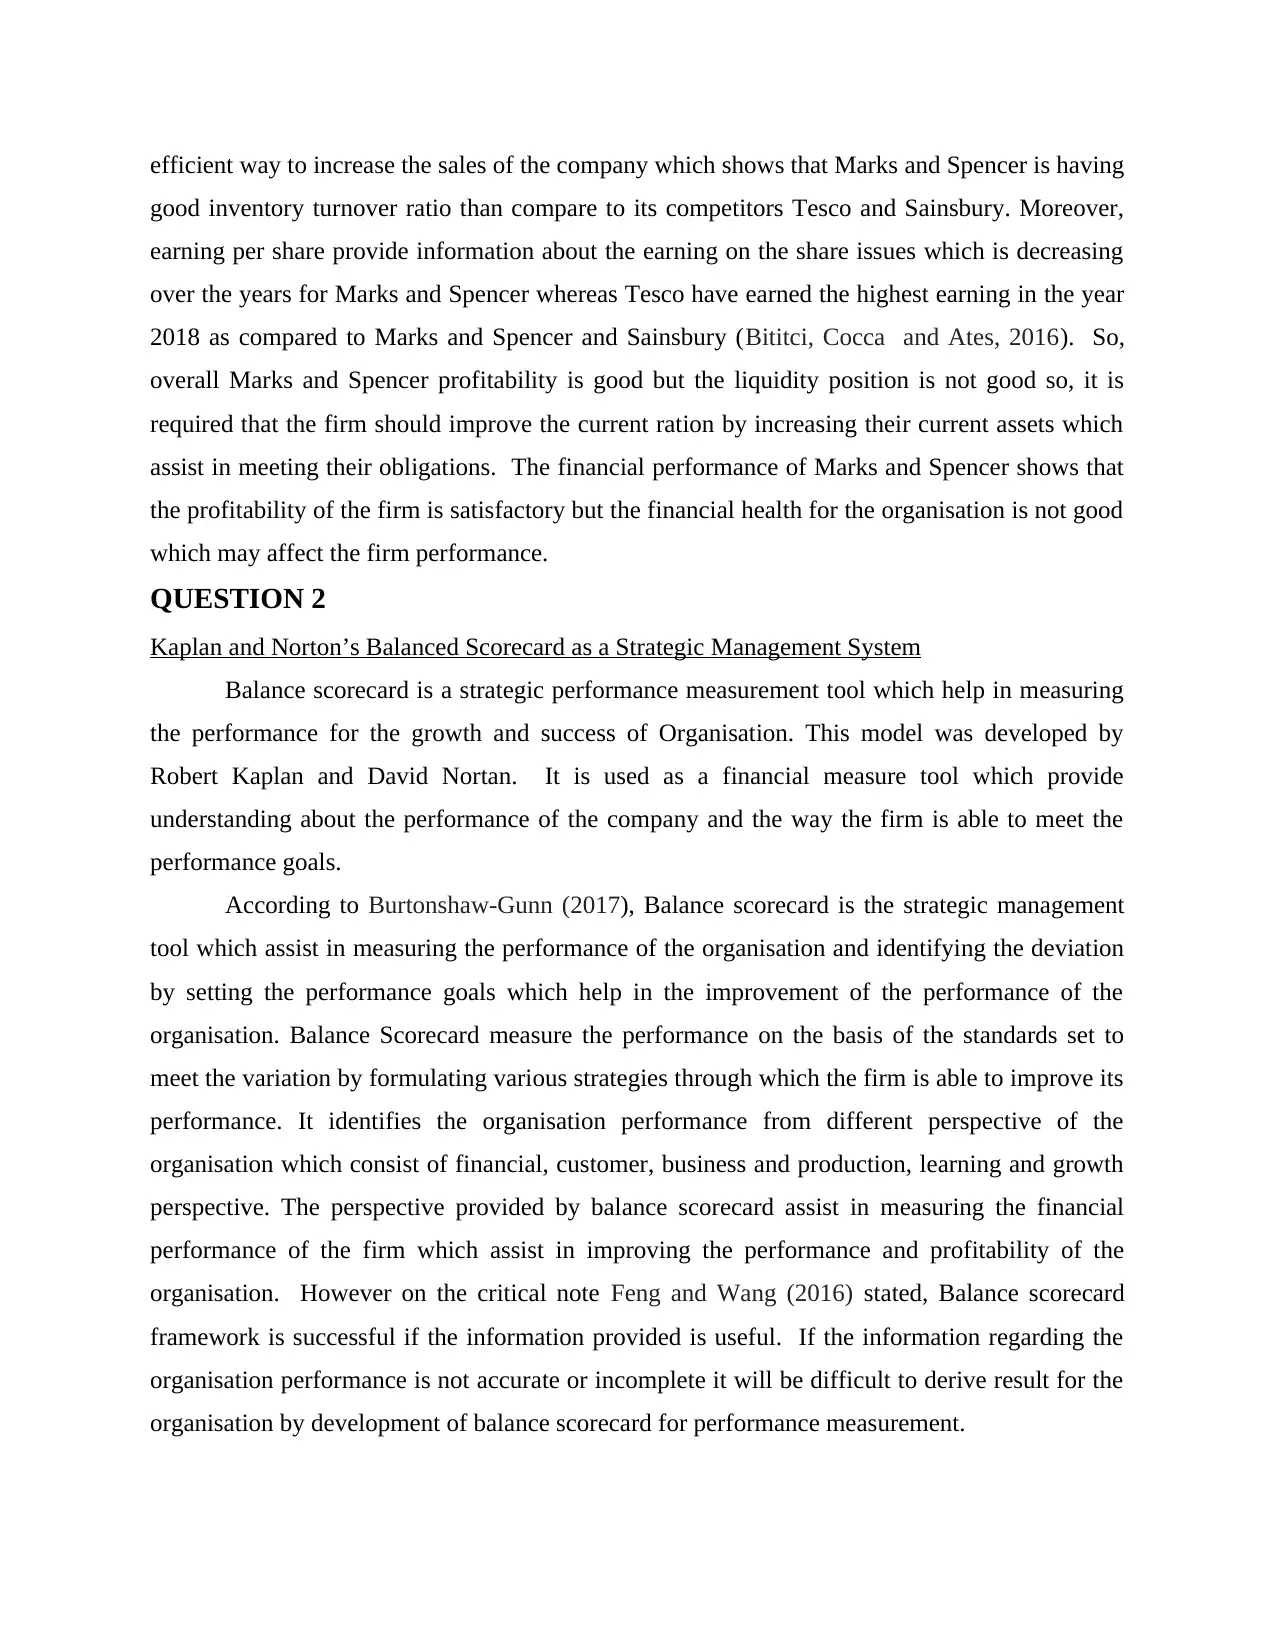
From the above it can be interpreted about the efficiency ratio which shows the efficiency
of the fixed assets to enhance the sales of the organisation. It provides understanding that the
fixed assets are used in efficient manner to derive better result for the company. High turnover
ratio which means the company is using its fixed assets in efficient and effective manner to
derive better result (Abdel-Maksoud and et.al., 2015). Marks and Spencer is using the fixed
assets in better way as shown by the ratio analysis which means the company is performing
better than that of its competitors Tesco and Sainsbury.
Evaluation of financial performance
Ratio analysis is used to determine the financial performance of the company it assists in
identifying the profitability and the financial health of the company which assist in managing the
performance in better way by identifying the areas due to which the performance and
profitability of the firm is affected. It is evaluated that Marks and Spencer is having higher
profitability than that of its competitors Tesco and Sainsbury (Arnaboldi, Lapsley and Steccolini,
2015). Moreover, the financial health of the company is not good as shown by the current ratio,
debts equity ratio and quick ratio. It shows that the firm liquidity position is not good as compare
to its competitors. Moreover, the inventory turnover ratio shows the usage of inventory in the
Marks and Spencer Tesco Sainsbury
0
0.5
1
1.5
2
2.5
3
2.1
1.87 1.88
2.2
1.84 1.95
2.43
1.85
2.01
2016
2017
2018
⊘ This is a preview!⊘
Do you want full access?
Subscribe today to unlock all pages.
Trusted by 1+ million students worldwide
efficient way to increase the sales of the company which shows that Marks and Spencer is having
good inventory turnover ratio than compare to its competitors Tesco and Sainsbury. Moreover,
earning per share provide information about the earning on the share issues which is decreasing
over the years for Marks and Spencer whereas Tesco have earned the highest earning in the year
2018 as compared to Marks and Spencer and Sainsbury (Bititci, Cocca and Ates, 2016). So,
overall Marks and Spencer profitability is good but the liquidity position is not good so, it is
required that the firm should improve the current ration by increasing their current assets which
assist in meeting their obligations. The financial performance of Marks and Spencer shows that
the profitability of the firm is satisfactory but the financial health for the organisation is not good
which may affect the firm performance.
QUESTION 2
Kaplan and Norton’s Balanced Scorecard as a Strategic Management System
Balance scorecard is a strategic performance measurement tool which help in measuring
the performance for the growth and success of Organisation. This model was developed by
Robert Kaplan and David Nortan. It is used as a financial measure tool which provide
understanding about the performance of the company and the way the firm is able to meet the
performance goals.
According to Burtonshaw-Gunn (2017), Balance scorecard is the strategic management
tool which assist in measuring the performance of the organisation and identifying the deviation
by setting the performance goals which help in the improvement of the performance of the
organisation. Balance Scorecard measure the performance on the basis of the standards set to
meet the variation by formulating various strategies through which the firm is able to improve its
performance. It identifies the organisation performance from different perspective of the
organisation which consist of financial, customer, business and production, learning and growth
perspective. The perspective provided by balance scorecard assist in measuring the financial
performance of the firm which assist in improving the performance and profitability of the
organisation. However on the critical note Feng and Wang (2016) stated, Balance scorecard
framework is successful if the information provided is useful. If the information regarding the
organisation performance is not accurate or incomplete it will be difficult to derive result for the
organisation by development of balance scorecard for performance measurement.
Paraphrase This Document
Need a fresh take? Get an instant paraphrase of this document with our AI Paraphraser
In the views of Feng and et.al. (2016), balance scorecard help the company in improving
their performance by providing the firm with clear picture of their operations. It helps the
organisation in monitoring the performance of employees and creating the action plan for
monitoring the financial performance of the company. It assists in financial growth and
profitability of the business which is good for the success of business. With the help of this
strategic management tool the firm is able to gain more customer base and market share and can
also provide various job benefits to the employees by earning more profit. This tool is useful for
achieving the goals and objectives of the firm in effective and efficient manner. It assists in
controlling the expenses of the firm which help in increasing the income for the period which in
turn will improve the operational efficiency of the organisation. On the critical note Lucas and
Noordewier (2016) stated that, Balance scorecard is ineffective if the employees of the
organisation resist from implementing the balance scorecard in the organisation due to which the
organisation will not be able to successfully achieve its performance goals. Employees may
resist because it requires time and training for understanding the functioning of balance
scorecard. It requires time form learning about the balance scorecard due to which many
employees of the organization will resist doe the implementation of this tool the organisation.
As per O'Donohue and Torugsa (2016), balance scorecard provide information about the
performance from the financial perspective which is related to the financial performance of the
organisation for creating value for the shareholders. It provides understanding that the operation
and strategies of the organisation add value for the shareholders or not. Financial perspective
provide information about the financial aspect of the company in order to increase the
profitability of the firm which in turn will assist in improving the performance of the
organisation and will help in the growth and success of the firm. On the contrary Parvadavardini,
Vivek and Devadasan (2016) stated that, balance scorecard requires the information about the
financial aspect of the organisation for measuring the performance of the firm on the basis of the
financial information but if the financial information provided is incomplete than the balance
scorecard is not able to work in effective manner and thus the accurate result are derived.
Moreover, there are other perspective which consist of customer perspective, business and
internal process perspective and learning and growth perspective which assist in improving the
performance of the firm different aspect to attract more customers towards the firm and provide
them satisfaction by meeting their demands. Also, it provides understanding about the ways
through which the firm is able to create value for the customers in order to attract more investors
towards the firm. In addition to this, It also assists in improving the performance of the
employees by providing them motivation and job satisfaction which in turn will help the firm in
retaining the employees for the long and reducing the staff turnover which will assist in
enhancing the brand image of the organisation.
In the views of Post and Byron (2015), Balance scorecard help the firm in measuring
their performance from various perspective in order to improve the overall performance of the
firm to have strong brand image in the market and attract many customers towards the products
and services offered by organisation. Balance score card is beneficial for the company as it
provide direction top the firm through which the firm is bale to achieve their goals and
objectives. In the organisation key performance indicator help the firm in measuring their
performance which assist in achieving their targeted goals. By developing balance scorecard the
organisation will be able to improve their performance and profitability and the financial health
for the firm will be improved which is good for the organisation and success. On the contrary
Wang, Dou and Jia (2016) stated that, balance scorecard required more cost and time for their
implementation due to which the other operation so the firm may get affected. It increases the
cost of the organisation because balance scorecard increases the expense of the firm for their
implementation.
Application of balance scorecard to Marks and Spencer
Balance scorecard is applicable for Marks and Spencer because if this organisation uses
the balance scorecard tool which is the strategic management tool than the firm will be able to
gain competitive advantage by measuring the performance according the standard performance
goals and can identify the variation in the performance which in turn will lead to improved
performance of the organisation. Marks and Spencer can develop balance score card which will
provide understanding about the performance and the variation existing in their performance due
to which the organisation growth and success is affected. Marks and Spencer by applying this
concept for the measurement of their performance will be able to achieve its performance goals.
Balance scorecard is a time consuming process but it will help in measuring the performance and
formulating various strategies formulating the higher performance for the achievement of their
goals and objectives. With the help of balance scorecard Marks and Spencer will be able to meet
the goals and objectives which will help in providing motivation to the employees. The balance
⊘ This is a preview!⊘
Do you want full access?
Subscribe today to unlock all pages.
Trusted by 1+ million students worldwide
1 out of 17
Related Documents


Your All-in-One AI-Powered Toolkit for Academic Success.
+13062052269
info@desklib.com
Available 24*7 on WhatsApp / Email
![[object Object]](/_next/static/media/star-bottom.7253800d.svg)
Unlock your academic potential
Copyright © 2020–2026 A2Z Services. All Rights Reserved. Developed and managed by ZUCOL.