Financial Statement Analysis Project: McPherson's Performance Review
VerifiedAdded on 2020/10/23
|26
|6862
|169
Project
AI Summary
This capstone project provides a comprehensive financial statement analysis of McPherson, a custom manufacturer of precision optical instruments. The analysis focuses on forecasting sales growth, asset turnover, and profit margins from 2019 to 2023 based on 2018 data. Key components include calculating free cash flow, determining dividend payout ratios, and assessing net payments to debt holders. The project also involves forecasting the cost of debt, calculating comprehensive income, and analyzing dividend policy. The analysis aims to identify the company's profitability, growth prospects, and provide insights for stakeholders' decision-making, offering a detailed examination of McPherson's financial performance and future outlook. The project includes the use of financial ratios, forecasting techniques, and valuation methods to assess the company's financial health and potential.
FINANCIAL STATEMENT
ANALYSIS CAPSTONE
ANALYSIS CAPSTONE
Paraphrase This Document
Need a fresh take? Get an instant paraphrase of this document with our AI Paraphraser
Table of Contents
INTRODUCTION...........................................................................................................................3
MAIN BODY...................................................................................................................................3
Forecasting.............................................................................................................................3
Sales Growth..........................................................................................................................3
Forecasting ATO ( Asset turnover ).......................................................................................5
Forecasting Profit margin (PM).............................................................................................6
Calculate Free Cash flow (NOPAT- Change in NOA ).........................................................7
Dividend Payout ratio.............................................................................................................7
Calculation of net payment to debt holders............................................................................8
Forecast cost of debt and debt balance...................................................................................9
Calculation of comprehensive income.................................................................................10
Calculation of equity............................................................................................................10
Dividend policy....................................................................................................................11
Net cost of debt after tax......................................................................................................12
CONCLUSION..............................................................................................................................28
REFERENCES..............................................................................................................................29
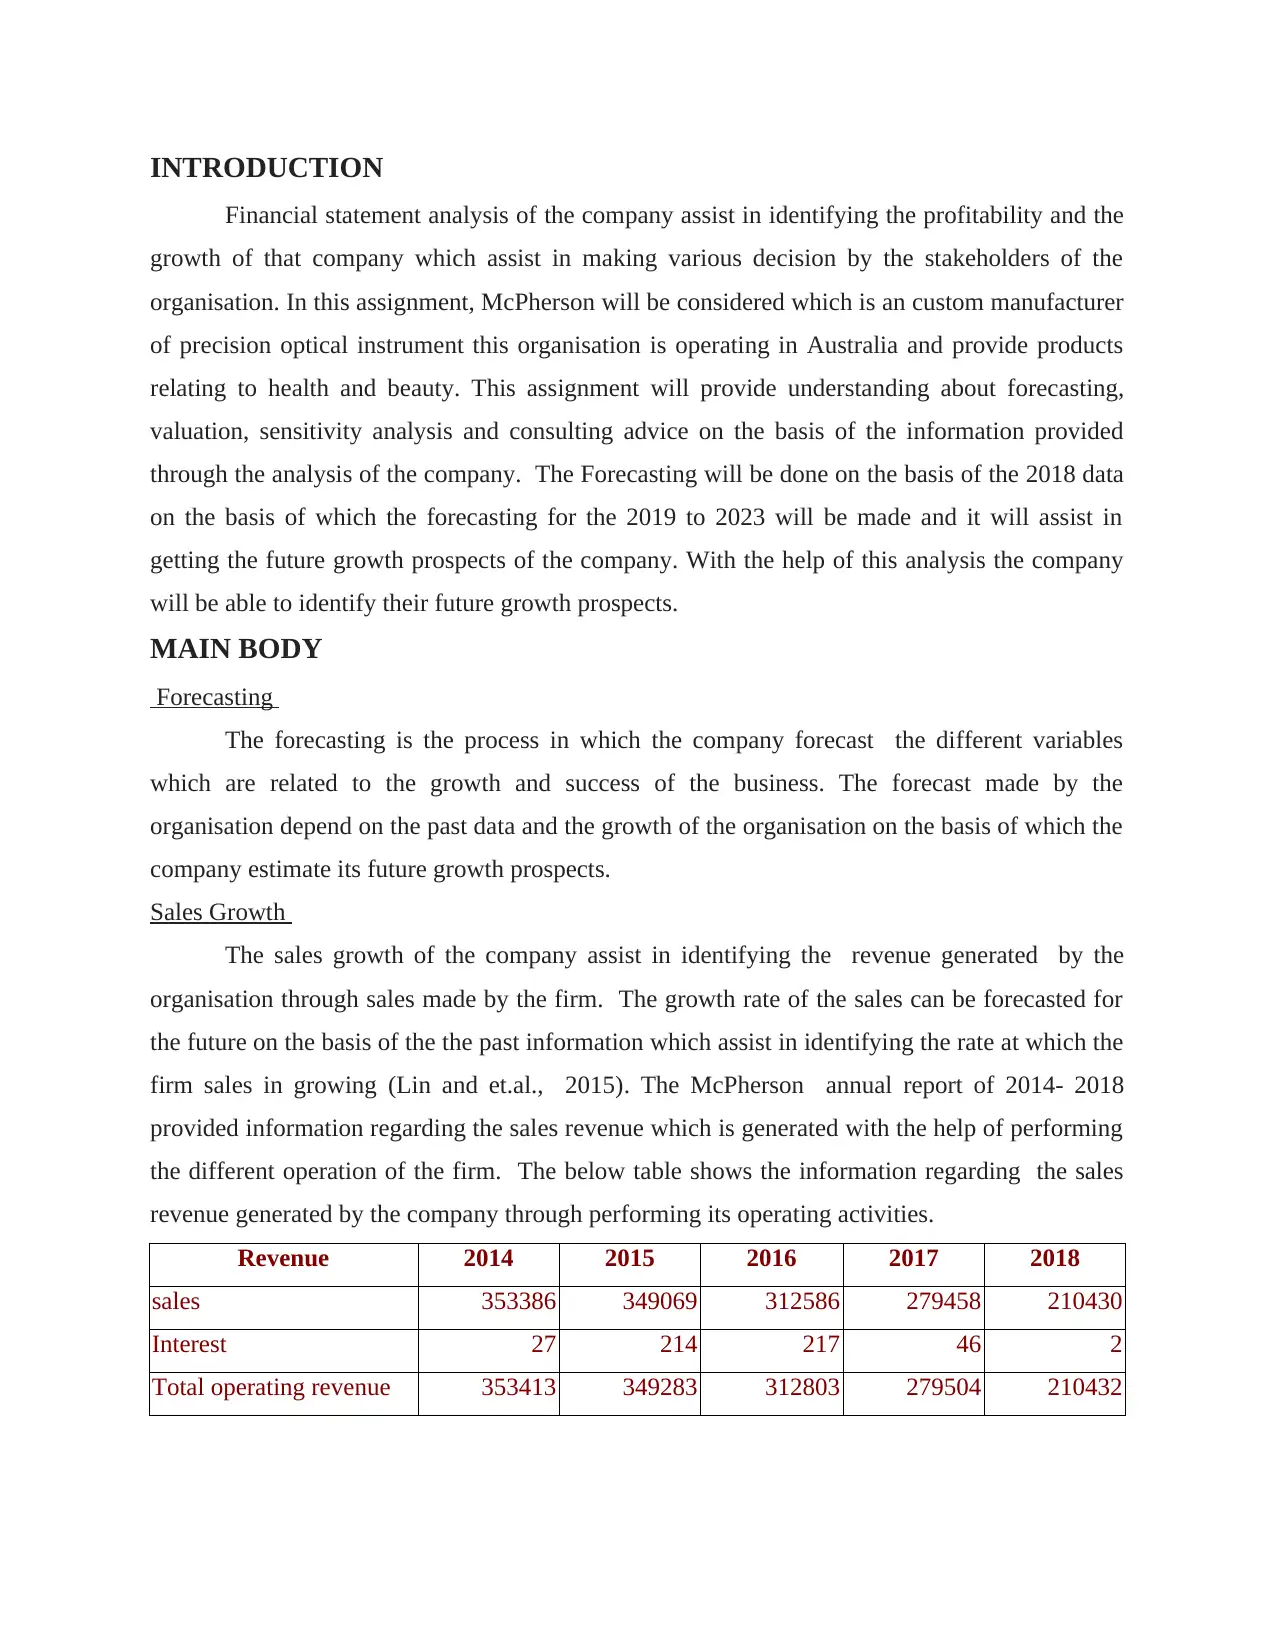
INTRODUCTION
Financial statement analysis of the company assist in identifying the profitability and the
growth of that company which assist in making various decision by the stakeholders of the
organisation. In this assignment, McPherson will be considered which is an custom manufacturer
of precision optical instrument this organisation is operating in Australia and provide products
relating to health and beauty. This assignment will provide understanding about forecasting,
valuation, sensitivity analysis and consulting advice on the basis of the information provided
through the analysis of the company. The Forecasting will be done on the basis of the 2018 data
on the basis of which the forecasting for the 2019 to 2023 will be made and it will assist in
getting the future growth prospects of the company. With the help of this analysis the company
will be able to identify their future growth prospects.
MAIN BODY
Forecasting
The forecasting is the process in which the company forecast the different variables
which are related to the growth and success of the business. The forecast made by the
organisation depend on the past data and the growth of the organisation on the basis of which the
company estimate its future growth prospects.
Sales Growth
The sales growth of the company assist in identifying the revenue generated by the
organisation through sales made by the firm. The growth rate of the sales can be forecasted for
the future on the basis of the the past information which assist in identifying the rate at which the
firm sales in growing (Lin and et.al., 2015). The McPherson annual report of 2014- 2018
provided information regarding the sales revenue which is generated with the help of performing
the different operation of the firm. The below table shows the information regarding the sales
revenue generated by the company through performing its operating activities.
Revenue 2014 2015 2016 2017 2018
sales 353386 349069 312586 279458 210430
Interest 27 214 217 46 2
Total operating revenue 353413 349283 312803 279504 210432
⊘ This is a preview!⊘
Do you want full access?
Subscribe today to unlock all pages.
Trusted by 1+ million students worldwide
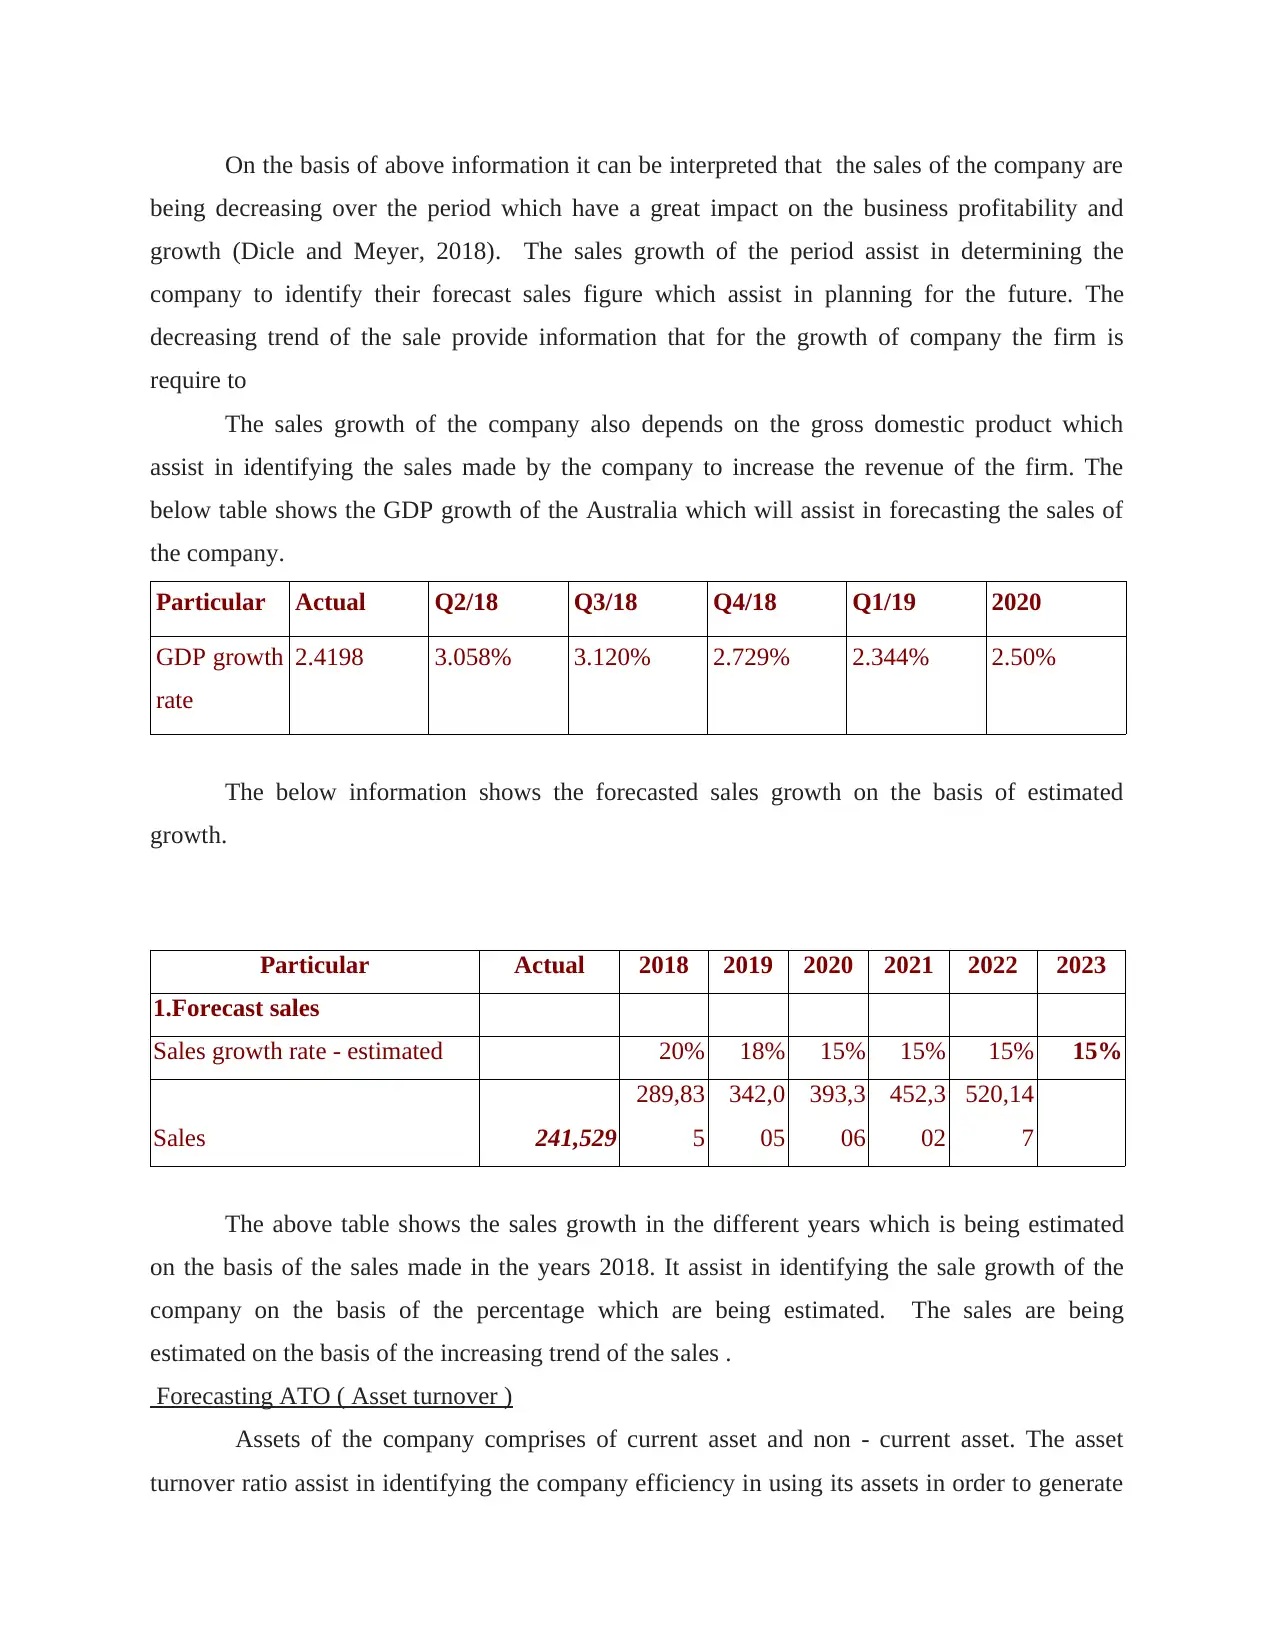
On the basis of above information it can be interpreted that the sales of the company are
being decreasing over the period which have a great impact on the business profitability and
growth (Dicle and Meyer, 2018). The sales growth of the period assist in determining the
company to identify their forecast sales figure which assist in planning for the future. The
decreasing trend of the sale provide information that for the growth of company the firm is
require to
The sales growth of the company also depends on the gross domestic product which
assist in identifying the sales made by the company to increase the revenue of the firm. The
below table shows the GDP growth of the Australia which will assist in forecasting the sales of
the company.
Particular Actual Q2/18 Q3/18 Q4/18 Q1/19 2020
GDP growth
rate
2.4198 3.058% 3.120% 2.729% 2.344% 2.50%
The below information shows the forecasted sales growth on the basis of estimated
growth.
Particular Actual 2018 2019 2020 2021 2022 2023
1.Forecast sales
Sales growth rate - estimated 20% 18% 15% 15% 15% 15%
Sales 241,529
289,83
5
342,0
05
393,3
06
452,3
02
520,14
7
The above table shows the sales growth in the different years which is being estimated
on the basis of the sales made in the years 2018. It assist in identifying the sale growth of the
company on the basis of the percentage which are being estimated. The sales are being
estimated on the basis of the increasing trend of the sales .
Forecasting ATO ( Asset turnover )
Assets of the company comprises of current asset and non - current asset. The asset
turnover ratio assist in identifying the company efficiency in using its assets in order to generate
Paraphrase This Document
Need a fresh take? Get an instant paraphrase of this document with our AI Paraphraser
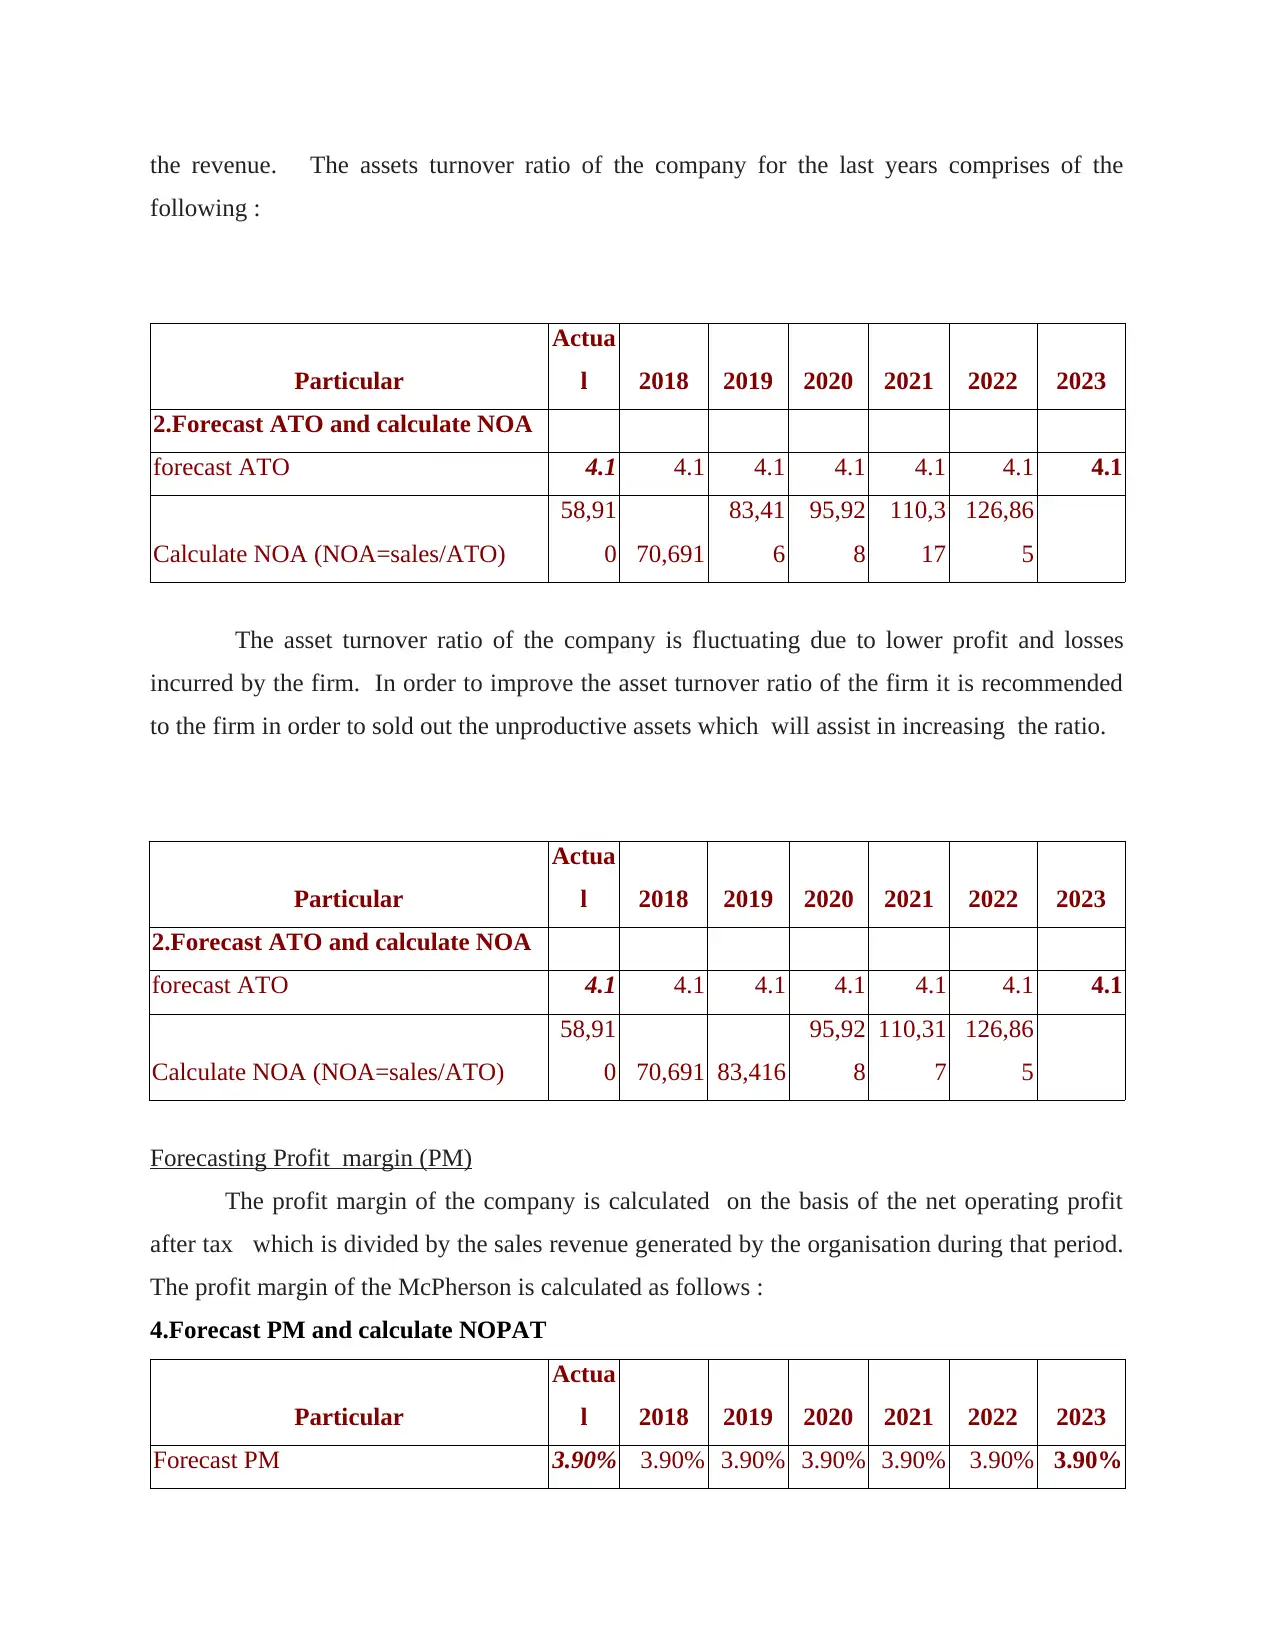
the revenue. The assets turnover ratio of the company for the last years comprises of the
following :
Particular
Actua
l 2018 2019 2020 2021 2022 2023
2.Forecast ATO and calculate NOA
forecast ATO 4.1 4.1 4.1 4.1 4.1 4.1 4.1
Calculate NOA (NOA=sales/ATO)
58,91
0 70,691
83,41
6
95,92
8
110,3
17
126,86
5
The asset turnover ratio of the company is fluctuating due to lower profit and losses
incurred by the firm. In order to improve the asset turnover ratio of the firm it is recommended
to the firm in order to sold out the unproductive assets which will assist in increasing the ratio.
Particular
Actua
l 2018 2019 2020 2021 2022 2023
2.Forecast ATO and calculate NOA
forecast ATO 4.1 4.1 4.1 4.1 4.1 4.1 4.1
Calculate NOA (NOA=sales/ATO)
58,91
0 70,691 83,416
95,92
8
110,31
7
126,86
5
Forecasting Profit margin (PM)
The profit margin of the company is calculated on the basis of the net operating profit
after tax which is divided by the sales revenue generated by the organisation during that period.
The profit margin of the McPherson is calculated as follows :
4.Forecast PM and calculate NOPAT
Particular
Actua
l 2018 2019 2020 2021 2022 2023
Forecast PM 3.90% 3.90% 3.90% 3.90% 3.90% 3.90% 3.90%
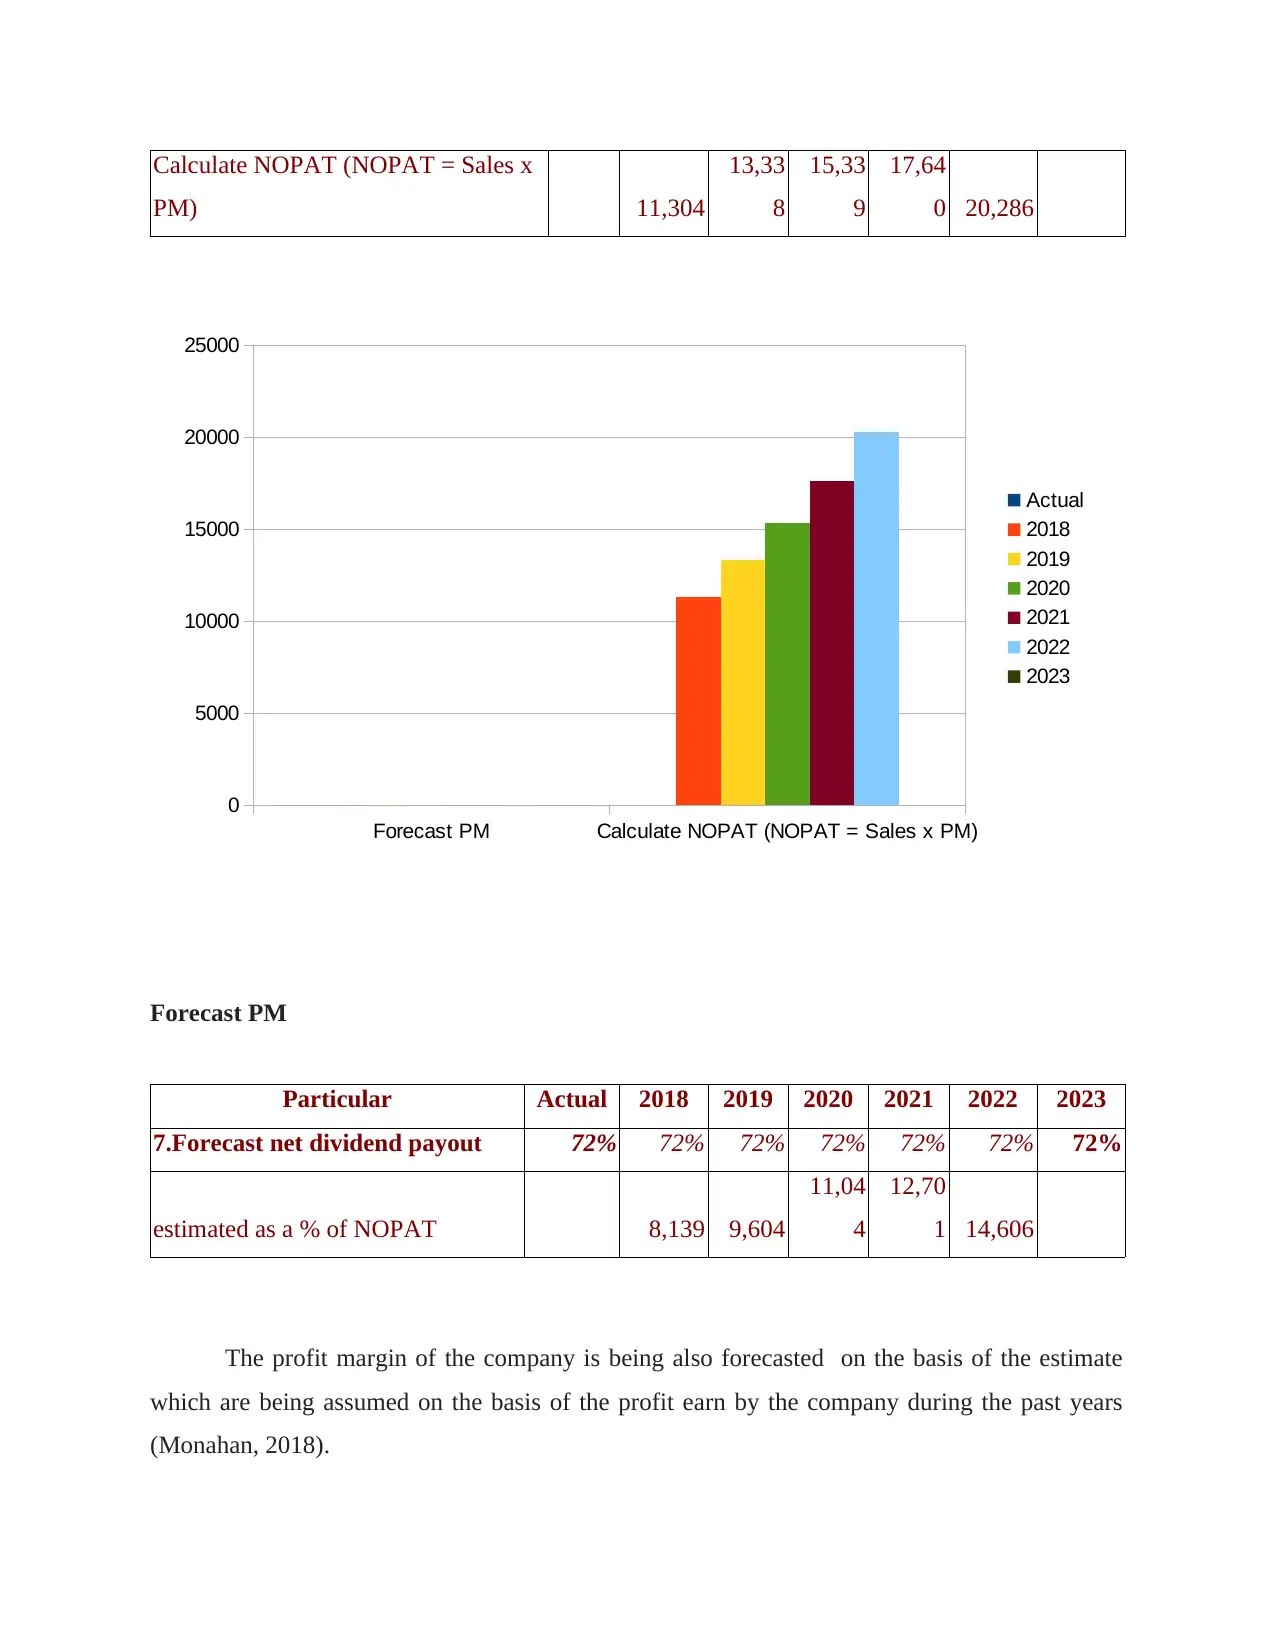
Calculate NOPAT (NOPAT = Sales x
PM) 11,304
13,33
8
15,33
9
17,64
0 20,286
Forecast PM
Particular Actual 2018 2019 2020 2021 2022 2023
7.Forecast net dividend payout 72% 72% 72% 72% 72% 72% 72%
estimated as a % of NOPAT 8,139 9,604
11,04
4
12,70
1 14,606
The profit margin of the company is being also forecasted on the basis of the estimate
which are being assumed on the basis of the profit earn by the company during the past years
(Monahan, 2018).
Forecast PM Calculate NOPAT (NOPAT = Sales x PM)
0
5000
10000
15000
20000
25000
Actual
2018
2019
2020
2021
2022
2023
⊘ This is a preview!⊘
Do you want full access?
Subscribe today to unlock all pages.
Trusted by 1+ million students worldwide
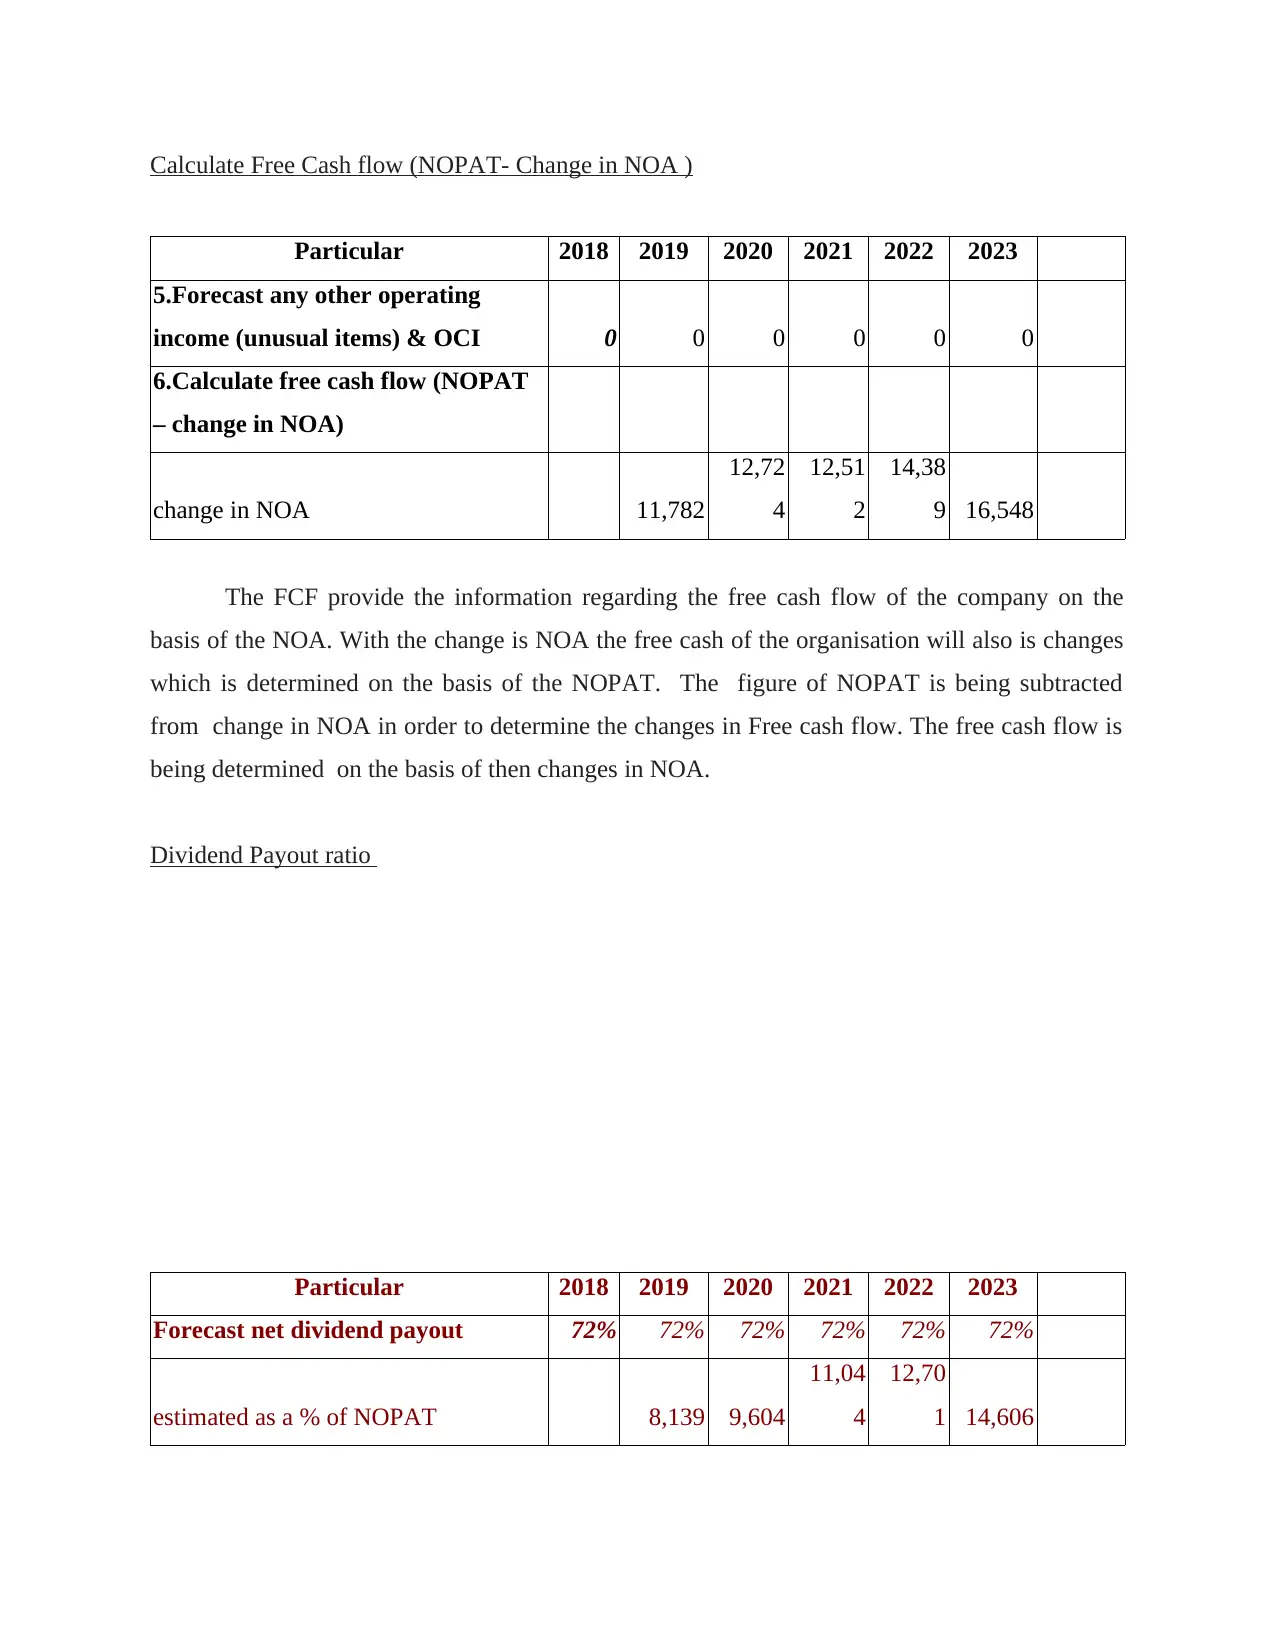
Calculate Free Cash flow (NOPAT- Change in NOA )
Particular 2018 2019 2020 2021 2022 2023
5.Forecast any other operating
income (unusual items) & OCI 0 0 0 0 0 0
6.Calculate free cash flow (NOPAT
– change in NOA)
change in NOA 11,782
12,72
4
12,51
2
14,38
9 16,548
The FCF provide the information regarding the free cash flow of the company on the
basis of the NOA. With the change is NOA the free cash of the organisation will also is changes
which is determined on the basis of the NOPAT. The figure of NOPAT is being subtracted
from change in NOA in order to determine the changes in Free cash flow. The free cash flow is
being determined on the basis of then changes in NOA.
Dividend Payout ratio
Particular 2018 2019 2020 2021 2022 2023
Forecast net dividend payout 72% 72% 72% 72% 72% 72%
estimated as a % of NOPAT 8,139 9,604
11,04
4
12,70
1 14,606
Particular 2018 2019 2020 2021 2022 2023
5.Forecast any other operating
income (unusual items) & OCI 0 0 0 0 0 0
6.Calculate free cash flow (NOPAT
– change in NOA)
change in NOA 11,782
12,72
4
12,51
2
14,38
9 16,548
The FCF provide the information regarding the free cash flow of the company on the
basis of the NOA. With the change is NOA the free cash of the organisation will also is changes
which is determined on the basis of the NOPAT. The figure of NOPAT is being subtracted
from change in NOA in order to determine the changes in Free cash flow. The free cash flow is
being determined on the basis of then changes in NOA.
Dividend Payout ratio
Particular 2018 2019 2020 2021 2022 2023
Forecast net dividend payout 72% 72% 72% 72% 72% 72%
estimated as a % of NOPAT 8,139 9,604
11,04
4
12,70
1 14,606
Paraphrase This Document
Need a fresh take? Get an instant paraphrase of this document with our AI Paraphraser
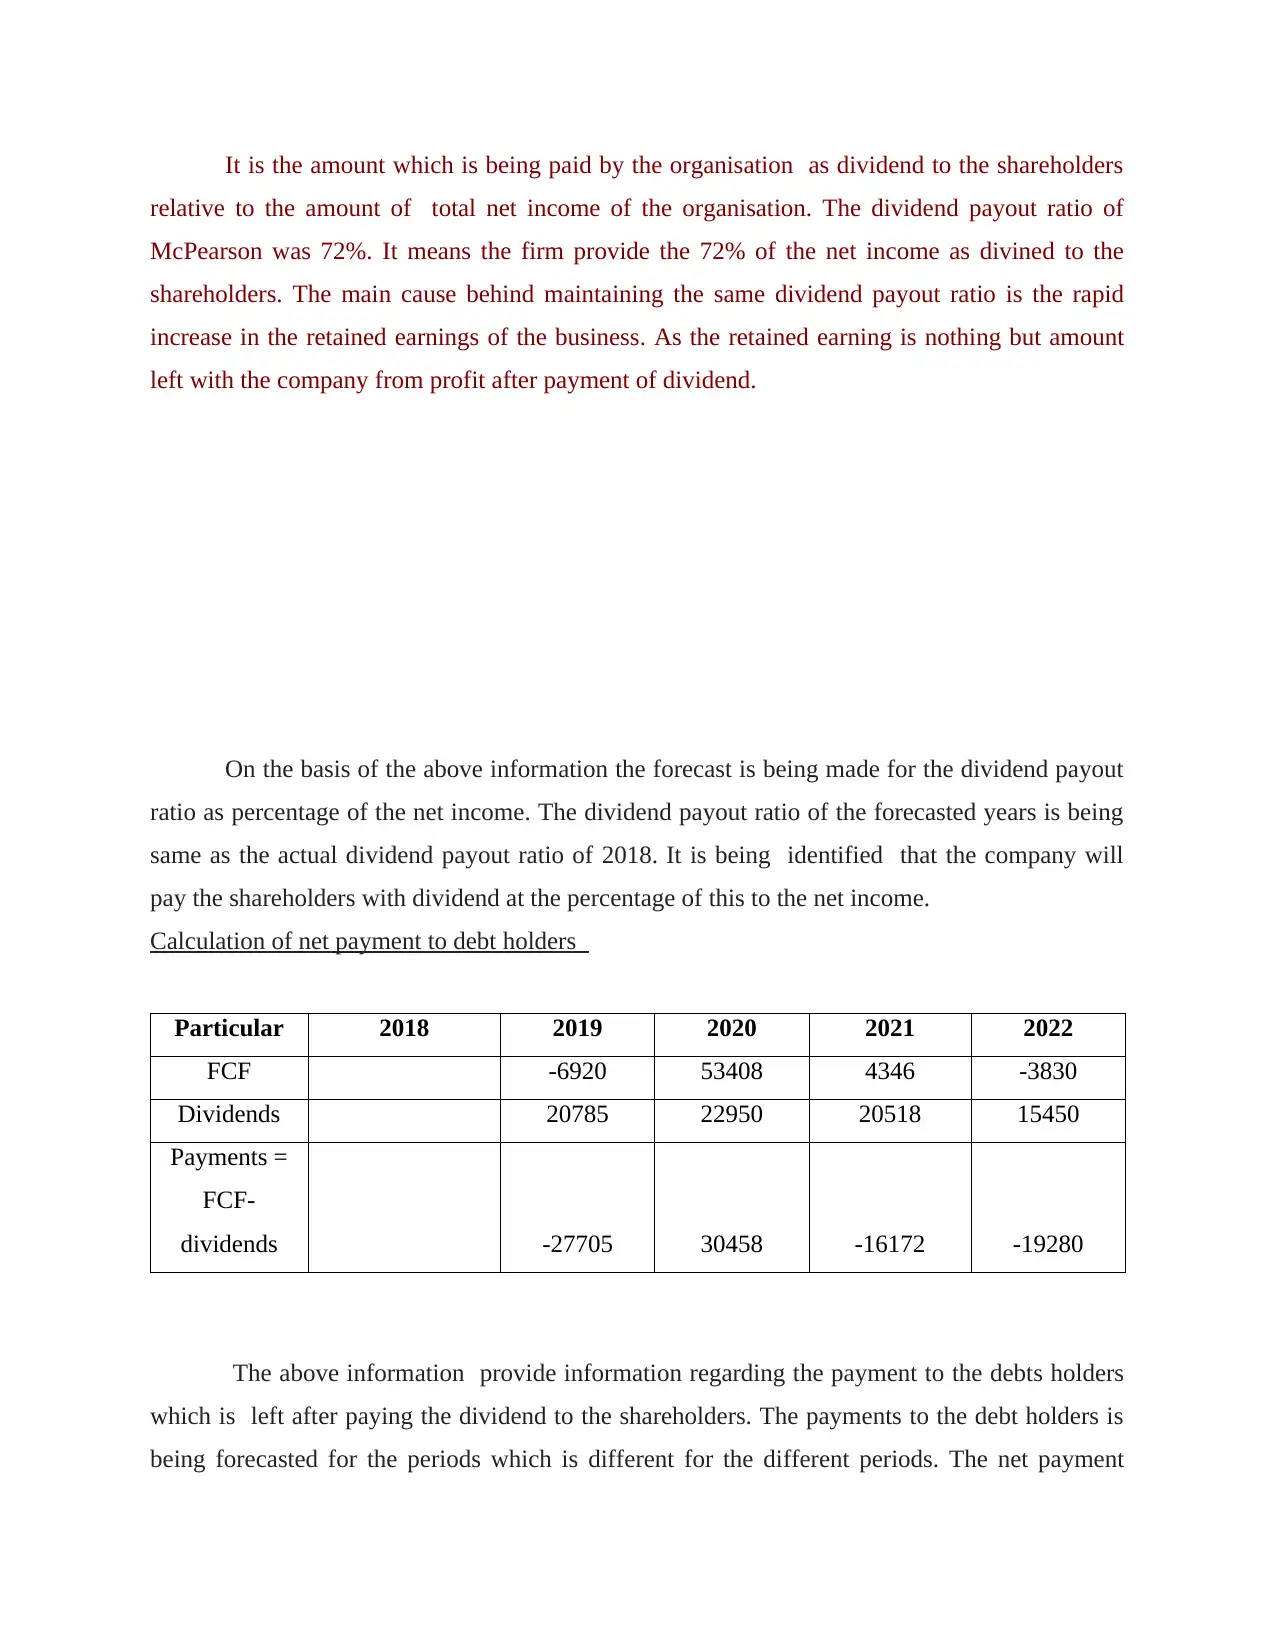
It is the amount which is being paid by the organisation as dividend to the shareholders
relative to the amount of total net income of the organisation. The dividend payout ratio of
McPearson was 72%. It means the firm provide the 72% of the net income as divined to the
shareholders. The main cause behind maintaining the same dividend payout ratio is the rapid
increase in the retained earnings of the business. As the retained earning is nothing but amount
left with the company from profit after payment of dividend.
On the basis of the above information the forecast is being made for the dividend payout
ratio as percentage of the net income. The dividend payout ratio of the forecasted years is being
same as the actual dividend payout ratio of 2018. It is being identified that the company will
pay the shareholders with dividend at the percentage of this to the net income.
Calculation of net payment to debt holders
Particular 2018 2019 2020 2021 2022
FCF -6920 53408 4346 -3830
Dividends 20785 22950 20518 15450
Payments =
FCF-
dividends -27705 30458 -16172 -19280
The above information provide information regarding the payment to the debts holders
which is left after paying the dividend to the shareholders. The payments to the debt holders is
being forecasted for the periods which is different for the different periods. The net payment
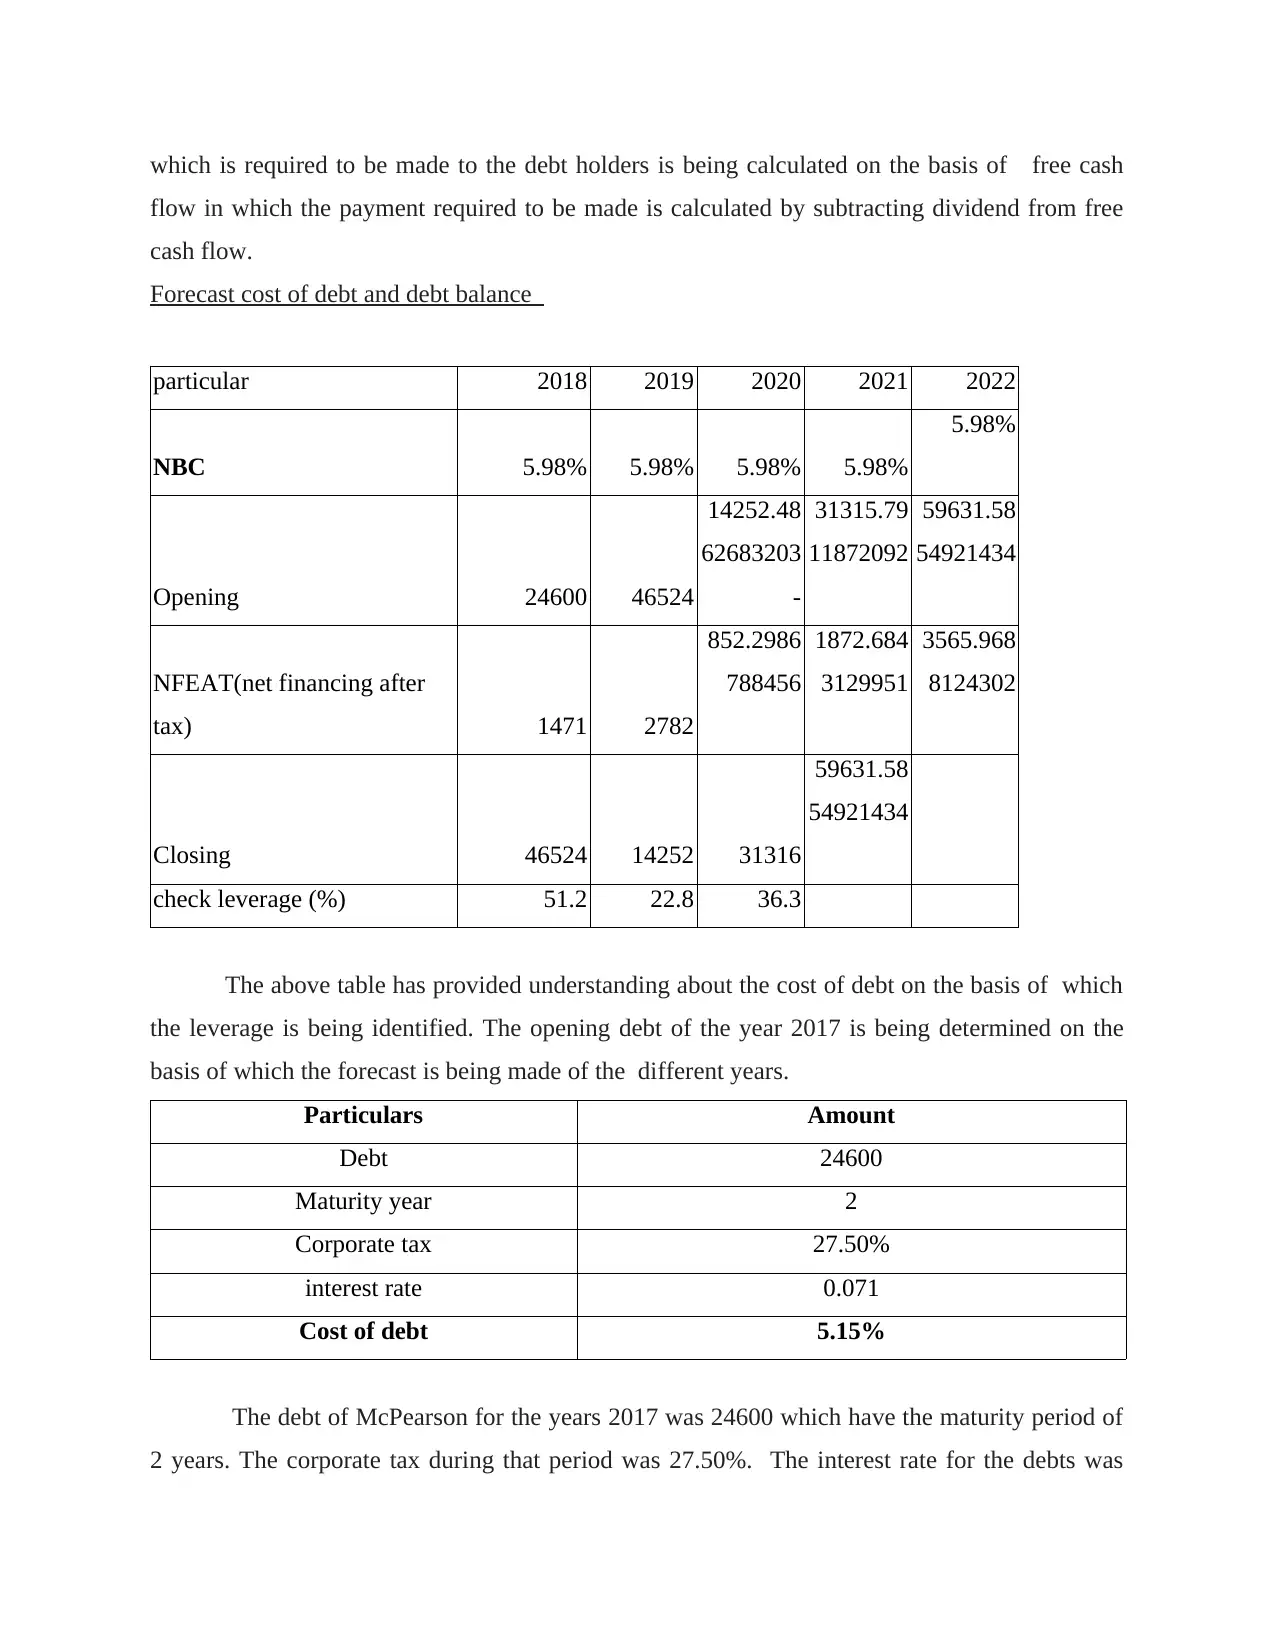
which is required to be made to the debt holders is being calculated on the basis of free cash
flow in which the payment required to be made is calculated by subtracting dividend from free
cash flow.
Forecast cost of debt and debt balance
particular 2018 2019 2020 2021 2022
NBC 5.98% 5.98% 5.98% 5.98%
5.98%
Opening 24600 46524
14252.48
62683203
-
31315.79
11872092
59631.58
54921434
NFEAT(net financing after
tax) 1471 2782
852.2986
788456
1872.684
3129951
3565.968
8124302
Closing 46524 14252 31316
59631.58
54921434
check leverage (%) 51.2 22.8 36.3
The above table has provided understanding about the cost of debt on the basis of which
the leverage is being identified. The opening debt of the year 2017 is being determined on the
basis of which the forecast is being made of the different years.
Particulars Amount
Debt 24600
Maturity year 2
Corporate tax 27.50%
interest rate 0.071
Cost of debt 5.15%
The debt of McPearson for the years 2017 was 24600 which have the maturity period of
2 years. The corporate tax during that period was 27.50%. The interest rate for the debts was
⊘ This is a preview!⊘
Do you want full access?
Subscribe today to unlock all pages.
Trusted by 1+ million students worldwide
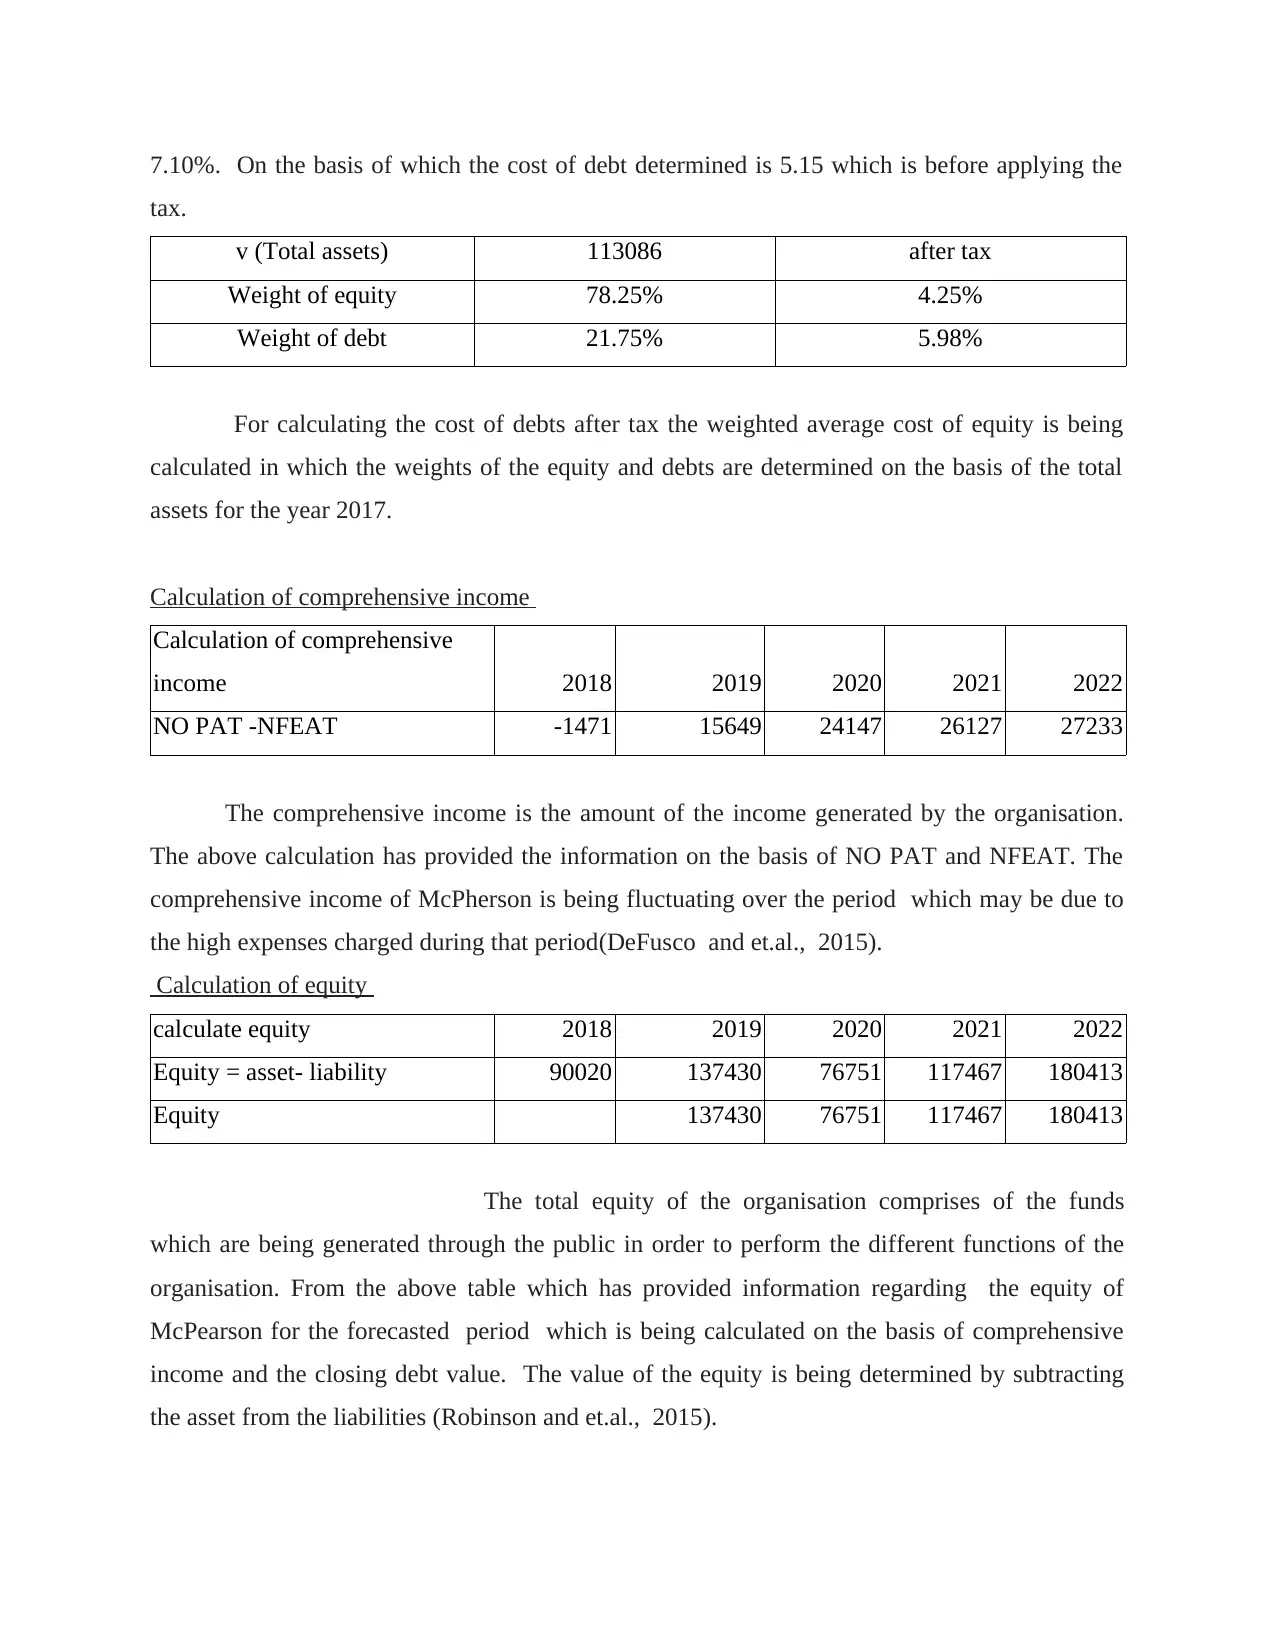
7.10%. On the basis of which the cost of debt determined is 5.15 which is before applying the
tax.
v (Total assets) 113086 after tax
Weight of equity 78.25% 4.25%
Weight of debt 21.75% 5.98%
For calculating the cost of debts after tax the weighted average cost of equity is being
calculated in which the weights of the equity and debts are determined on the basis of the total
assets for the year 2017.
Calculation of comprehensive income
Calculation of comprehensive
income 2018 2019 2020 2021 2022
NO PAT -NFEAT -1471 15649 24147 26127 27233
The comprehensive income is the amount of the income generated by the organisation.
The above calculation has provided the information on the basis of NO PAT and NFEAT. The
comprehensive income of McPherson is being fluctuating over the period which may be due to
the high expenses charged during that period(DeFusco and et.al., 2015).
Calculation of equity
calculate equity 2018 2019 2020 2021 2022
Equity = asset- liability 90020 137430 76751 117467 180413
Equity 137430 76751 117467 180413
The total equity of the organisation comprises of the funds
which are being generated through the public in order to perform the different functions of the
organisation. From the above table which has provided information regarding the equity of
McPearson for the forecasted period which is being calculated on the basis of comprehensive
income and the closing debt value. The value of the equity is being determined by subtracting
the asset from the liabilities (Robinson and et.al., 2015).
Paraphrase This Document
Need a fresh take? Get an instant paraphrase of this document with our AI Paraphraser
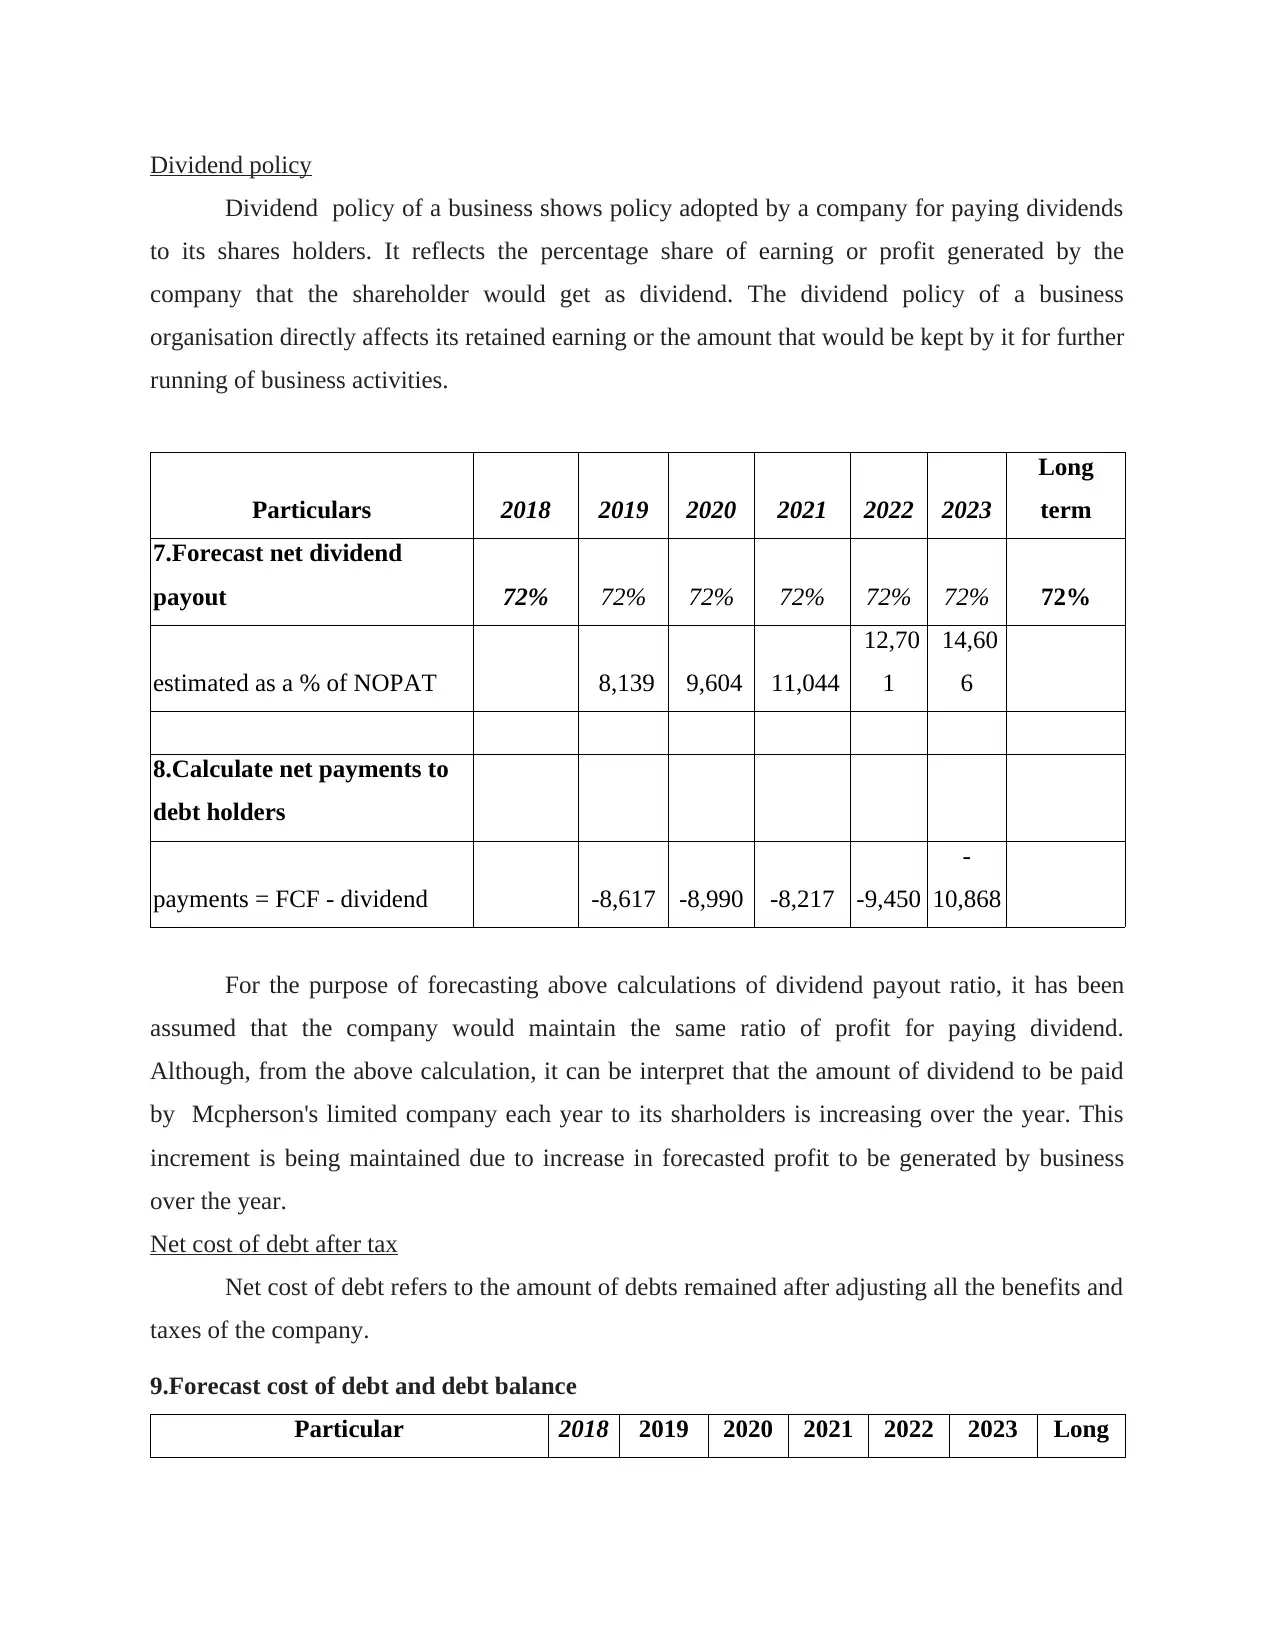
Dividend policy
Dividend policy of a business shows policy adopted by a company for paying dividends
to its shares holders. It reflects the percentage share of earning or profit generated by the
company that the shareholder would get as dividend. The dividend policy of a business
organisation directly affects its retained earning or the amount that would be kept by it for further
running of business activities.
Particulars 2018 2019 2020 2021 2022 2023
Long
term
7.Forecast net dividend
payout 72% 72% 72% 72% 72% 72% 72%
estimated as a % of NOPAT 8,139 9,604 11,044
12,70
1
14,60
6
8.Calculate net payments to
debt holders
payments = FCF - dividend -8,617 -8,990 -8,217 -9,450
-
10,868
For the purpose of forecasting above calculations of dividend payout ratio, it has been
assumed that the company would maintain the same ratio of profit for paying dividend.
Although, from the above calculation, it can be interpret that the amount of dividend to be paid
by Mcpherson's limited company each year to its sharholders is increasing over the year. This
increment is being maintained due to increase in forecasted profit to be generated by business
over the year.
Net cost of debt after tax
Net cost of debt refers to the amount of debts remained after adjusting all the benefits and
taxes of the company.
9.Forecast cost of debt and debt balance
Particular 2018 2019 2020 2021 2022 2023 Long
term
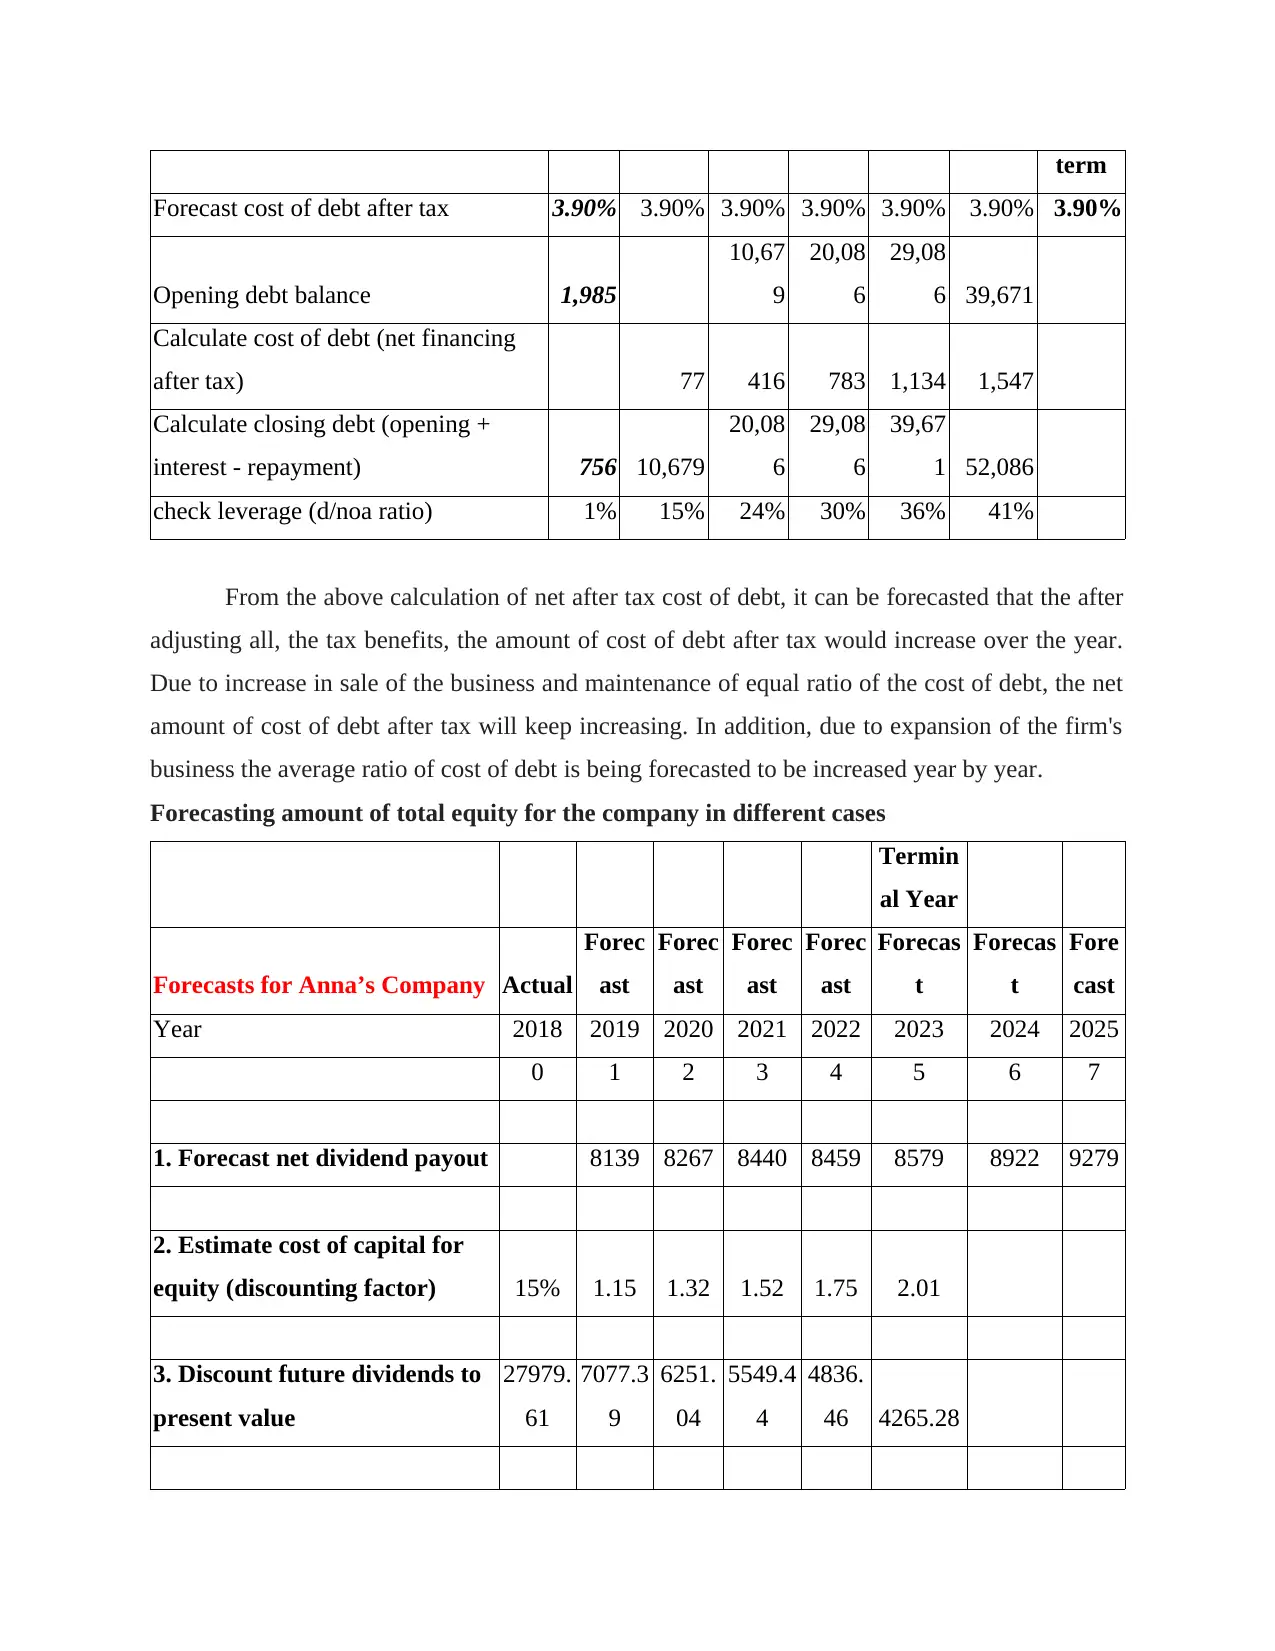
Forecast cost of debt after tax 3.90% 3.90% 3.90% 3.90% 3.90% 3.90% 3.90%
Opening debt balance 1,985
10,67
9
20,08
6
29,08
6 39,671
Calculate cost of debt (net financing
after tax) 77 416 783 1,134 1,547
Calculate closing debt (opening +
interest - repayment) 756 10,679
20,08
6
29,08
6
39,67
1 52,086
check leverage (d/noa ratio) 1% 15% 24% 30% 36% 41%
From the above calculation of net after tax cost of debt, it can be forecasted that the after
adjusting all, the tax benefits, the amount of cost of debt after tax would increase over the year.
Due to increase in sale of the business and maintenance of equal ratio of the cost of debt, the net
amount of cost of debt after tax will keep increasing. In addition, due to expansion of the firm's
business the average ratio of cost of debt is being forecasted to be increased year by year.
Forecasting amount of total equity for the company in different cases
Termin
al Year
Forecasts for Anna’s Company Actual
Forec
ast
Forec
ast
Forec
ast
Forec
ast
Forecas
t
Forecas
t
Fore
cast
Year 2018 2019 2020 2021 2022 2023 2024 2025
0 1 2 3 4 5 6 7
1. Forecast net dividend payout 8139 8267 8440 8459 8579 8922 9279
2. Estimate cost of capital for
equity (discounting factor) 15% 1.15 1.32 1.52 1.75 2.01
3. Discount future dividends to
present value
27979.
61
7077.3
9
6251.
04
5549.4
4
4836.
46 4265.28
⊘ This is a preview!⊘
Do you want full access?
Subscribe today to unlock all pages.
Trusted by 1+ million students worldwide
1 out of 26
Related Documents


Your All-in-One AI-Powered Toolkit for Academic Success.
+13062052269
info@desklib.com
Available 24*7 on WhatsApp / Email
![[object Object]](/_next/static/media/star-bottom.7253800d.svg)
Unlock your academic potential
Copyright © 2020–2026 A2Z Services. All Rights Reserved. Developed and managed by ZUCOL.