Financial Analysis and Performance of Medibank Private Limited Report
VerifiedAdded on 2023/05/28
|20
|4530
|491
Report
AI Summary
This report provides a comprehensive financial analysis of Medibank Private Limited (MPL). It begins with an executive summary and introduction to the company, including its historical background and market position. The core of the report focuses on financial ratio analysis, including liquidity ratios (current and quick ratios), profitability ratios (ROCE, gross profit margin, and net profit margin), and market value ratios (earnings per share and price to earnings ratio). The report also compares Medibank's share price movements with the All-Ordinaries Index and discusses the cost of equity using the Capital Asset Pricing Model (CAPM). The capital structure of the company is also analyzed. The analysis covers the trend period of 2016-2018, providing insights into MPL's financial performance and trends. The report concludes with recommendations based on the findings.
Running head: BUSINESS FINANCE
Business Finance
Name of the Student:
Name of the University:
Author’s Note:
Business Finance
Name of the Student:
Name of the University:
Author’s Note:
Paraphrase This Document
Need a fresh take? Get an instant paraphrase of this document with our AI Paraphraser
1MEDIBANK PRIVATE LIMITED
Executive Summary
The aim of the assignment is to conduct a financial analysis on the Medibank Private Limited
and the relevant financial performance of the company. The background of the company was
studied and the relevant research, which included the historical background of the company, was
evaluated. The financial analysis of the company was conducted with the help of the ratio
analysis and the relevant analysis was evaluated. The expected return on the stock was calculated
using the Capital Asset Pricing Model and the relevant analysis for the company was conducted
with the help of the same. The capital structure of the company was analyzed and the relevant
analysis for the company was conducted for the company for the trend period of 2016-18.
2MEDIBANK PRIVATE LIMITED
Table of Contents
Introduction......................................................................................................................................3
Discussion........................................................................................................................................4
Financial Ratio.............................................................................................................................4
Liquidity Ratio.........................................................................................................................4
Profitability Ratio....................................................................................................................6
Market Value Ratio..................................................................................................................8
Comparison of Share Price Movements......................................................................................9
Cost of Equity............................................................................................................................11
Capital Structure........................................................................................................................12
Conclusion.....................................................................................................................................14
Recommendations..........................................................................................................................14
Reference.......................................................................................................................................16
⊘ This is a preview!⊘
Do you want full access?
Subscribe today to unlock all pages.
Trusted by 1+ million students worldwide
3MEDIBANK PRIVATE LIMITED
Introduction
The Medibank Private Limited is a national private health insurance company located in
the Australia. Medibank is the second largest company in the insurance sector after Bupa
Insurance Company having a market share of around 29.1%. The company is listed on the
Australia Stock Exchange with the ticker symbol MPL. The Medibank Company started as a
private limited company in the year 1975 with the aim of providing health services in the
Australia (Cucchiella, D’Adamo and Gastaldi 2015). The company provides the insurance
services in the various filed including health, travel, pet insurance, life insurance and various
other products and services. The company has a wide range of diversified portfolio including
various products and services, which makes the revenue baser of the company diversified (Vogel
2014). The company has a subsidiary company operating in the health services as Australian
Health Management. The company is having a good base of employees with an all-2700
employee in the organization. The financial statement of the company was analyzed and the
relevant financial performance of the company was analyzed using the ratio analysis for
evaluating the financial performance of the company from the year 2016-2018 (Al Nimer,
Warrad and Al Omari 2015). The liquidity position of the company and the profitability position
in the company plays an important role and the same has been evaluated using the financial year
report of the company. The market value ratio of the company was evaluated for assessing the
pricing and the valuation of the company in terms of Price to Earnings Ratio and the earning per
share of the company. The expected return for a company is evaluated with the help of the
Capital Asset pricing model and the same was evaluated for the company by incorporating the
Return generated from the market and the risk free rate in the Australian economy. The relevant
beta of the Medibank Private Ltd in order to find out the expected return of the stock.
Paraphrase This Document
Need a fresh take? Get an instant paraphrase of this document with our AI Paraphraser
4MEDIBANK PRIVATE LIMITED
Discussion
Financial Ratio
The financial ratios for the company was evaluated using the financial year report of the
company and the relevant analysis of the company was evaluated for the period 2016-2018. The
financial performance of the company in terms of the profitability condition, liquidity position of
the company and the market value of the company was analyses. Ratio analysis is an efficient
quantitative assessment tool, which helps us analyze and evaluate the financial performance of
the company and help us evaluate the trend followed by the company. The graphical analysis
was conducted for the company under the trend period analyzed for the company (Waemustafa
and Sukri 2016).
Liquidity Ratio
The liquidity ratio of the company shows the ability of the company’s ability to meet the
short-term obligations of the company. The common liquidity ratio analyzed for the company
was Current Ratio and Quick Ratio for the trend period 2016-17 and 2017-18 (Heikal, Khaddafi
and Ummah 2014).
Current Ratio: (Current Assets/Current Liabilities)
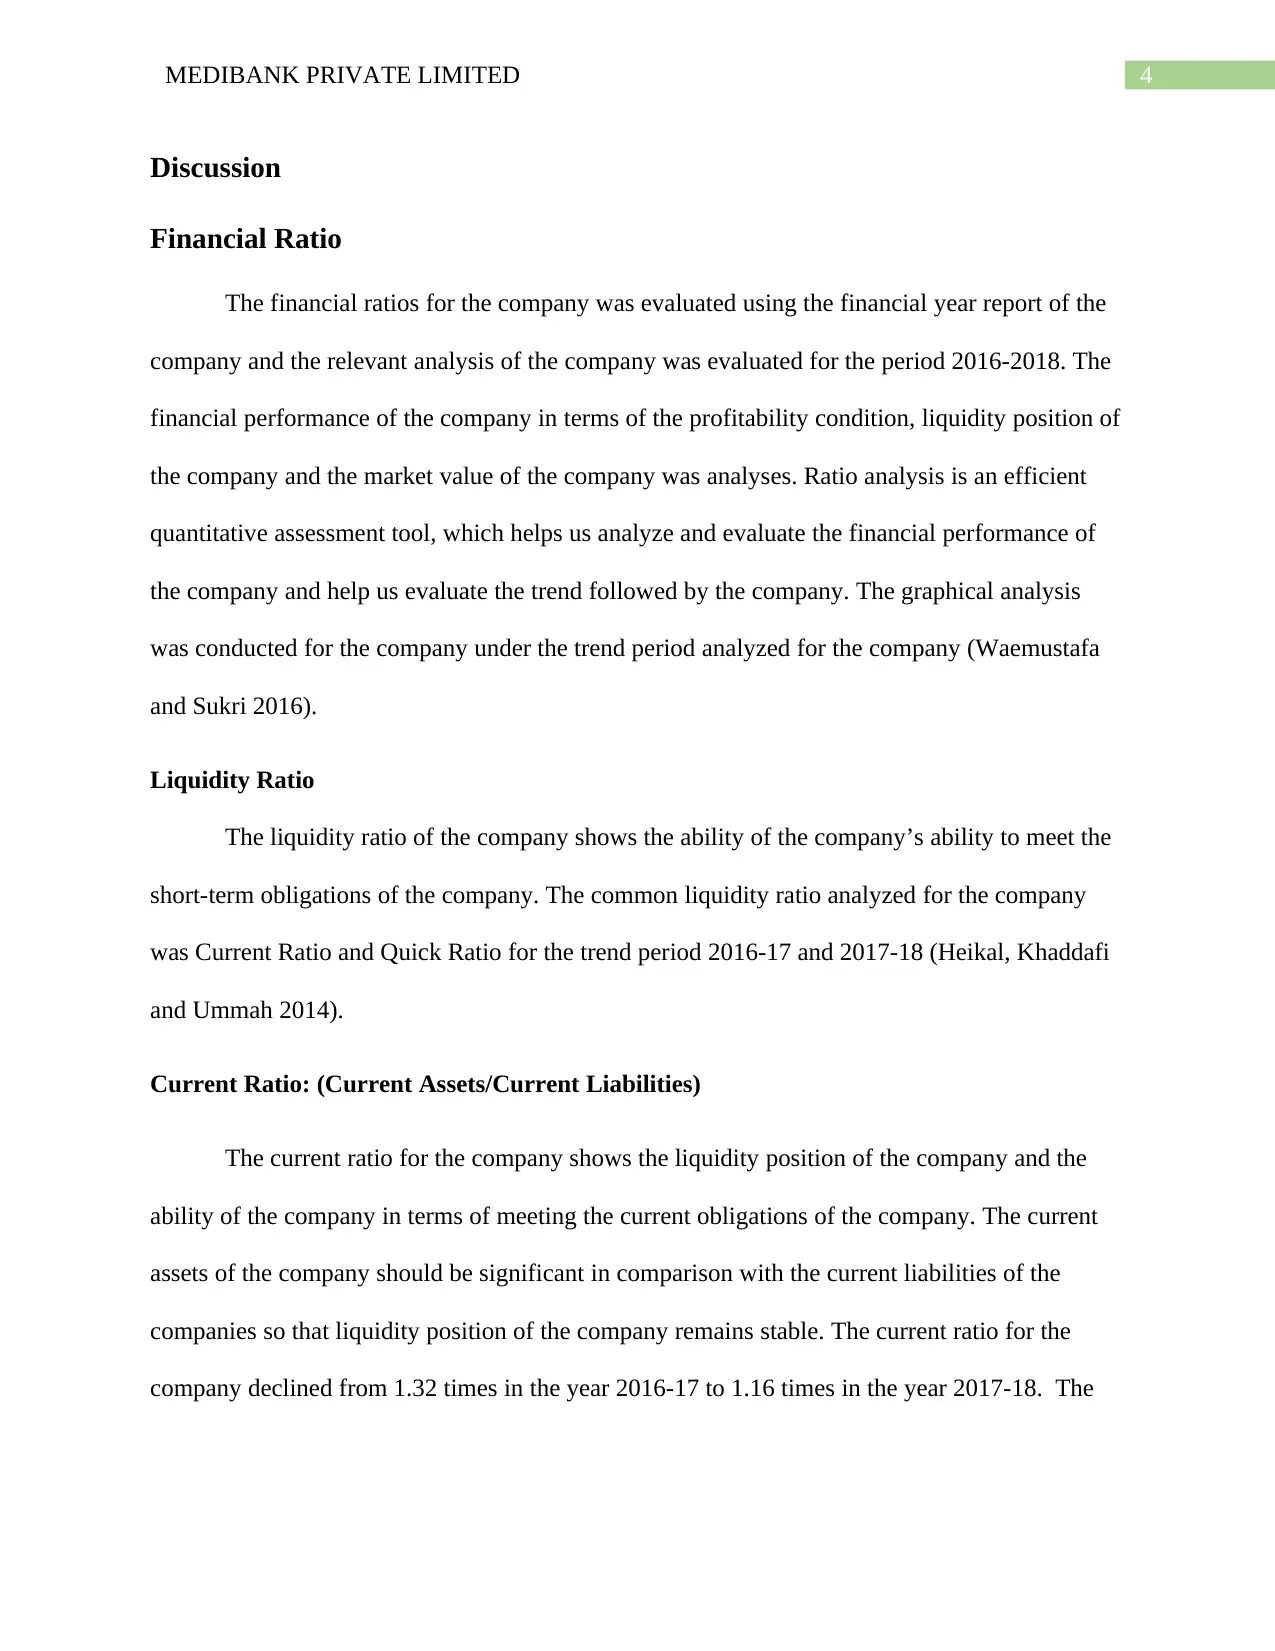
The current ratio for the company shows the liquidity position of the company and the
ability of the company in terms of meeting the current obligations of the company. The current
assets of the company should be significant in comparison with the current liabilities of the
companies so that liquidity position of the company remains stable. The current ratio for the
company declined from 1.32 times in the year 2016-17 to 1.16 times in the year 2017-18. The
Discussion
Financial Ratio
The financial ratios for the company was evaluated using the financial year report of the
company and the relevant analysis of the company was evaluated for the period 2016-2018. The
financial performance of the company in terms of the profitability condition, liquidity position of
the company and the market value of the company was analyses. Ratio analysis is an efficient
quantitative assessment tool, which helps us analyze and evaluate the financial performance of
the company and help us evaluate the trend followed by the company. The graphical analysis
was conducted for the company under the trend period analyzed for the company (Waemustafa
and Sukri 2016).
Liquidity Ratio
The liquidity ratio of the company shows the ability of the company’s ability to meet the
short-term obligations of the company. The common liquidity ratio analyzed for the company
was Current Ratio and Quick Ratio for the trend period 2016-17 and 2017-18 (Heikal, Khaddafi
and Ummah 2014).
Current Ratio: (Current Assets/Current Liabilities)
The current ratio for the company shows the liquidity position of the company and the
ability of the company in terms of meeting the current obligations of the company. The current
assets of the company should be significant in comparison with the current liabilities of the
companies so that liquidity position of the company remains stable. The current ratio for the
company declined from 1.32 times in the year 2016-17 to 1.16 times in the year 2017-18. The
5MEDIBANK PRIVATE LIMITED
liquidity position of the company declined in the trend period, which may hamper the operations
of the company (Katsouras et al. 2015).
Particulars 2016-17 2017-18
Liquidity Ratio
Current Assets 999300 896900
Current Liabilities 758900 772900
Workings =B26/B27 =C26/C27
Current Ratio 1.32 1.16
2016-17 2017-18
1.05
1.10
1.15
1.20
1.25
1.30
1.35
Current Ratio
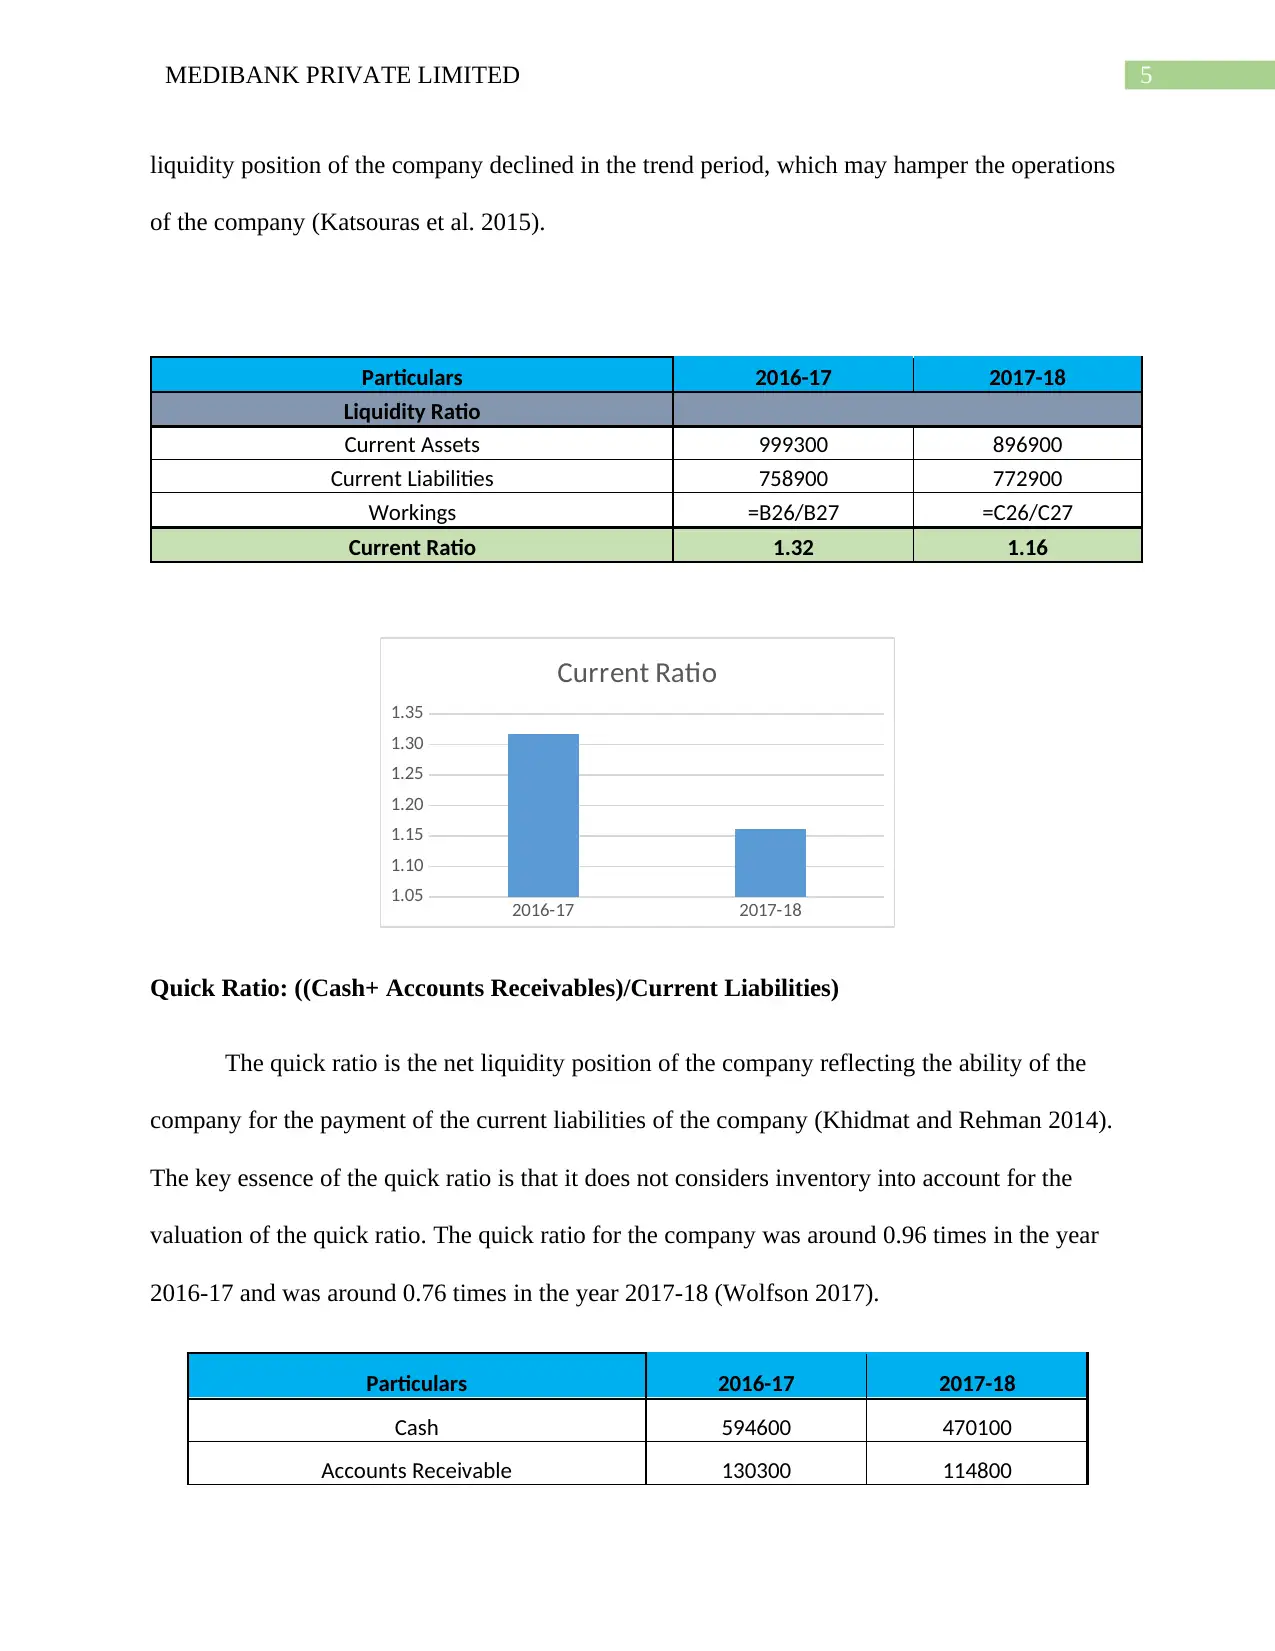
Quick Ratio: ((Cash+ Accounts Receivables)/Current Liabilities)
The quick ratio is the net liquidity position of the company reflecting the ability of the
company for the payment of the current liabilities of the company (Khidmat and Rehman 2014).
The key essence of the quick ratio is that it does not considers inventory into account for the
valuation of the quick ratio. The quick ratio for the company was around 0.96 times in the year
2016-17 and was around 0.76 times in the year 2017-18 (Wolfson 2017).
Particulars 2016-17 2017-18
Cash 594600 470100
Accounts Receivable 130300 114800
liquidity position of the company declined in the trend period, which may hamper the operations
of the company (Katsouras et al. 2015).
Particulars 2016-17 2017-18
Liquidity Ratio
Current Assets 999300 896900
Current Liabilities 758900 772900
Workings =B26/B27 =C26/C27
Current Ratio 1.32 1.16
2016-17 2017-18
1.05
1.10
1.15
1.20
1.25
1.30
1.35
Current Ratio
Quick Ratio: ((Cash+ Accounts Receivables)/Current Liabilities)
The quick ratio is the net liquidity position of the company reflecting the ability of the
company for the payment of the current liabilities of the company (Khidmat and Rehman 2014).
The key essence of the quick ratio is that it does not considers inventory into account for the
valuation of the quick ratio. The quick ratio for the company was around 0.96 times in the year
2016-17 and was around 0.76 times in the year 2017-18 (Wolfson 2017).
Particulars 2016-17 2017-18
Cash 594600 470100
Accounts Receivable 130300 114800
⊘ This is a preview!⊘
Do you want full access?
Subscribe today to unlock all pages.
Trusted by 1+ million students worldwide
6MEDIBANK PRIVATE LIMITED
Current Liabilities 758900 772900
Workings =(B31+B32)/B33 =(C31+C32)/C33
Quick Ratio 0.96 0.76
2016-17 2017-18
0.00
0.20
0.40
0.60
0.80
1.00
1.20
Quick Ratio
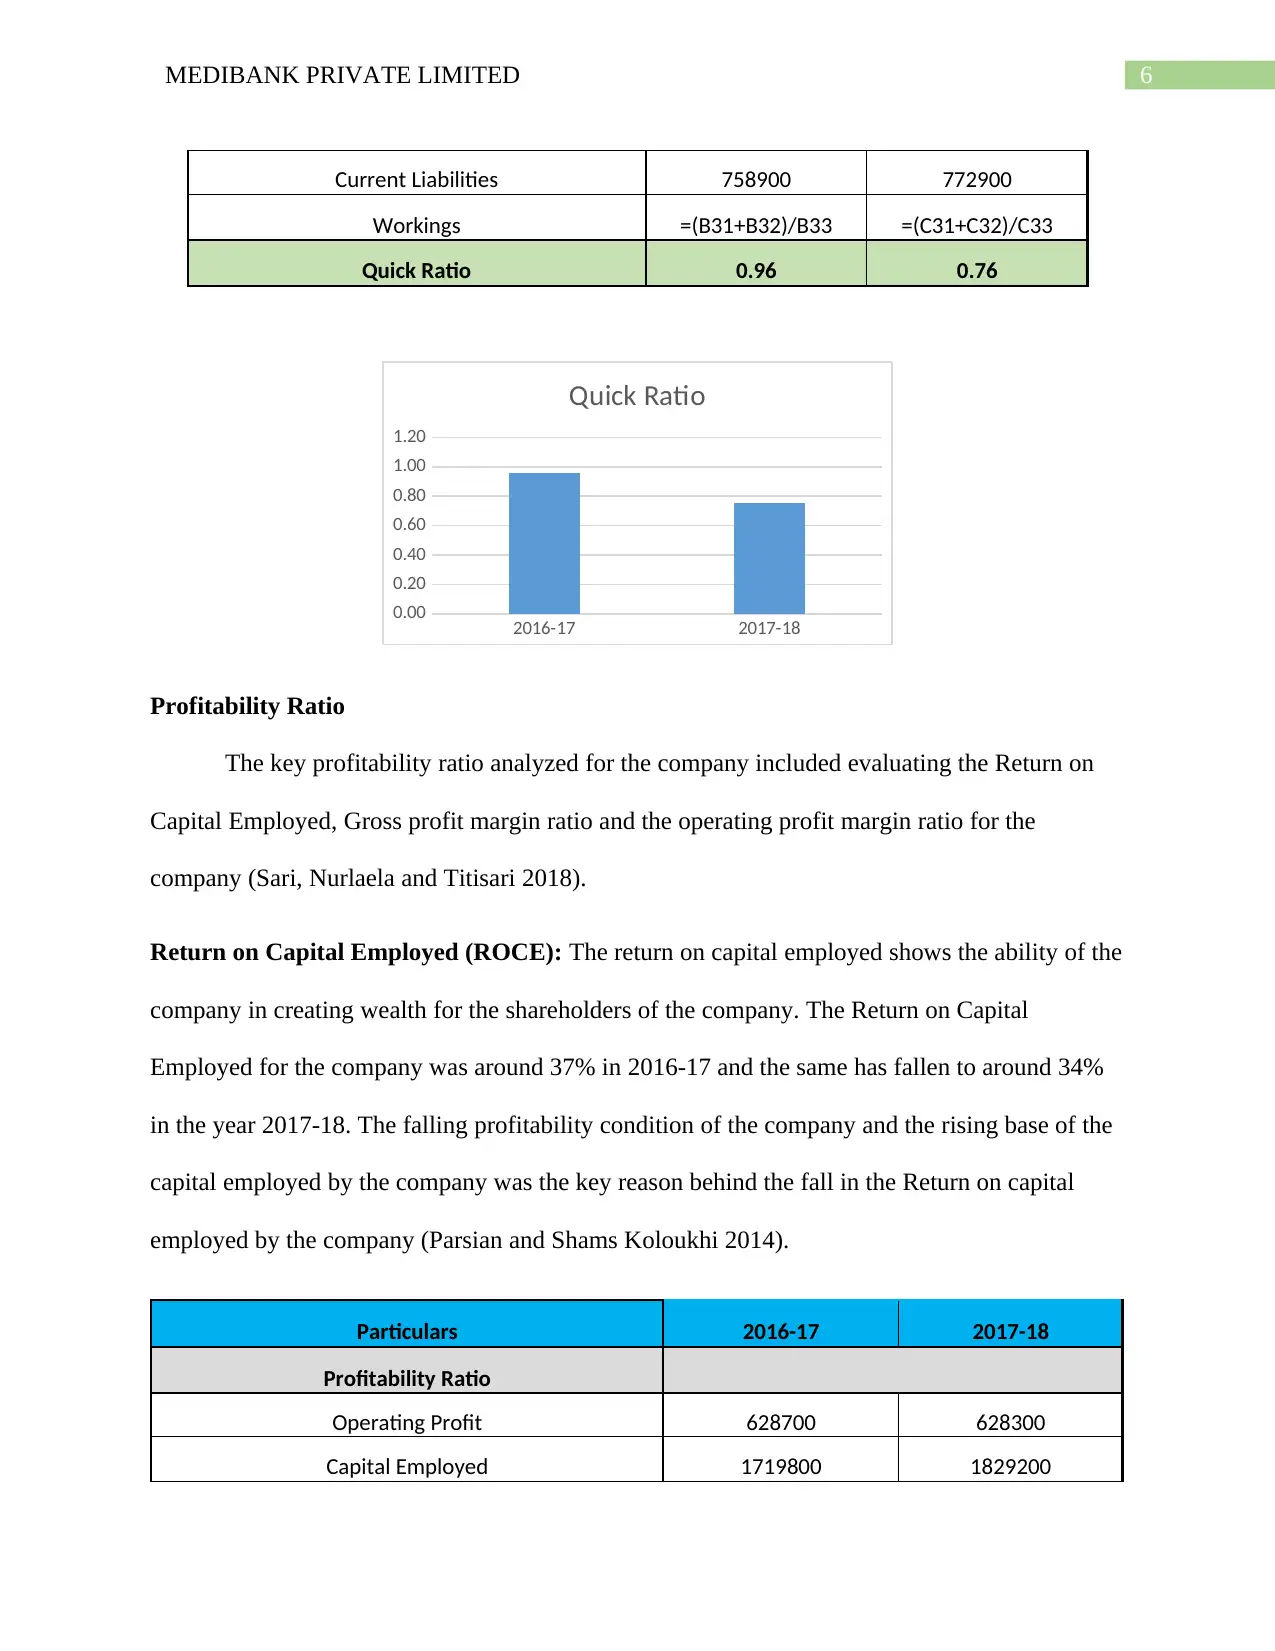
Profitability Ratio
The key profitability ratio analyzed for the company included evaluating the Return on
Capital Employed, Gross profit margin ratio and the operating profit margin ratio for the
company (Sari, Nurlaela and Titisari 2018).
Return on Capital Employed (ROCE): The return on capital employed shows the ability of the
company in creating wealth for the shareholders of the company. The Return on Capital
Employed for the company was around 37% in 2016-17 and the same has fallen to around 34%
in the year 2017-18. The falling profitability condition of the company and the rising base of the
capital employed by the company was the key reason behind the fall in the Return on capital
employed by the company (Parsian and Shams Koloukhi 2014).
Particulars 2016-17 2017-18
Profitability Ratio
Operating Profit 628700 628300
Capital Employed 1719800 1829200
Current Liabilities 758900 772900
Workings =(B31+B32)/B33 =(C31+C32)/C33
Quick Ratio 0.96 0.76
2016-17 2017-18
0.00
0.20
0.40
0.60
0.80
1.00
1.20
Quick Ratio
Profitability Ratio
The key profitability ratio analyzed for the company included evaluating the Return on
Capital Employed, Gross profit margin ratio and the operating profit margin ratio for the
company (Sari, Nurlaela and Titisari 2018).
Return on Capital Employed (ROCE): The return on capital employed shows the ability of the
company in creating wealth for the shareholders of the company. The Return on Capital
Employed for the company was around 37% in 2016-17 and the same has fallen to around 34%
in the year 2017-18. The falling profitability condition of the company and the rising base of the
capital employed by the company was the key reason behind the fall in the Return on capital
employed by the company (Parsian and Shams Koloukhi 2014).
Particulars 2016-17 2017-18
Profitability Ratio
Operating Profit 628700 628300
Capital Employed 1719800 1829200
Paraphrase This Document
Need a fresh take? Get an instant paraphrase of this document with our AI Paraphraser
7MEDIBANK PRIVATE LIMITED
Workings =B10/B11 =C10/C11
Return on capital employed 37% 34%
2016-17 2017-18
33%
34%
35%
36%
37%
Return on capital employed
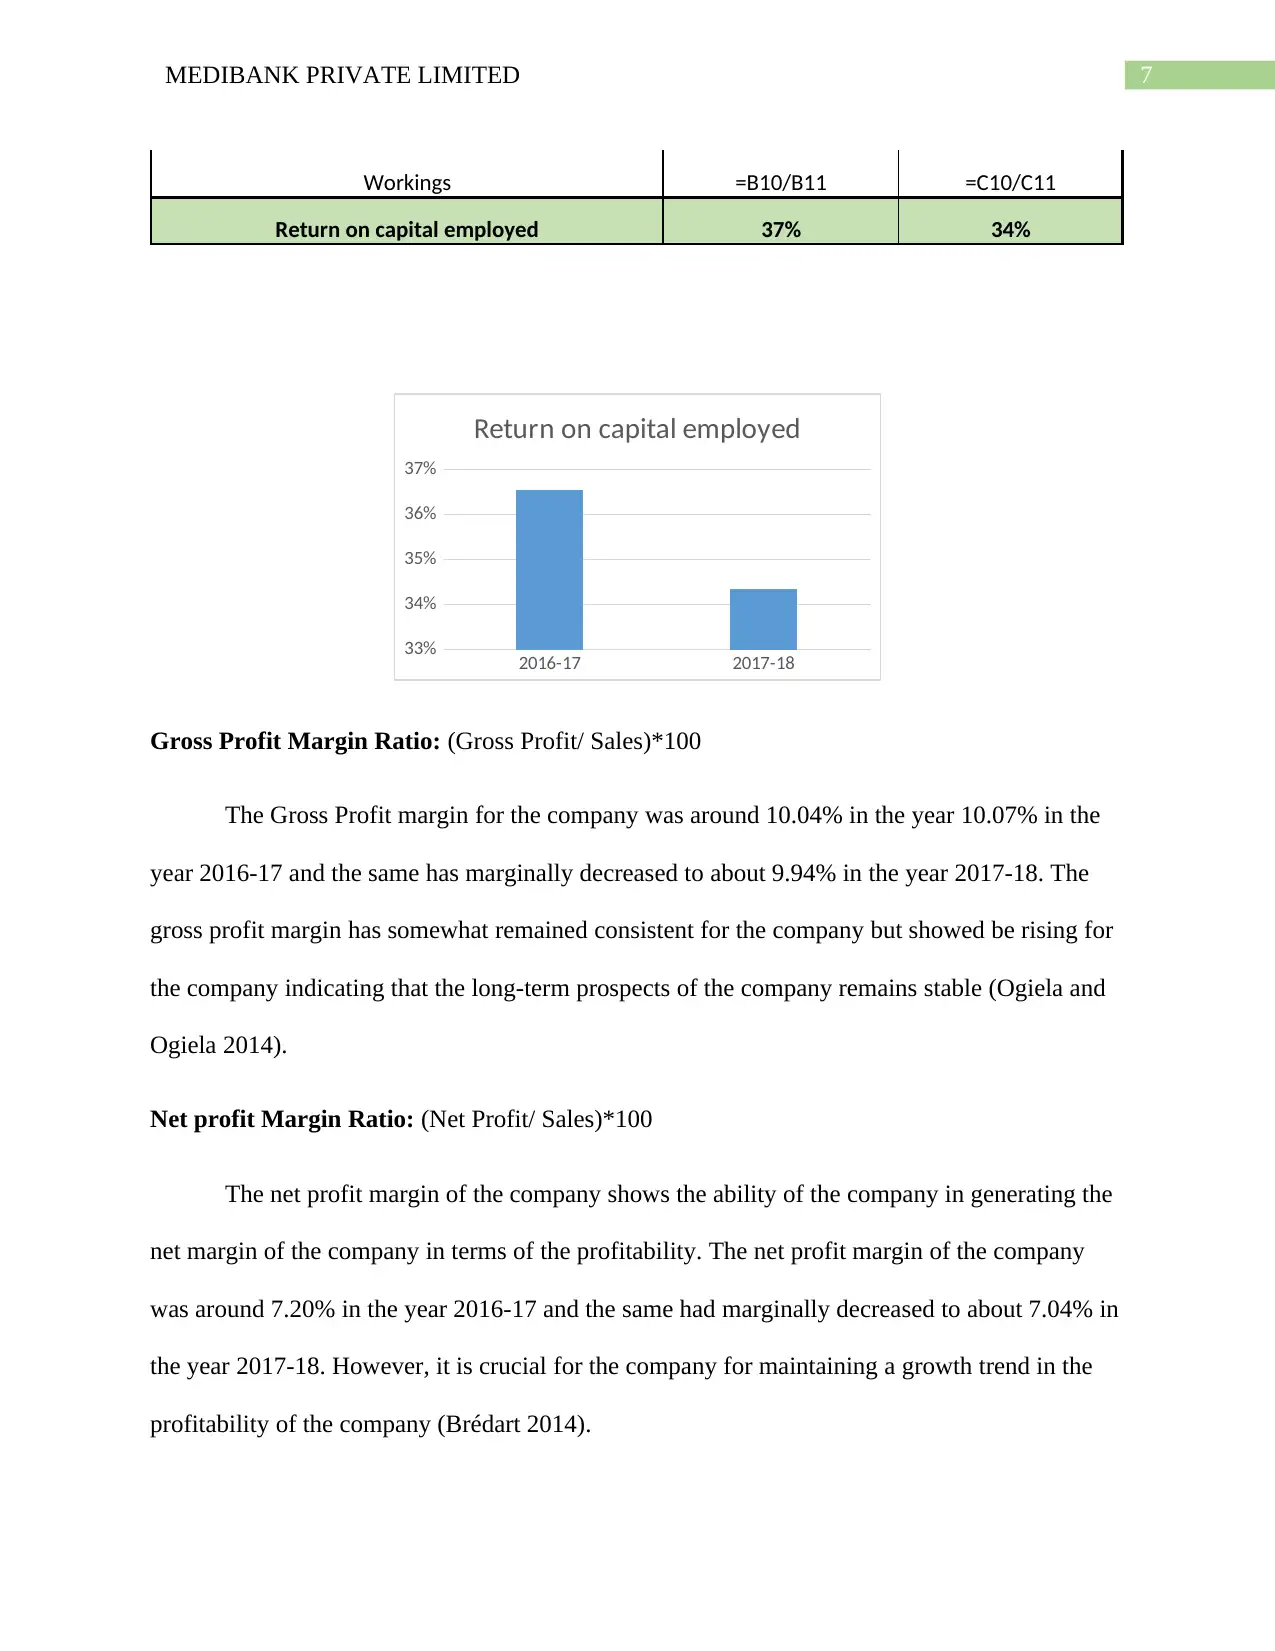
Gross Profit Margin Ratio: (Gross Profit/ Sales)*100
The Gross Profit margin for the company was around 10.04% in the year 10.07% in the
year 2016-17 and the same has marginally decreased to about 9.94% in the year 2017-18. The
gross profit margin has somewhat remained consistent for the company but showed be rising for
the company indicating that the long-term prospects of the company remains stable (Ogiela and
Ogiela 2014).
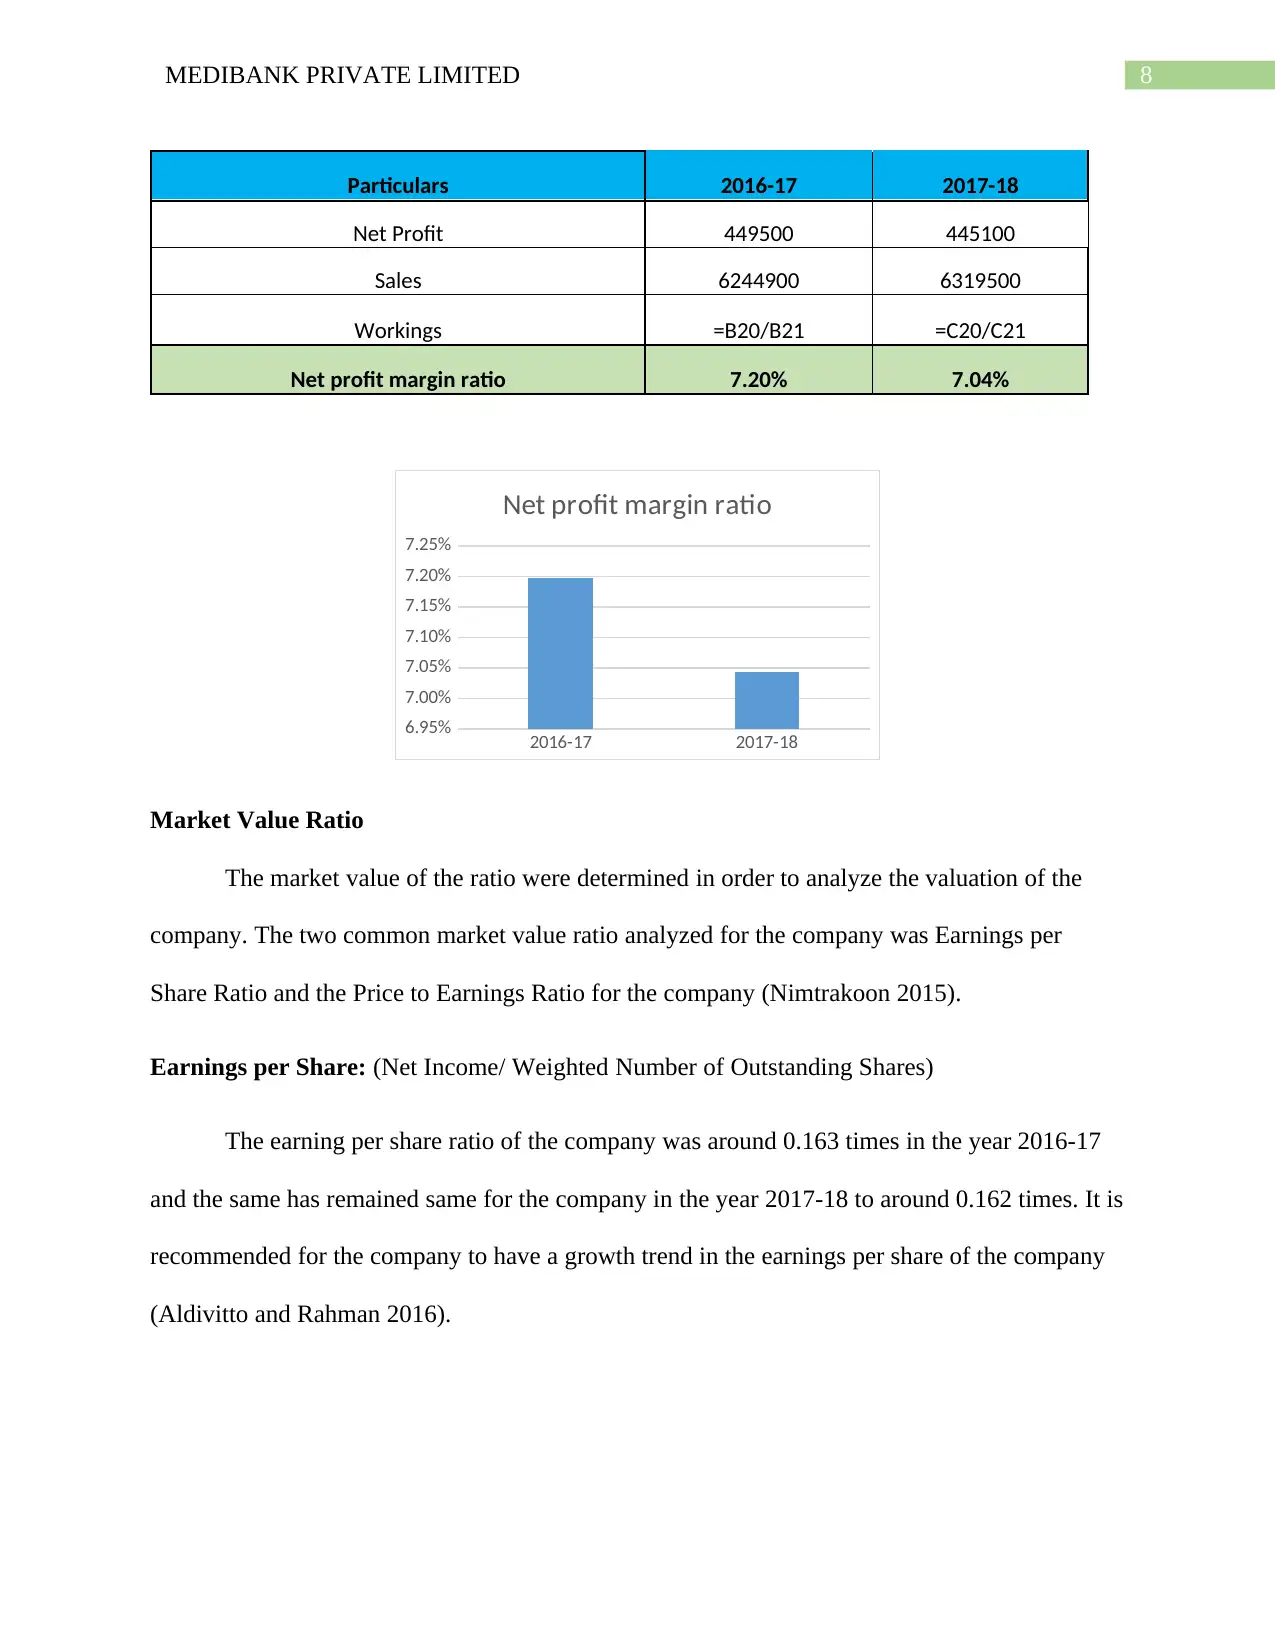
Net profit Margin Ratio: (Net Profit/ Sales)*100
The net profit margin of the company shows the ability of the company in generating the
net margin of the company in terms of the profitability. The net profit margin of the company
was around 7.20% in the year 2016-17 and the same had marginally decreased to about 7.04% in
the year 2017-18. However, it is crucial for the company for maintaining a growth trend in the
profitability of the company (Brédart 2014).
Workings =B10/B11 =C10/C11
Return on capital employed 37% 34%
2016-17 2017-18
33%
34%
35%
36%
37%
Return on capital employed
Gross Profit Margin Ratio: (Gross Profit/ Sales)*100
The Gross Profit margin for the company was around 10.04% in the year 10.07% in the
year 2016-17 and the same has marginally decreased to about 9.94% in the year 2017-18. The
gross profit margin has somewhat remained consistent for the company but showed be rising for
the company indicating that the long-term prospects of the company remains stable (Ogiela and
Ogiela 2014).
Net profit Margin Ratio: (Net Profit/ Sales)*100
The net profit margin of the company shows the ability of the company in generating the
net margin of the company in terms of the profitability. The net profit margin of the company
was around 7.20% in the year 2016-17 and the same had marginally decreased to about 7.04% in
the year 2017-18. However, it is crucial for the company for maintaining a growth trend in the
profitability of the company (Brédart 2014).
8MEDIBANK PRIVATE LIMITED
Particulars 2016-17 2017-18
Net Profit 449500 445100
Sales 6244900 6319500
Workings =B20/B21 =C20/C21
Net profit margin ratio 7.20% 7.04%
2016-17 2017-18
6.95%
7.00%
7.05%
7.10%
7.15%
7.20%
7.25%
Net profit margin ratio
Market Value Ratio
The market value of the ratio were determined in order to analyze the valuation of the
company. The two common market value ratio analyzed for the company was Earnings per
Share Ratio and the Price to Earnings Ratio for the company (Nimtrakoon 2015).
Earnings per Share: (Net Income/ Weighted Number of Outstanding Shares)
The earning per share ratio of the company was around 0.163 times in the year 2016-17
and the same has remained same for the company in the year 2017-18 to around 0.162 times. It is
recommended for the company to have a growth trend in the earnings per share of the company
(Aldivitto and Rahman 2016).
⊘ This is a preview!⊘
Do you want full access?
Subscribe today to unlock all pages.
Trusted by 1+ million students worldwide
9MEDIBANK PRIVATE LIMITED
Particulars 2016-17 2017-18
Market Value Ratio's
Net Income 449500 445100
No. of Outstanding Shares 2754003 2754003
Workings =B38/B39 =C38/C39
Earnings Per Share (EPS Ratio) 0.163 0.162
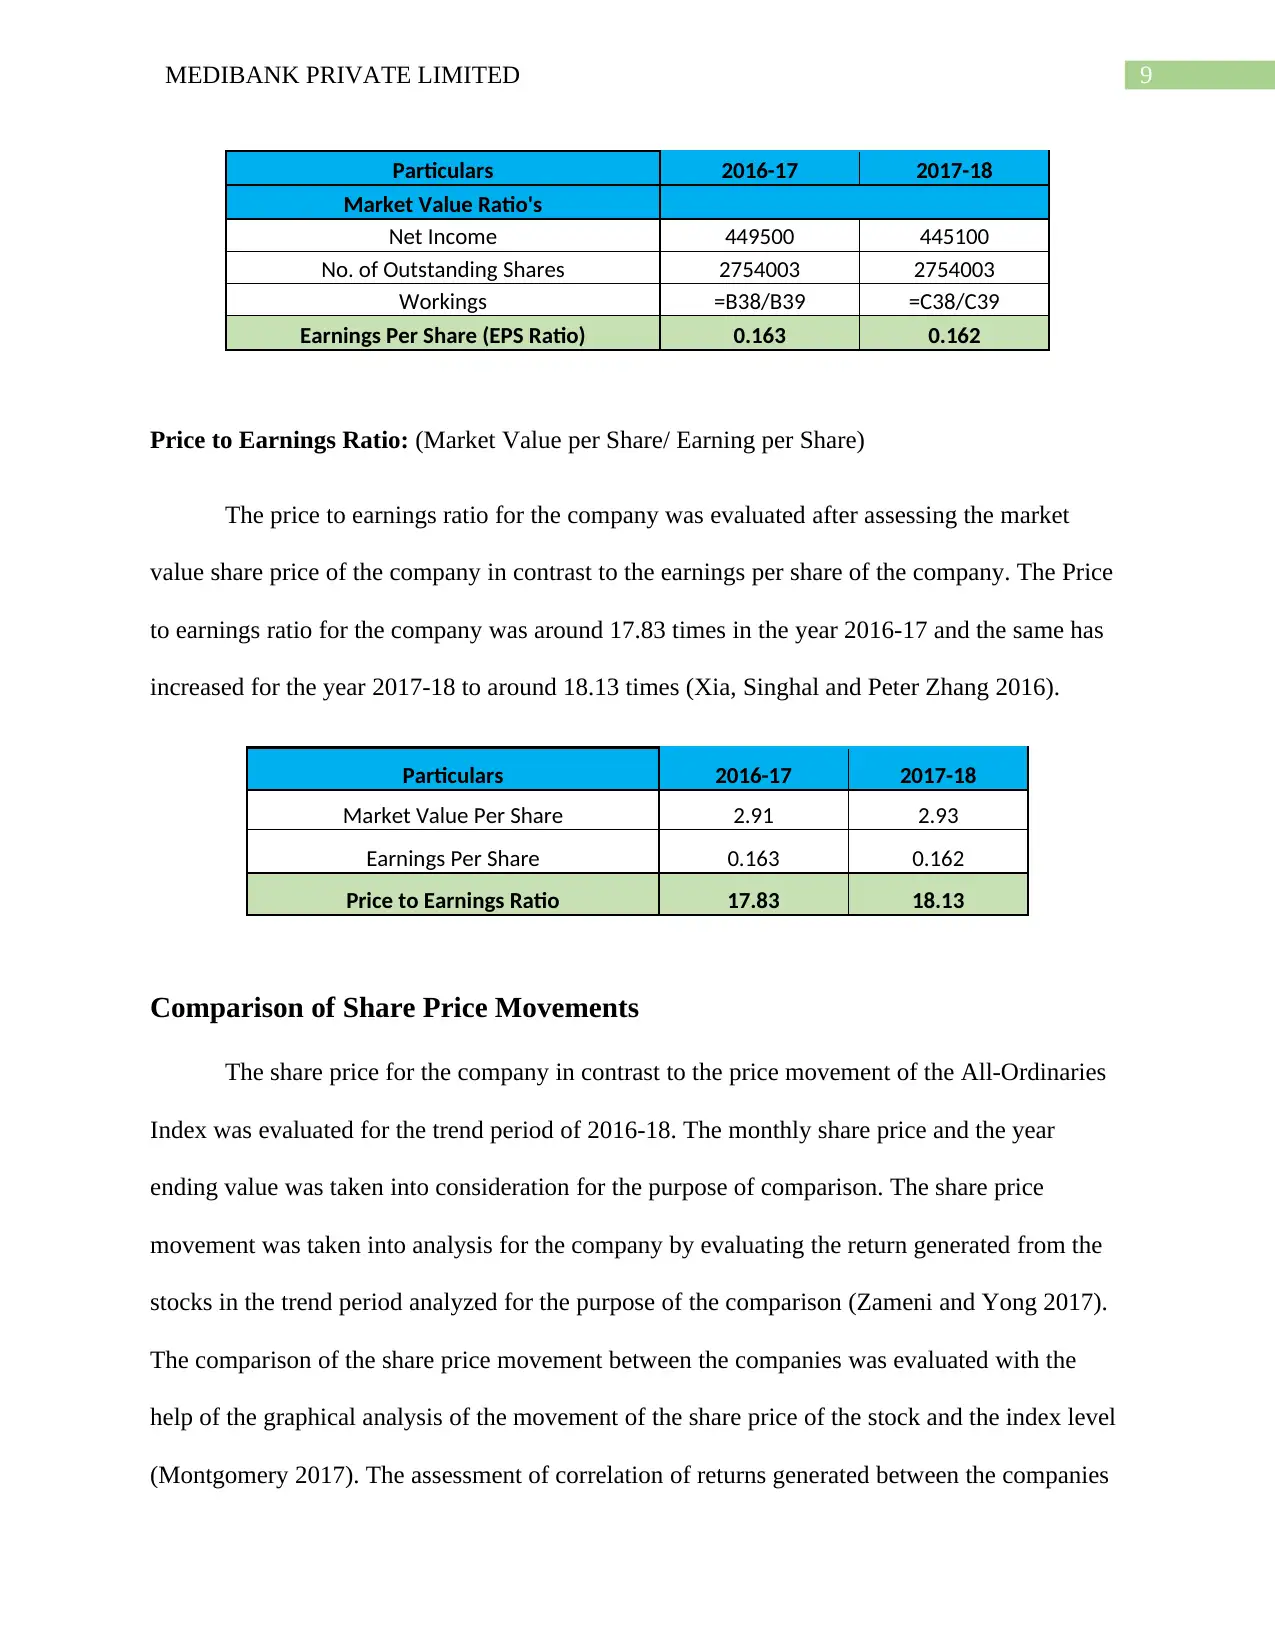
Price to Earnings Ratio: (Market Value per Share/ Earning per Share)
The price to earnings ratio for the company was evaluated after assessing the market
value share price of the company in contrast to the earnings per share of the company. The Price
to earnings ratio for the company was around 17.83 times in the year 2016-17 and the same has
increased for the year 2017-18 to around 18.13 times (Xia, Singhal and Peter Zhang 2016).
Particulars 2016-17 2017-18
Market Value Per Share 2.91 2.93
Earnings Per Share 0.163 0.162
Price to Earnings Ratio 17.83 18.13
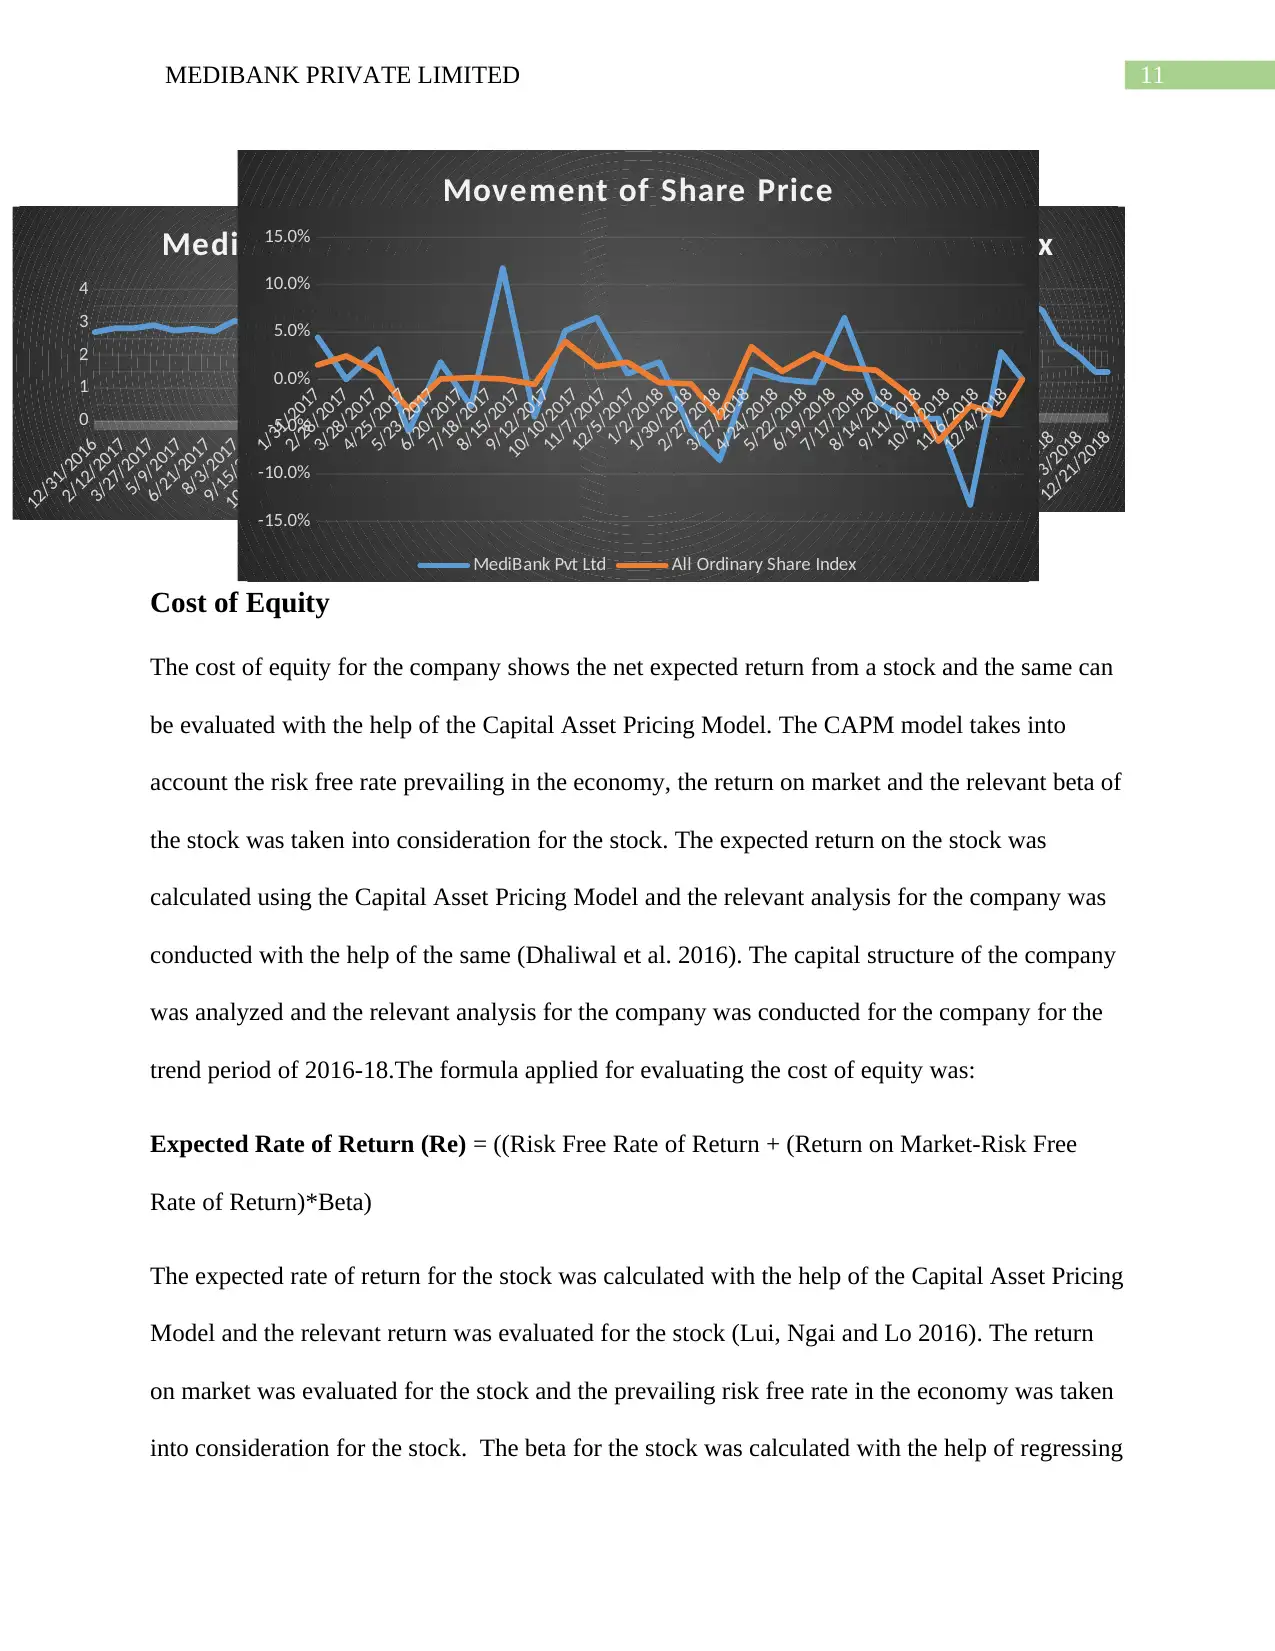
Comparison of Share Price Movements
The share price for the company in contrast to the price movement of the All-Ordinaries
Index was evaluated for the trend period of 2016-18. The monthly share price and the year
ending value was taken into consideration for the purpose of comparison. The share price
movement was taken into analysis for the company by evaluating the return generated from the
stocks in the trend period analyzed for the purpose of the comparison (Zameni and Yong 2017).
The comparison of the share price movement between the companies was evaluated with the
help of the graphical analysis of the movement of the share price of the stock and the index level
(Montgomery 2017). The assessment of correlation of returns generated between the companies
Particulars 2016-17 2017-18
Market Value Ratio's
Net Income 449500 445100
No. of Outstanding Shares 2754003 2754003
Workings =B38/B39 =C38/C39
Earnings Per Share (EPS Ratio) 0.163 0.162
Price to Earnings Ratio: (Market Value per Share/ Earning per Share)
The price to earnings ratio for the company was evaluated after assessing the market
value share price of the company in contrast to the earnings per share of the company. The Price
to earnings ratio for the company was around 17.83 times in the year 2016-17 and the same has
increased for the year 2017-18 to around 18.13 times (Xia, Singhal and Peter Zhang 2016).
Particulars 2016-17 2017-18
Market Value Per Share 2.91 2.93
Earnings Per Share 0.163 0.162
Price to Earnings Ratio 17.83 18.13
Comparison of Share Price Movements
The share price for the company in contrast to the price movement of the All-Ordinaries
Index was evaluated for the trend period of 2016-18. The monthly share price and the year
ending value was taken into consideration for the purpose of comparison. The share price
movement was taken into analysis for the company by evaluating the return generated from the
stocks in the trend period analyzed for the purpose of the comparison (Zameni and Yong 2017).
The comparison of the share price movement between the companies was evaluated with the
help of the graphical analysis of the movement of the share price of the stock and the index level
(Montgomery 2017). The assessment of correlation of returns generated between the companies
Paraphrase This Document
Need a fresh take? Get an instant paraphrase of this document with our AI Paraphraser
10MEDIBANK PRIVATE LIMITED
for the trend period was taken into consideration for the company and the relevant analysis
helped us in determining the correlation of the assets of the company. The correlation between
the Medibank and All Ordinaries Share Index was found to be at a significant level and the same
was around 0.52 times which is at a moderate level. The volatility of the share price of the
company was not found to be at a high level and was around 5.27% for the trend period analyzed
for the company. There are various factors, which influence the movement of the share price of
a company and the same needs to be analyzed and taken into consideration for the analysis of the
same (Bakar and Rosbi 2017). The level of inflation and the interest rate were some of the
macro-economic factors, which influences the share price movement of the company and the
index. The falling profitability condition of the company and the worsening liquidity position of
the company were some of the key reason behind the decline in the share price of the company.
The operating margin for the company has fallen significantly for the company and was the key
reason indicating that the company might not have a sustainable or growth trend of profitability
in the long-term. Thus, the business factors and the macro-economic factors under which the
company operates should be analyzed and examined after taking into various factors (Barth et al.
2017).
11MEDIBANK PRIVATE LIMITED
Cost of Equity
The cost of equity for the company shows the net expected return from a stock and the same can
be evaluated with the help of the Capital Asset Pricing Model. The CAPM model takes into
account the risk free rate prevailing in the economy, the return on market and the relevant beta of
the stock was taken into consideration for the stock. The expected return on the stock was
calculated using the Capital Asset Pricing Model and the relevant analysis for the company was
conducted with the help of the same (Dhaliwal et al. 2016). The capital structure of the company
was analyzed and the relevant analysis for the company was conducted for the company for the
trend period of 2016-18.The formula applied for evaluating the cost of equity was:
Expected Rate of Return (Re) = ((Risk Free Rate of Return + (Return on Market-Risk Free
Rate of Return)*Beta)
The expected rate of return for the stock was calculated with the help of the Capital Asset Pricing
Model and the relevant return was evaluated for the stock (Lui, Ngai and Lo 2016). The return
on market was evaluated for the stock and the prevailing risk free rate in the economy was taken
into consideration for the stock. The beta for the stock was calculated with the help of regressing
12/31/2016
2/17/2017
4/6/2017
5/24/2017
7/11/2017
8/28/2017
10/15/2017
12/2/2017
1/19/2018
3/8/2018
4/25/2018
6/12/2018
7/30/2018
9/16/2018
11/3/2018
12/21/2018
5000
5400
5800
6200
6600
All Ordinary Share Index
12/31/2016
2/12/2017
3/27/2017
5/9/2017
6/21/2017
8/3/2017
9/15/2017
10/28/2017
12/10/2017
1/22/2018
3/6/2018
4/18/2018
5/31/2018
7/13/2018
8/25/2018
10/7/2018
11/19/2018
0
1
2
3
4
MediBank Pvt Ltd
1/31/2017
2/28/2017
3/28/2017
4/25/2017
5/23/2017
6/20/2017
7/18/2017
8/15/2017
9/12/2017
10/10/2017
11/7/2017
12/5/2017
1/2/2018
1/30/2018
2/27/2018
3/27/2018
4/24/2018
5/22/2018
6/19/2018
7/17/2018
8/14/2018
9/11/2018
10/9/2018
11/6/2018
12/4/2018
-15.0%
-10.0%
-5.0%
0.0%
5.0%
10.0%
15.0%
Movement of Share Price
MediBank Pvt Ltd All Ordinary Share Index
⊘ This is a preview!⊘
Do you want full access?
Subscribe today to unlock all pages.
Trusted by 1+ million students worldwide
1 out of 20
Related Documents


Your All-in-One AI-Powered Toolkit for Academic Success.
+13062052269
info@desklib.com
Available 24*7 on WhatsApp / Email
![[object Object]](/_next/static/media/star-bottom.7253800d.svg)
Unlock your academic potential
Copyright © 2020–2026 A2Z Services. All Rights Reserved. Developed and managed by ZUCOL.