Detailed Financial and Strategic Analysis: Medibank Private Ltd
VerifiedAdded on 2023/06/05
|28
|6103
|270
Report
AI Summary
This report conducts a financial analysis of Medibank Private Ltd, beginning with a business and strategy analysis incorporating PESTEL and Porter's Five Forces to assess the company's operational environment and competitive positioning. The analysis evaluates the industry's growth potential and Medibank's accounting practices, including the quality of its financial information and accounting policies. Financial ratios, including operational, financial, and investment ratios, are used to conduct a thorough financial analysis, incorporating cross-sectional and time-series analyses to review the company's performance over a specific period. The report concludes with a prospective analysis, forecasting the income statement and balance sheet based on trend analysis, business factors, and macroeconomic conditions, providing recommendations based on the overall performance evaluation. Desklib offers a range of study tools and resources for students, including solved assignments and past papers.
Running head: FINANCIAL ANALYSIS
Medibank Private Limited
Name of the Student:
Name of the University:
Author’s Note:
Medibank Private Limited
Name of the Student:
Name of the University:
Author’s Note:
Paraphrase This Document
Need a fresh take? Get an instant paraphrase of this document with our AI Paraphraser
1FINANCIAL ANALYSIS
Executive Summary
The aim of the project is to review and conduct a financial analysis on the Medibank Private
Ltd. The Business and strategy analysis was performed which included the performance of
the company’s business and the strategy involved by the company in the form of the Pestel
analysis and the factors that affect the workings of the company. The analysis of the porter’s
five forces has helped us evaluate the business and industry review under which the company
operates. The growth potential of the industry were identified to capture and analyse the
performance of the company. The accounting analysis conducted helped us evaluate the
performance of the company in respect to the industry. Certain ratios were taken on industry
and company perspective for evaluating the same. The accounting policies of the companies
along with the quality of the financial information was also evaluated. The financial analysis
of the company was carried on by using the financial ratios of the company and key ratio’s
such as operational, financial and investment ratios were used and evaluated for conducting
the financial analysis of the company. The data collected from the financial reports were then
use in the form of cross sectional and time series analysis which helped us review the
performance of the company in the trend period taken. The forecasting of the income
statement and the balance sheet of the company was done keeping in view with the trend
analysis of the company, business and macro-economic factors under which the company
operates.
2FINANCIAL ANALYSIS
Table of Contents
Introduction................................................................................................................................4
Discussions.................................................................................................................................4
Business and Strategy Analysis.................................................................................................4
Analysis of the Economy.......................................................................................................4
Industry Analysis...................................................................................................................7
Porters Five Force Analysis...................................................................................................8
Company’s Competitive and Corporate Strategy................................................................11
Accounting Analysis................................................................................................................11
Key Accounts of the Company............................................................................................11
Disclosure of Accounting Policies.......................................................................................11
Earnings Management..........................................................................................................12
Financial Analysis....................................................................................................................12
Return on Equity..................................................................................................................13
Operating Management Ratio..............................................................................................13
Investment Management Ratio............................................................................................16
Financial Leverage Ratio.....................................................................................................17
Cross Sectional and Time Series Analysis...........................................................................20
Prospective Analysis................................................................................................................21
Forecast of the Company.....................................................................................................21
Overall Performance of the Analysis...................................................................................22
Recommendations....................................................................................................................23
⊘ This is a preview!⊘
Do you want full access?
Subscribe today to unlock all pages.
Trusted by 1+ million students worldwide
3FINANCIAL ANALYSIS
Reference..................................................................................................................................24
Reference..................................................................................................................................24
Paraphrase This Document
Need a fresh take? Get an instant paraphrase of this document with our AI Paraphraser
4FINANCIAL ANALYSIS
Introduction
The Company Medibank Private Ltd operates as an integrated healthcare and
wellbeing service provider company. The company caters the health care sector though it’s
various healthcare related products and services (Cassidy, 2016).
A SWOT analysis and PEST analysis is shown which shows how the company uses
its group of network, innovative skills, presence in all market with highest market share, its
product portfolio as its strength. While the company faces many issue with the fierce
competition it faces from Bupa Health Care Company and others. It also faces many political
threats in different parts of the country with certain law and taxation effects by the rules and
the guidelines set by the Regulatory Board of the Insurance Sector. While exploring
economies with young demographic trend and developing economies where the field of
healthcare can be more explored is the aim for the company and building its major share over
there is a major strategy for the company (Wolf & Floyd, 2017).
The financial ratios and the evaluation of the same was performed to get an overview
of the company. The forecasting of the data for the company and the industry analysis of the
company helped us determine the business strategy implied by the company (Wheelen et al.
2017).
Discussions
Business and Strategy Analysis
Analysis of the Economy
PEST Analysis
5FINANCIAL ANALYSIS
The PEST Analysis is an analytical review of the external factors affecting the
company’s operations and its day-to-day workings. The PEST is the acronym for the factors
like Political, Economic, Social, Technological, Legal and Environmental Factors affecting
the company. The macro environmental factors may have a direct influence on the company’s
operations and the long term financial goals of the company. Thus it is important to review
and analyse the PESTEL analysis of the company. The analysis will help in getting the
detailed analysis of the business environment and the economy and industry under which the
company operates (Song, Sun & Jin, 2017).
Political Analysis: The Medibank Company operates in the Political scenario of the
Australia economy and various other companies where the company caters different kinds
and types of insurance services and products to its globally based customers. The country
GDP gets a larger boost by the healthcare Industry where the sector contributes a significant
portion of GDP. The performance of the Industry and the stable political environment has
made the company’s operations well operate without any political interventions. The
political factors that may influence the operations of the company is the political instability in
the economy where the company performs and the interference of the concerned insurance or
the regulatory bodies n maintain and by changing the principal, rules and guidelines of the
insurance sector (Lamas Leite, et al. 2017).
Economic Factors: The Economic growth of the country has been impressive with the
growth of the economy it gives an opportunity for the company to cater more customers in
the insurance sectors. The rise of the economy and the increase of the Purchasing Power
Parity of the consumers will help ease the consumers will spend more of their amount in the
sector like Healthcare Insurance products as a savings and for securing there future. All other
economic factors like the interest rate, Inflation Rate, and economic growth pattern affects
the country economic scenario. The Medibank Private Ltd Company can use the opportunity
⊘ This is a preview!⊘
Do you want full access?
Subscribe today to unlock all pages.
Trusted by 1+ million students worldwide
6FINANCIAL ANALYSIS
of exploring the industry sector of different economies and forecast and perform better
operational activates of the company by exploring the developed countries (Rastogi &
Trivedi 2016). The key economic factors that the company should evaluate is the government
intervention and the financial markets efficiency and the stability of the economy. Business
cycle and other macro-economic trends of the economy may be important to assess while the
operational activities of the company is carried.
Social Factors: The factors help us understand the various social environment and the
different cultural trends, population or demographic analysis. The Medibank Company has a
wider group of target consumers which are in need of healthcare services and those in the age
range of 45-80 and the young demographic of the country with the age range of 5-25 years of
age (Amin et al. 2017).
Technological Factors: Technological changes and getting adapted to latest technology
marks the company’s growth. There are certain factors and innovations in the technology
field, which can bring changes in the Medibank Company like using advanced tools for the
treatment of various health related problems which could bring efficiency in the company
(Mkude & Wimmer, 2015).
Environmental Factors: These Factors comprise of all factors, which influences and
determines the operations of the business. The Environmental Factors for the company have
remained in favour of the company because of its different strategy of servicing and catering
to different people and in building of new culture among the people.
Legal Factors: Safety Standards, labour laws and other consumer laws comprises the legal
factors, which affects the company’s operations. Certain policies changes affect companies if
these changes are not static. Australian Government has been very strict with the labour laws
and other legal factors to protect the workforce from being exploited. There are certain other
Paraphrase This Document
Need a fresh take? Get an instant paraphrase of this document with our AI Paraphraser
7FINANCIAL ANALYSIS
factors like different healthcare services like insurance services needs to be followed by the
guiding principles of the Insurance Regulator department and changes in principles and laws
should be reflected in the company’s policy.
Industry Analysis
The operations and distribution of health services is categorised into two major
groups the first group or the segment deals with the Health Care Insurance Products and
services, which the company caters. The Medibank Health is the other segment by which the
company caters the heath care sector (Sabirov et al. 2015). The insurance group offers a
health insurance products to its customers which covers various healthcare related services.
The group serves to major customer base both domestic and overseas. The other group or the
Medibank segment caters the customers by providing health management to every group of
customers.
The Company Medibank is the second biggest operator of the health care sector
where the company ranks second biggest company after the Bupa Health Care Company
which dominates the market and is the largest player in the sector of healthcare. The
Company Medibank has around 29.1% of the market share. The company was founded in the
year 1975 as Health Insurance Company. There are certain aspects of the company like the
business analysis, industry review and financial analysis of the company was performed to
get an overview of the company and terms of their operational and financial performance of
the company since the year 2016. The financial data from the year 2016 was collected for the
company in order to review the same.
Pest
Analysis
Political
Analysis
Social
Analysis
Technologica
l
Analysis
Economical
Analysis
8FINANCIAL ANALYSIS
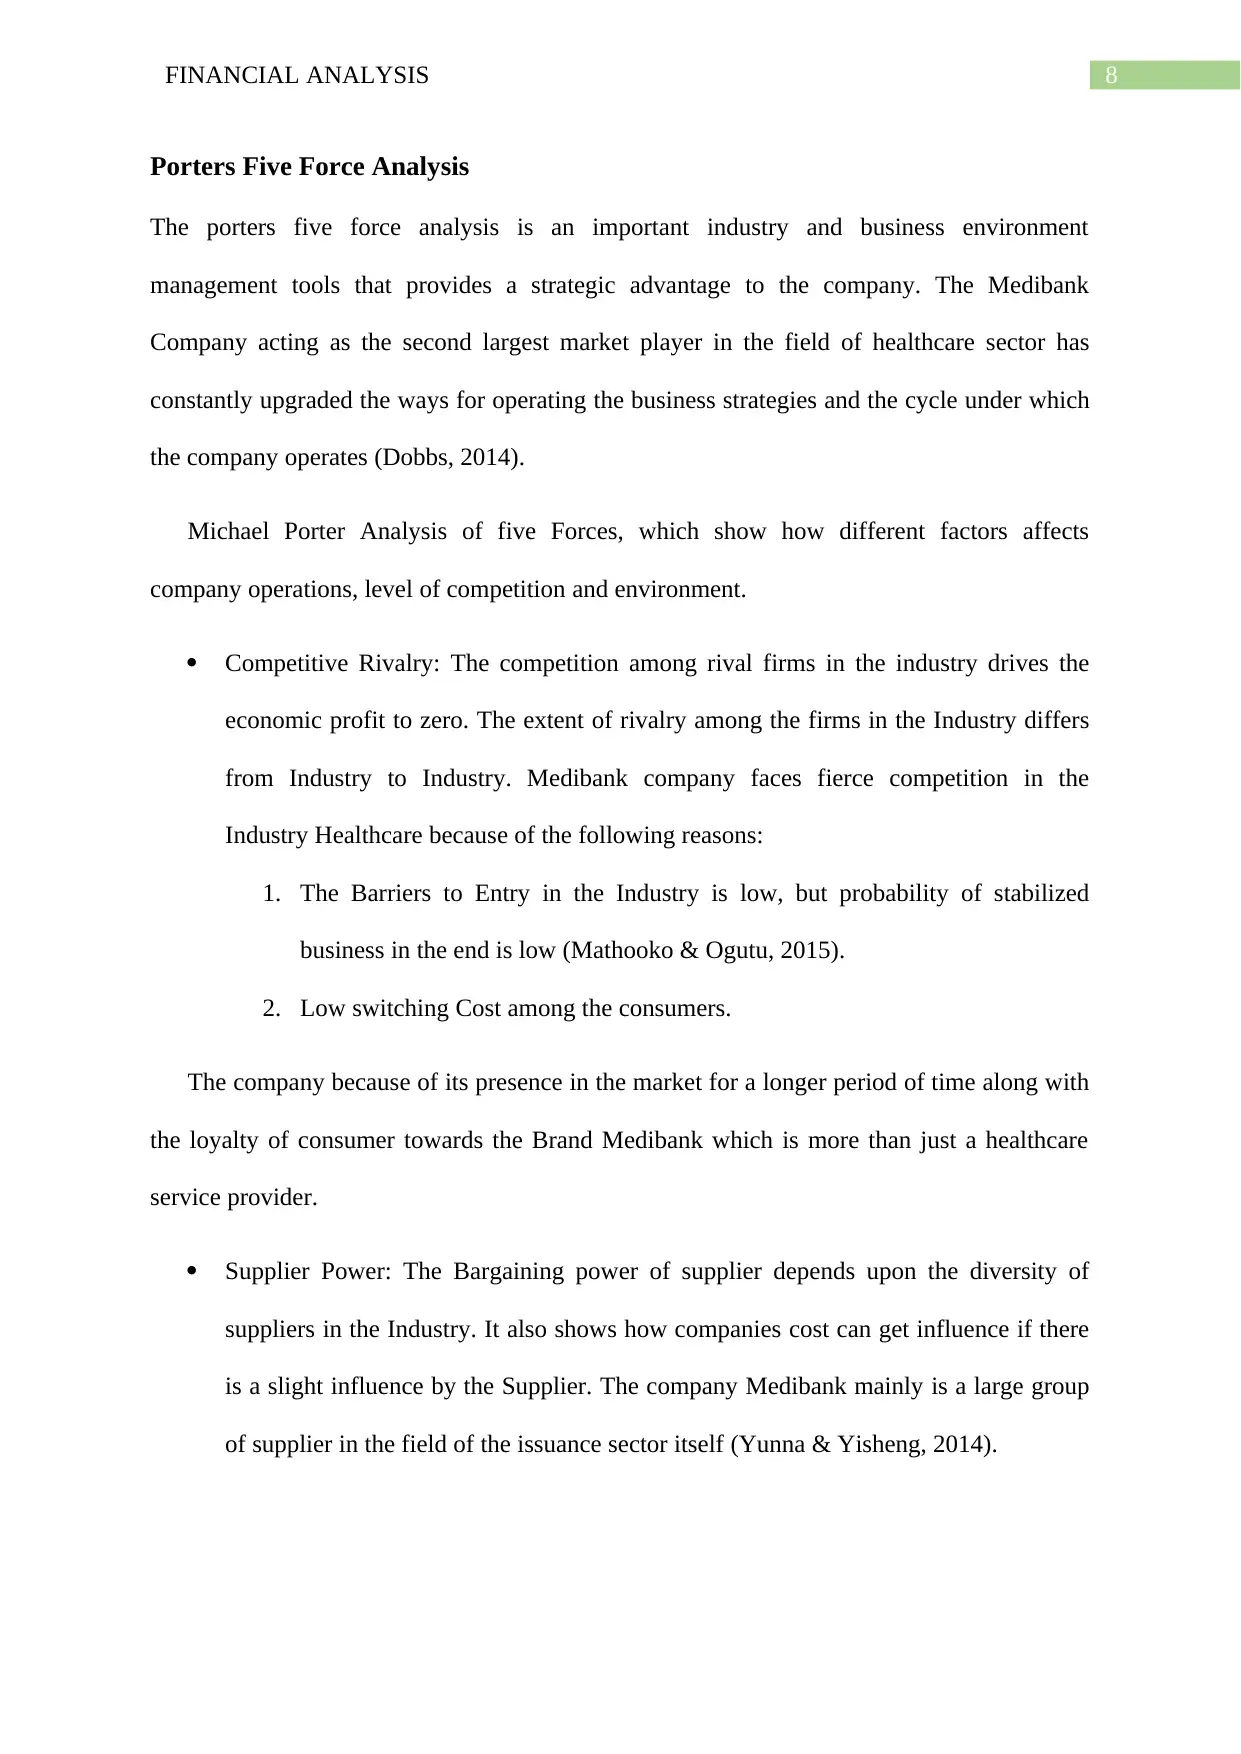
Porters Five Force Analysis
The porters five force analysis is an important industry and business environment
management tools that provides a strategic advantage to the company. The Medibank
Company acting as the second largest market player in the field of healthcare sector has
constantly upgraded the ways for operating the business strategies and the cycle under which
the company operates (Dobbs, 2014).
Michael Porter Analysis of five Forces, which show how different factors affects
company operations, level of competition and environment.
Competitive Rivalry: The competition among rival firms in the industry drives the
economic profit to zero. The extent of rivalry among the firms in the Industry differs
from Industry to Industry. Medibank company faces fierce competition in the
Industry Healthcare because of the following reasons:
1. The Barriers to Entry in the Industry is low, but probability of stabilized
business in the end is low (Mathooko & Ogutu, 2015).
2. Low switching Cost among the consumers.
The company because of its presence in the market for a longer period of time along with
the loyalty of consumer towards the Brand Medibank which is more than just a healthcare
service provider.
Supplier Power: The Bargaining power of supplier depends upon the diversity of
suppliers in the Industry. It also shows how companies cost can get influence if there
is a slight influence by the Supplier. The company Medibank mainly is a large group
of supplier in the field of the issuance sector itself (Yunna & Yisheng, 2014).
⊘ This is a preview!⊘
Do you want full access?
Subscribe today to unlock all pages.
Trusted by 1+ million students worldwide
9FINANCIAL ANALYSIS
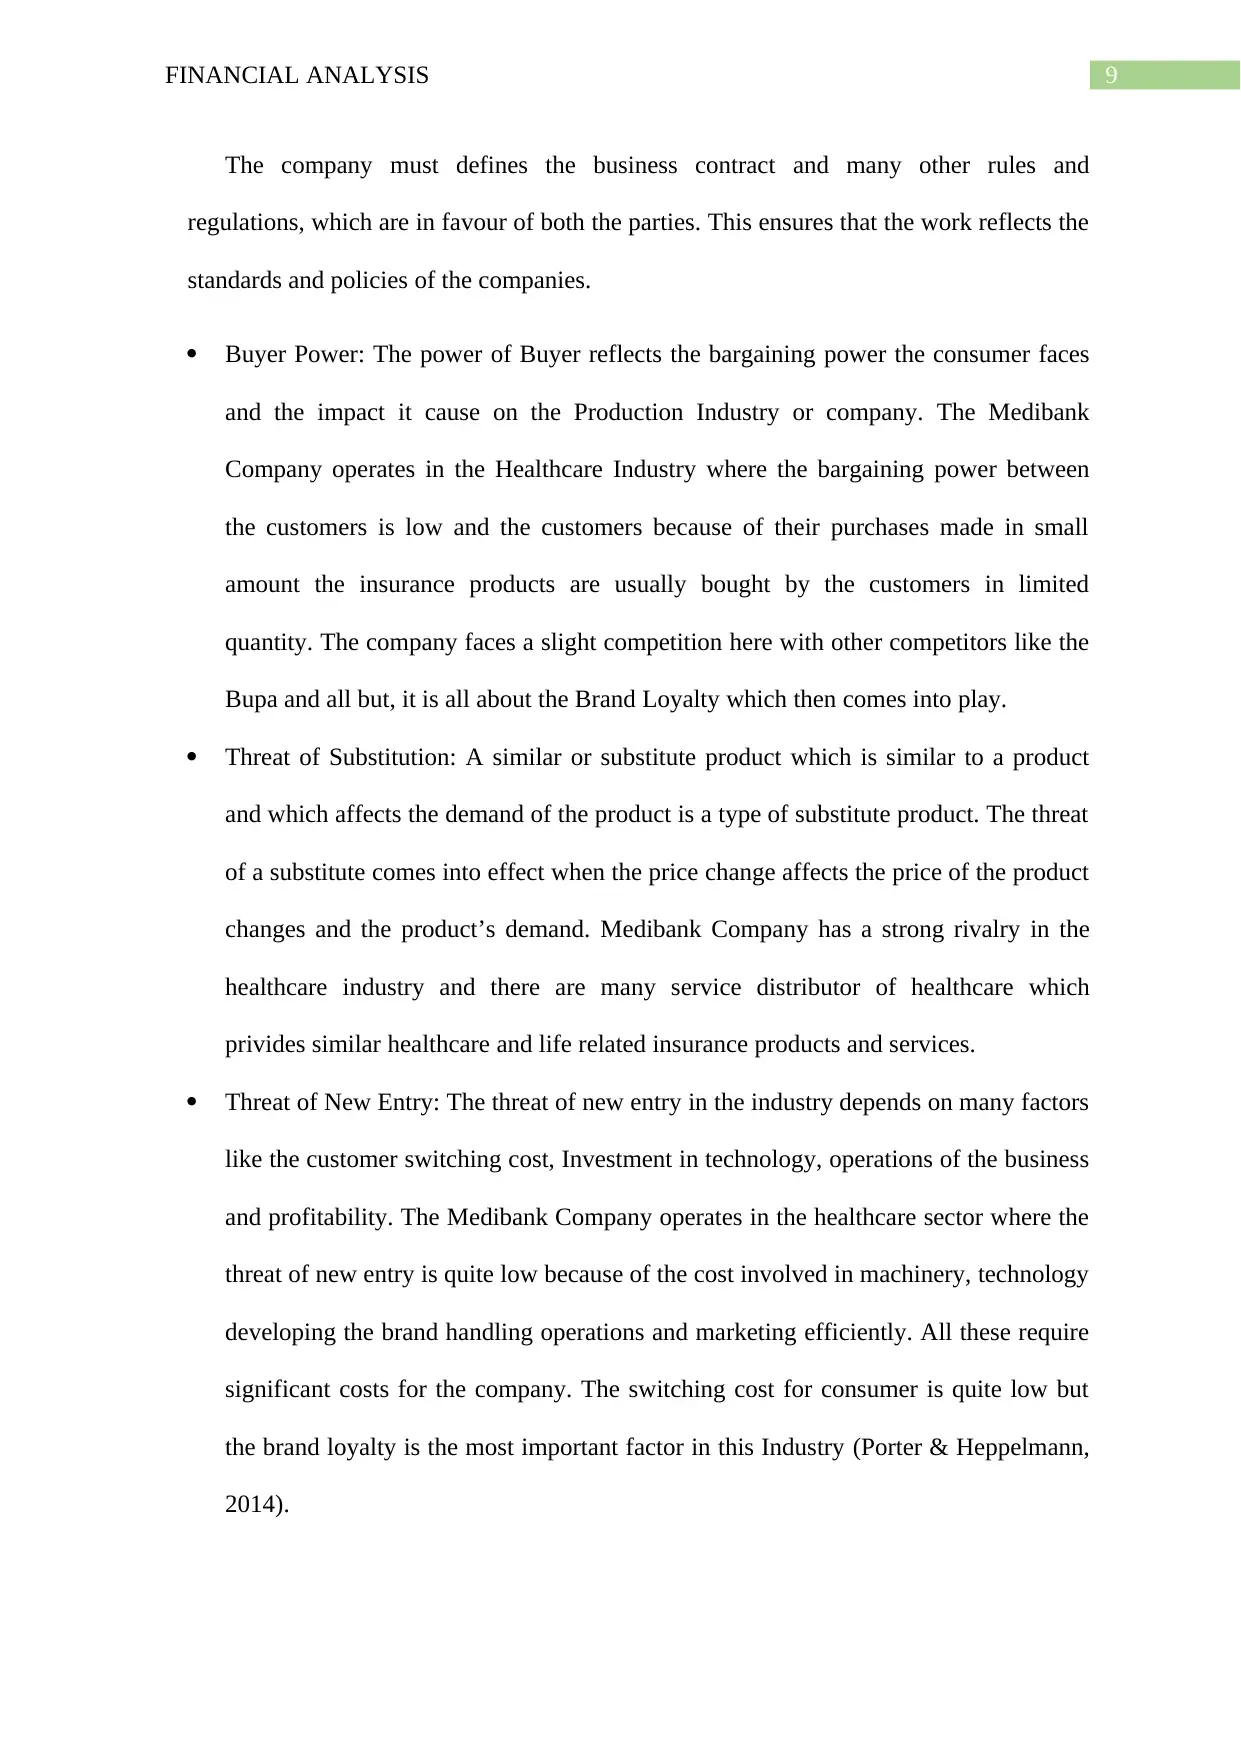
The company must defines the business contract and many other rules and
regulations, which are in favour of both the parties. This ensures that the work reflects the
standards and policies of the companies.
Buyer Power: The power of Buyer reflects the bargaining power the consumer faces
and the impact it cause on the Production Industry or company. The Medibank
Company operates in the Healthcare Industry where the bargaining power between
the customers is low and the customers because of their purchases made in small
amount the insurance products are usually bought by the customers in limited
quantity. The company faces a slight competition here with other competitors like the
Bupa and all but, it is all about the Brand Loyalty which then comes into play.
Threat of Substitution: A similar or substitute product which is similar to a product
and which affects the demand of the product is a type of substitute product. The threat
of a substitute comes into effect when the price change affects the price of the product
changes and the product’s demand. Medibank Company has a strong rivalry in the
healthcare industry and there are many service distributor of healthcare which
privides similar healthcare and life related insurance products and services.
Threat of New Entry: The threat of new entry in the industry depends on many factors
like the customer switching cost, Investment in technology, operations of the business
and profitability. The Medibank Company operates in the healthcare sector where the
threat of new entry is quite low because of the cost involved in machinery, technology
developing the brand handling operations and marketing efficiently. All these require
significant costs for the company. The switching cost for consumer is quite low but
the brand loyalty is the most important factor in this Industry (Porter & Heppelmann,
2014).
Paraphrase This Document
Need a fresh take? Get an instant paraphrase of this document with our AI Paraphraser
10FINANCIAL ANALYSIS
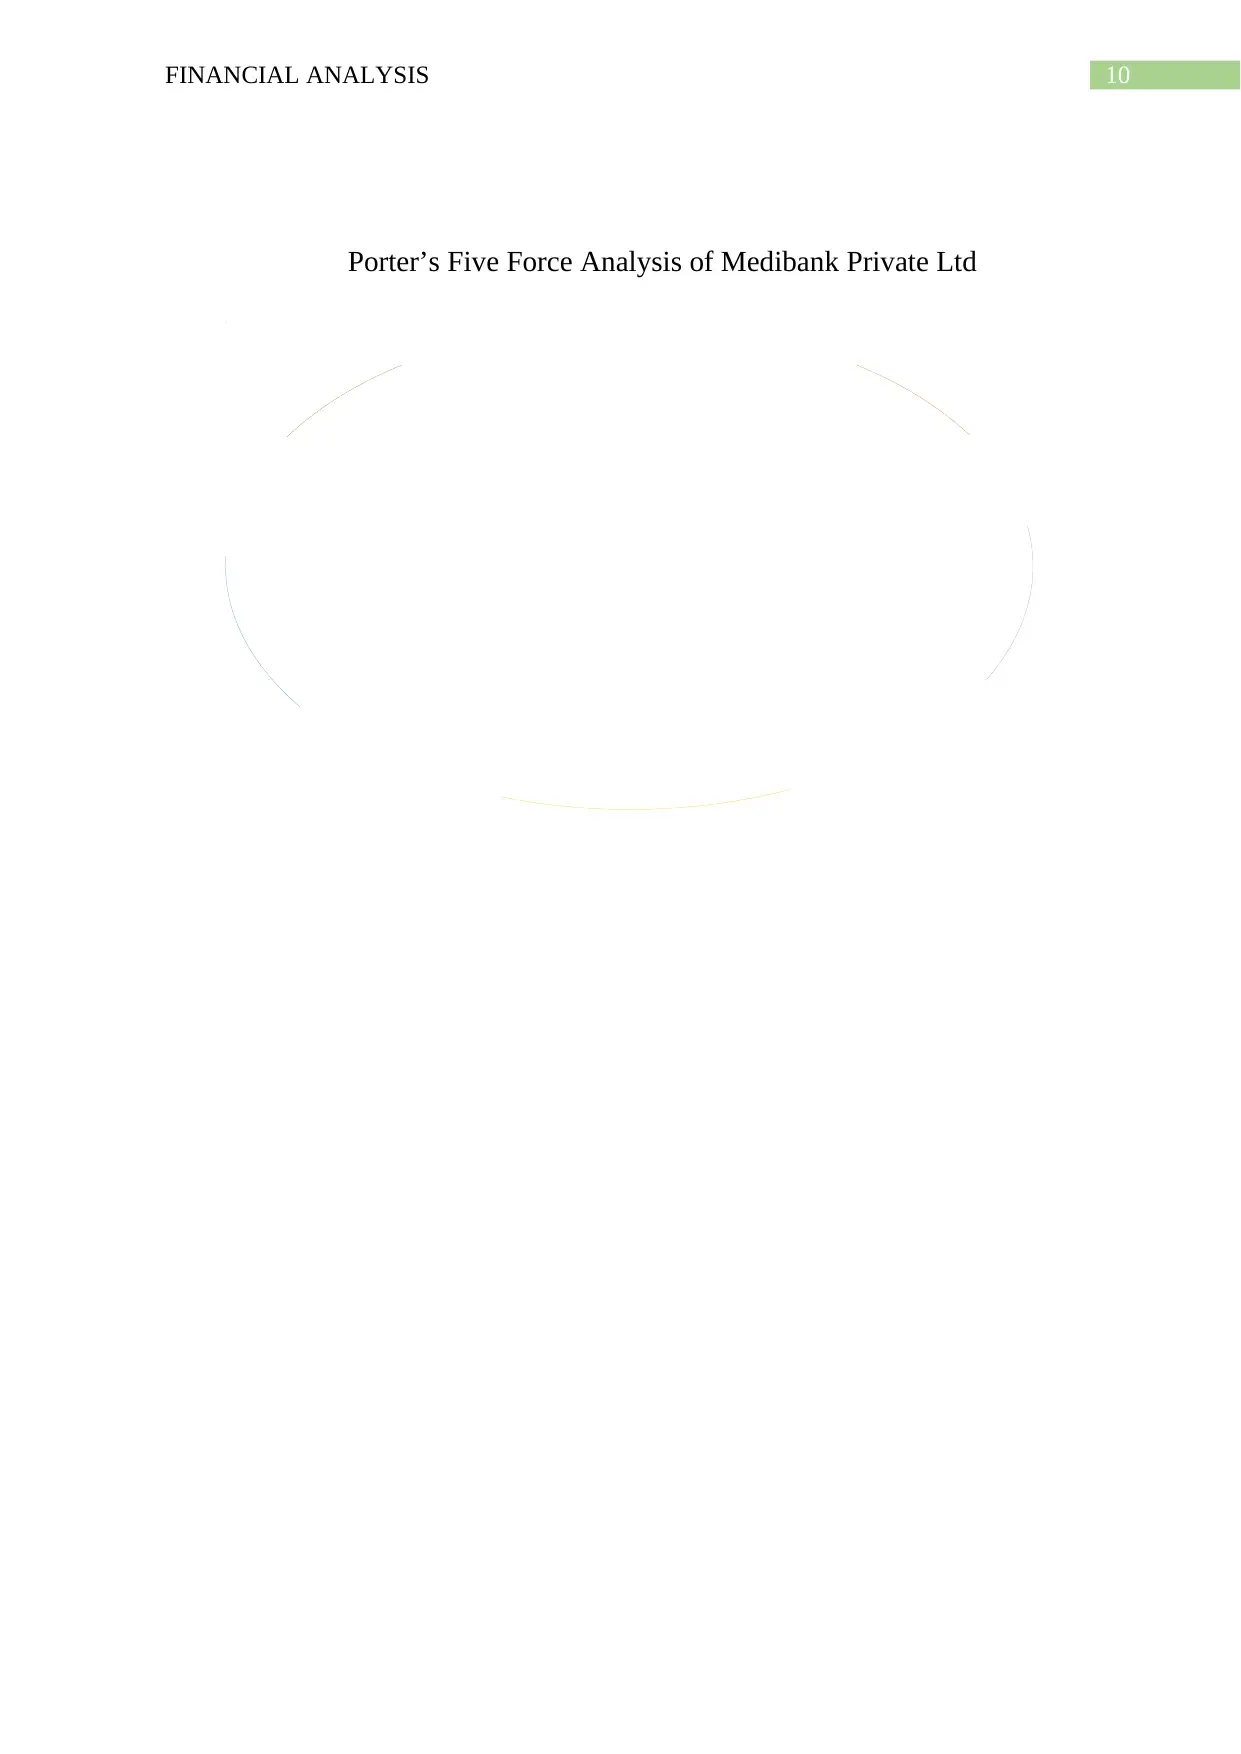
BargainingPowerofBuyer:LowBargainingPowerofSupplier:ModerateCompetitiveRivalry:HighThreatofSubstitute:HighThreatofNewEntry:Low
Porter’s Five Force Analysis of Medibank Private Ltd
BargainingPowerofBuyer:LowBargainingPowerofSupplier:ModerateCompetitiveRivalry:HighThreatofSubstitute:HighThreatofNewEntry:Low
Porter’s Five Force Analysis of Medibank Private Ltd
11FINANCIAL ANALYSIS
The five-force model for the Medibank Private Ltd has shown the evaluation and the
environment in which the company operates. It also shows the profitability and how attractive
the Industry is. The management of the company should perform strategies based on the
analysis done to overcome profitability and its major competitor Bhupa.
Company’s Competitive and Corporate Strategy
The Medibank Private Ltd Company’s management uses various strategy and
methods for analysing and intercepting inherits and weakness of the company. The company
is trying to understand the internal and external factors and other organizations capabilities
and business environment in which the coffee/bar shop operates.
The company has a target group of customers, it differentiates itself from other
healthcare company by its unique strategy, by providing healthcare services in every aspect
from insurance to treatment of health related services to its customer. The company has a
large targeted demographic trend of people who are in need of the healthcare related services
and other services like the facility of insurance in various fields helps the company form a
better group and base of customers.
⊘ This is a preview!⊘
Do you want full access?
Subscribe today to unlock all pages.
Trusted by 1+ million students worldwide
1 out of 28
Related Documents


Your All-in-One AI-Powered Toolkit for Academic Success.
+13062052269
info@desklib.com
Available 24*7 on WhatsApp / Email
![[object Object]](/_next/static/media/star-bottom.7253800d.svg)
Unlock your academic potential
Copyright © 2020–2026 A2Z Services. All Rights Reserved. Developed and managed by ZUCOL.