Financial Analysis and Ratio Calculations: Military Might Limited
VerifiedAdded on 2023/06/09
|17
|3834
|356
Report
AI Summary
This report presents a comprehensive financial analysis of Military Might Limited, a UK-based company selling outdoor equipment. It begins with the preparation of the company's financial statements, including the Income Statement and Statement of Financial Position for the year ended 31 December 2021. The report then delves into a detailed analysis of financial ratios, including profitability, liquidity, efficiency, and lending ratios, over a four-year period from 2018 to 2021. These ratios are calculated and interpreted to assess the company's performance, identify trends, and evaluate its financial health. The analysis covers key areas such as profit margins, return on investment, current and acid-test ratios, inventory turnover, accounts receivable turnover, and return on assets and equity. The report also includes a discussion of budgetary control and its behavioural aspects. The findings provide insights into the company's strengths and weaknesses, along with recommendations for improvement, focusing on aspects like declining profit margins, efficient asset utilization, and effective collection processes.

Financial and Data
Analysis
Analysis
Paraphrase This Document
Need a fresh take? Get an instant paraphrase of this document with our AI Paraphraser
Contents
Contents...........................................................................................................................................2
INTRODUCTION...........................................................................................................................3
MAIN BODY..................................................................................................................................3
Task 1:..........................................................................................................................................3
Task 2: Calculation of Financial Ratios for Military Might Limited:..........................................5
.......................................................................................................................................................14
Task 3:........................................................................................................................................15
CONCLUSION..............................................................................................................................17
REFERENCES..............................................................................................................................18
INTRODUCTION
The process of critical evaluation of the financial information contained in financial
statements to understand and make decisions regarding the operations of the firm is called
'Financial Statement Analysis'. It is basically a study of relationship among various facts and
figures as given in a set of financial statements, and the interpretation thereof to gain an insight
into the profitability and operational efficiency. The preparation of financial statements is a
prerequisite of analysis. Preparation of financial statements is one of the last steps in accounting
cycle. This report contains preparation of financial statements of Military Might Limited.
Military Might Limited is a private limited company based in the UK that sells outdoor
equipment. Further budget preparation and budgetary controls are explained in context of
Military Might Limited. A budgetary control is a technique whereby the actual results are
compared with budgets to find out variances. In addition, the behavioural aspects of budgetary
control are discussed.
MAIN BODY
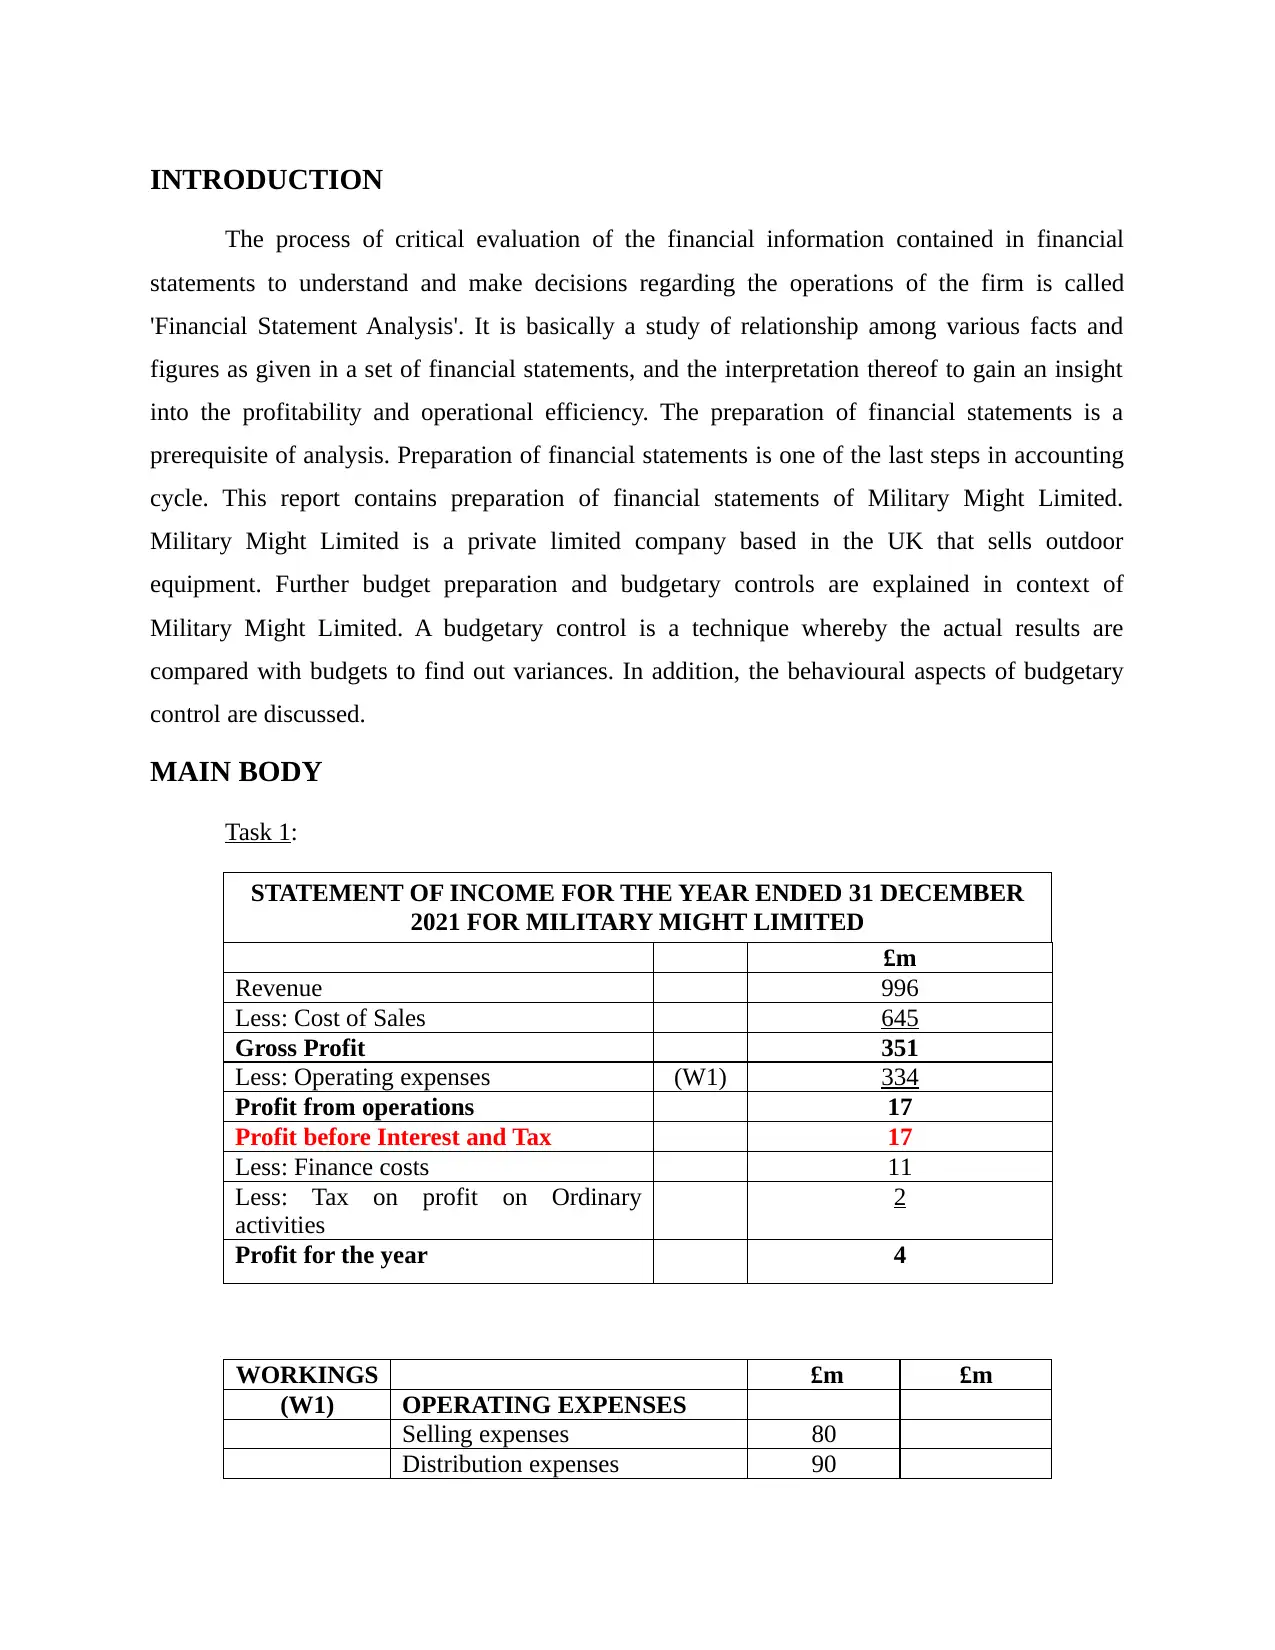
Task 1:
STATEMENT OF INCOME FOR THE YEAR ENDED 31 DECEMBER
2021 FOR MILITARY MIGHT LIMITED
£m
Revenue 996
Less: Cost of Sales 645
Gross Profit 351
Less: Operating expenses (W1) 334
Profit from operations 17
Profit before Interest and Tax 17
Less: Finance costs 11
Less: Tax on profit on Ordinary
activities
2
Profit for the year 4
WORKINGS £m £m
(W1) OPERATING EXPENSES
Selling expenses 80
Distribution expenses 90
The process of critical evaluation of the financial information contained in financial
statements to understand and make decisions regarding the operations of the firm is called
'Financial Statement Analysis'. It is basically a study of relationship among various facts and
figures as given in a set of financial statements, and the interpretation thereof to gain an insight
into the profitability and operational efficiency. The preparation of financial statements is a
prerequisite of analysis. Preparation of financial statements is one of the last steps in accounting
cycle. This report contains preparation of financial statements of Military Might Limited.
Military Might Limited is a private limited company based in the UK that sells outdoor
equipment. Further budget preparation and budgetary controls are explained in context of
Military Might Limited. A budgetary control is a technique whereby the actual results are
compared with budgets to find out variances. In addition, the behavioural aspects of budgetary
control are discussed.
MAIN BODY
Task 1:
STATEMENT OF INCOME FOR THE YEAR ENDED 31 DECEMBER
2021 FOR MILITARY MIGHT LIMITED
£m
Revenue 996
Less: Cost of Sales 645
Gross Profit 351
Less: Operating expenses (W1) 334
Profit from operations 17
Profit before Interest and Tax 17
Less: Finance costs 11
Less: Tax on profit on Ordinary
activities
2
Profit for the year 4
WORKINGS £m £m
(W1) OPERATING EXPENSES
Selling expenses 80
Distribution expenses 90
⊘ This is a preview!⊘
Do you want full access?
Subscribe today to unlock all pages.
Trusted by 1+ million students worldwide
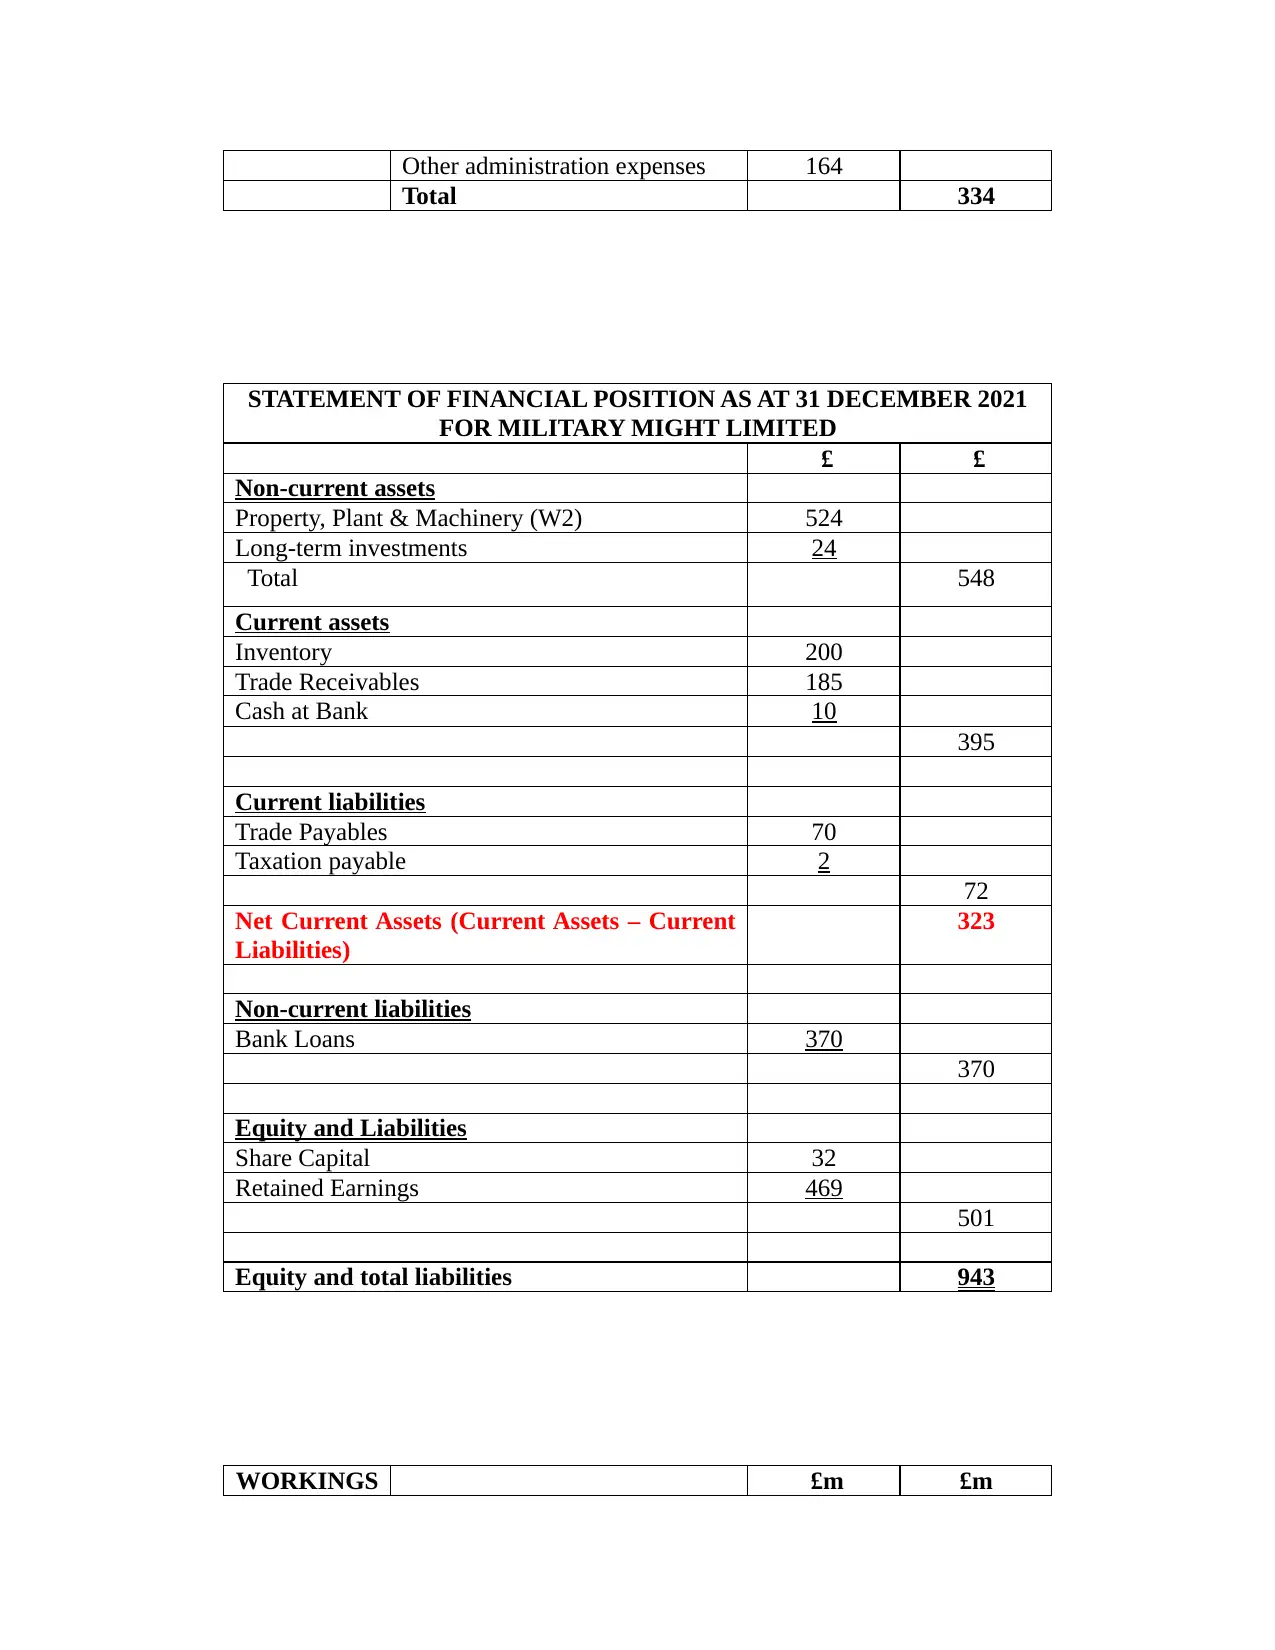
Other administration expenses 164
Total 334
STATEMENT OF FINANCIAL POSITION AS AT 31 DECEMBER 2021
FOR MILITARY MIGHT LIMITED
£ £
Non-current assets
Property, Plant & Machinery (W2) 524
Long-term investments 24
Total 548
Current assets
Inventory 200
Trade Receivables 185
Cash at Bank 10
395
Current liabilities
Trade Payables 70
Taxation payable 2
72
Net Current Assets (Current Assets – Current
Liabilities)
323
Non-current liabilities
Bank Loans 370
370
Equity and Liabilities
Share Capital 32
Retained Earnings 469
501
Equity and total liabilities 943
WORKINGS £m £m
Paraphrase This Document
Need a fresh take? Get an instant paraphrase of this document with our AI Paraphraser
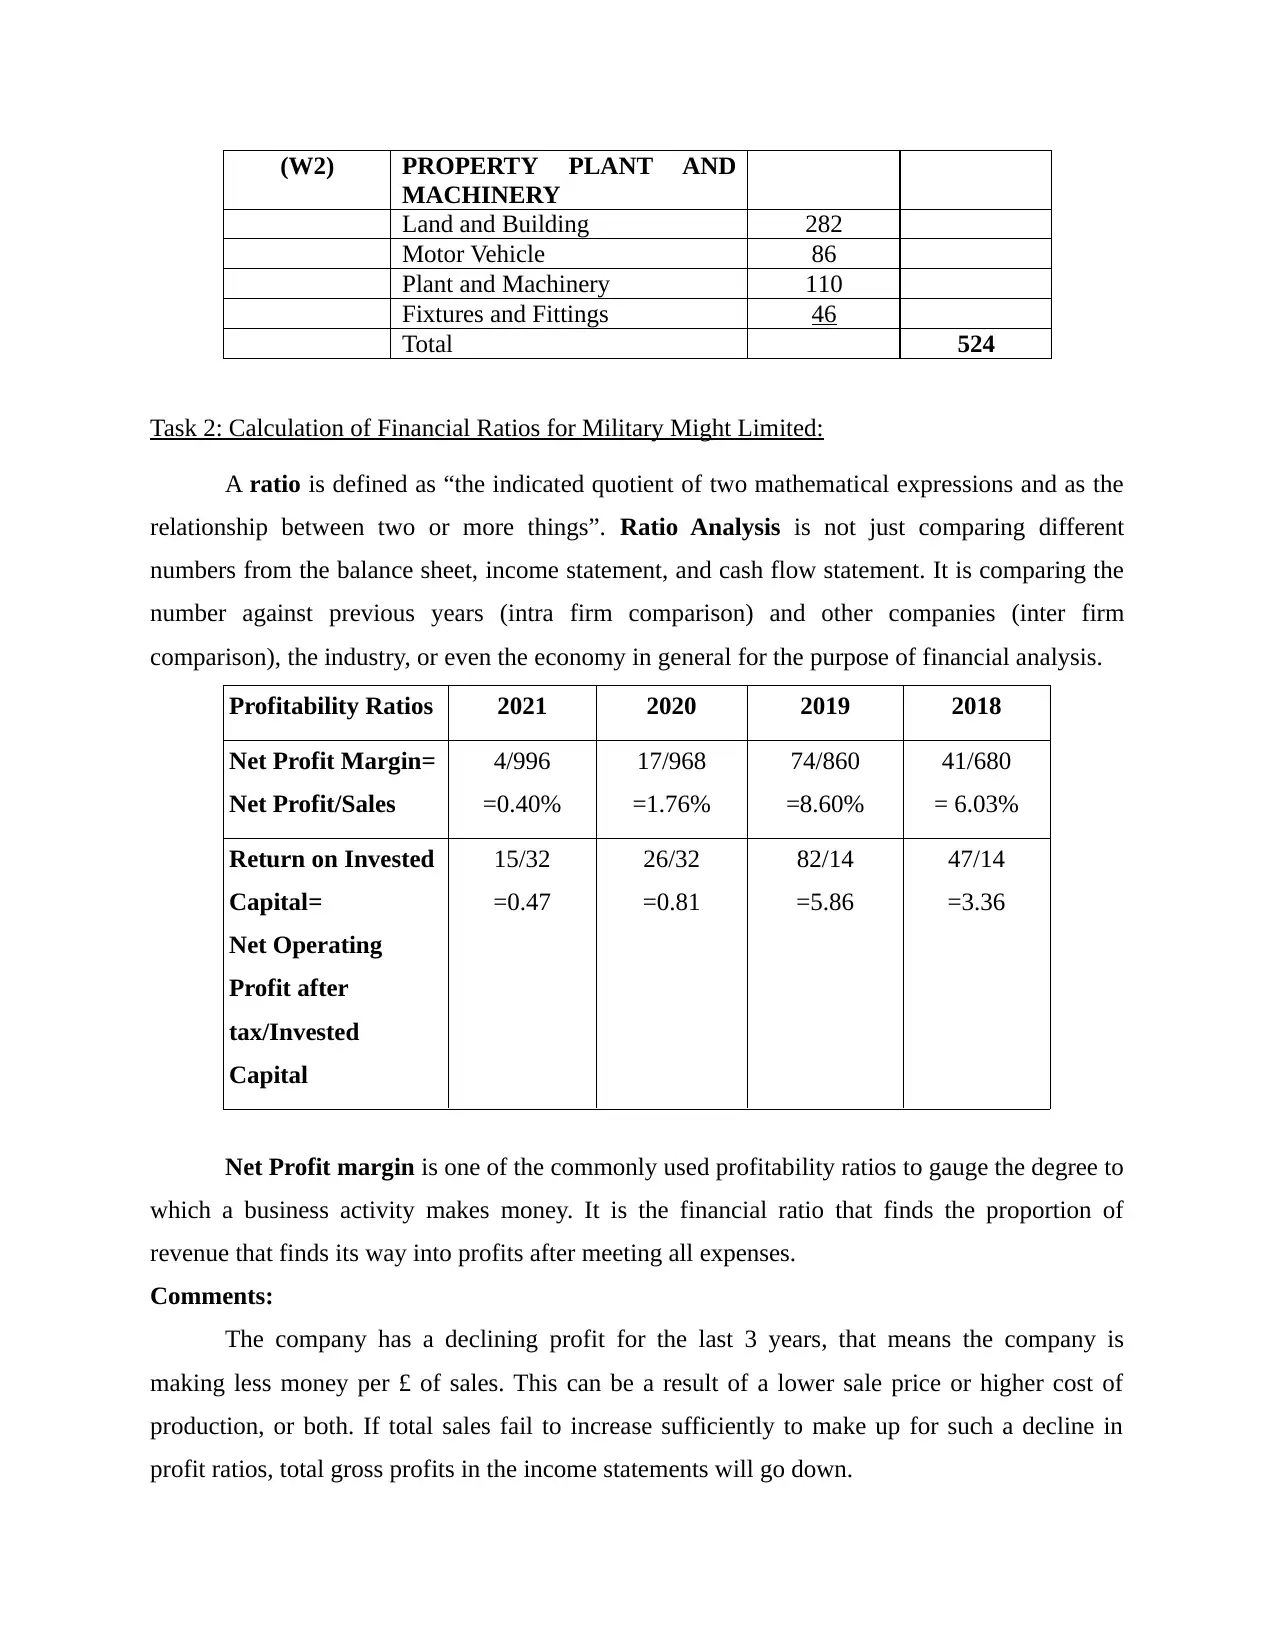
(W2) PROPERTY PLANT AND
MACHINERY
Land and Building 282
Motor Vehicle 86
Plant and Machinery 110
Fixtures and Fittings 46
Total 524
Task 2: Calculation of Financial Ratios for Military Might Limited:
A ratio is defined as “the indicated quotient of two mathematical expressions and as the
relationship between two or more things”. Ratio Analysis is not just comparing different
numbers from the balance sheet, income statement, and cash flow statement. It is comparing the
number against previous years (intra firm comparison) and other companies (inter firm
comparison), the industry, or even the economy in general for the purpose of financial analysis.
Profitability Ratios 2021 2020 2019 2018
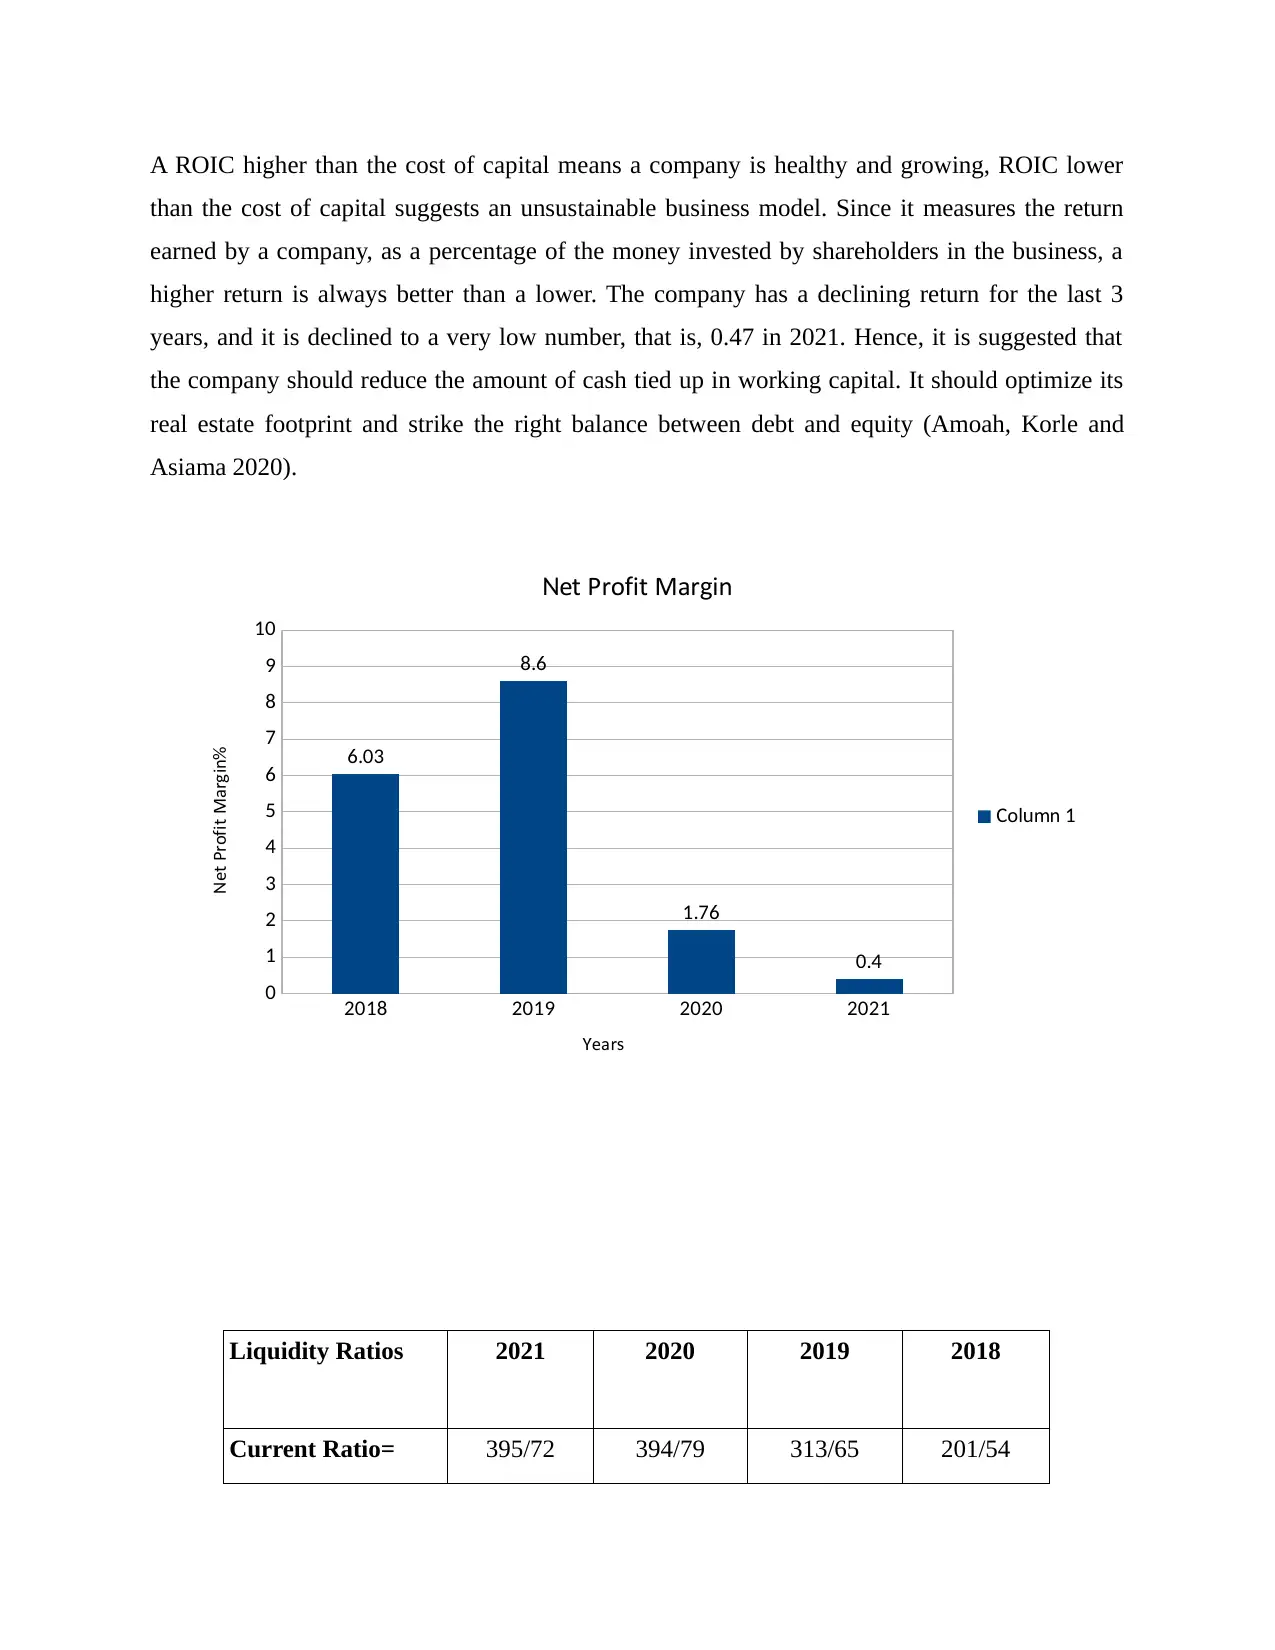
Net Profit Margin=
Net Profit/Sales
4/996
=0.40%
17/968
=1.76%
74/860
=8.60%
41/680
= 6.03%
Return on Invested
Capital=
Net Operating
Profit after
tax/Invested
Capital
15/32
=0.47
26/32
=0.81
82/14
=5.86
47/14
=3.36
Net Profit margin is one of the commonly used profitability ratios to gauge the degree to
which a business activity makes money. It is the financial ratio that finds the proportion of
revenue that finds its way into profits after meeting all expenses.
Comments:
The company has a declining profit for the last 3 years, that means the company is
making less money per £ of sales. This can be a result of a lower sale price or higher cost of
production, or both. If total sales fail to increase sufficiently to make up for such a decline in
profit ratios, total gross profits in the income statements will go down.
MACHINERY
Land and Building 282
Motor Vehicle 86
Plant and Machinery 110
Fixtures and Fittings 46
Total 524
Task 2: Calculation of Financial Ratios for Military Might Limited:
A ratio is defined as “the indicated quotient of two mathematical expressions and as the
relationship between two or more things”. Ratio Analysis is not just comparing different
numbers from the balance sheet, income statement, and cash flow statement. It is comparing the
number against previous years (intra firm comparison) and other companies (inter firm
comparison), the industry, or even the economy in general for the purpose of financial analysis.
Profitability Ratios 2021 2020 2019 2018
Net Profit Margin=
Net Profit/Sales
4/996
=0.40%
17/968
=1.76%
74/860
=8.60%
41/680
= 6.03%
Return on Invested
Capital=
Net Operating
Profit after
tax/Invested
Capital
15/32
=0.47
26/32
=0.81
82/14
=5.86
47/14
=3.36
Net Profit margin is one of the commonly used profitability ratios to gauge the degree to
which a business activity makes money. It is the financial ratio that finds the proportion of
revenue that finds its way into profits after meeting all expenses.
Comments:
The company has a declining profit for the last 3 years, that means the company is
making less money per £ of sales. This can be a result of a lower sale price or higher cost of
production, or both. If total sales fail to increase sufficiently to make up for such a decline in
profit ratios, total gross profits in the income statements will go down.
A ROIC higher than the cost of capital means a company is healthy and growing, ROIC lower
than the cost of capital suggests an unsustainable business model. Since it measures the return
earned by a company, as a percentage of the money invested by shareholders in the business, a
higher return is always better than a lower. The company has a declining return for the last 3
years, and it is declined to a very low number, that is, 0.47 in 2021. Hence, it is suggested that
the company should reduce the amount of cash tied up in working capital. It should optimize its
real estate footprint and strike the right balance between debt and equity (Amoah, Korle and
Asiama 2020).
Liquidity Ratios 2021 2020 2019 2018
Current Ratio= 395/72 394/79 313/65 201/54
2018 2019 2020 2021
0
1
2
3
4
5
6
7
8
9
10
6.03
8.6
1.76
0.4
et Pro it Mar inN f g
ol mnC u 1
earY s
et Pro it Mar inN f g %
⊘ This is a preview!⊘
Do you want full access?
Subscribe today to unlock all pages.
Trusted by 1+ million students worldwide
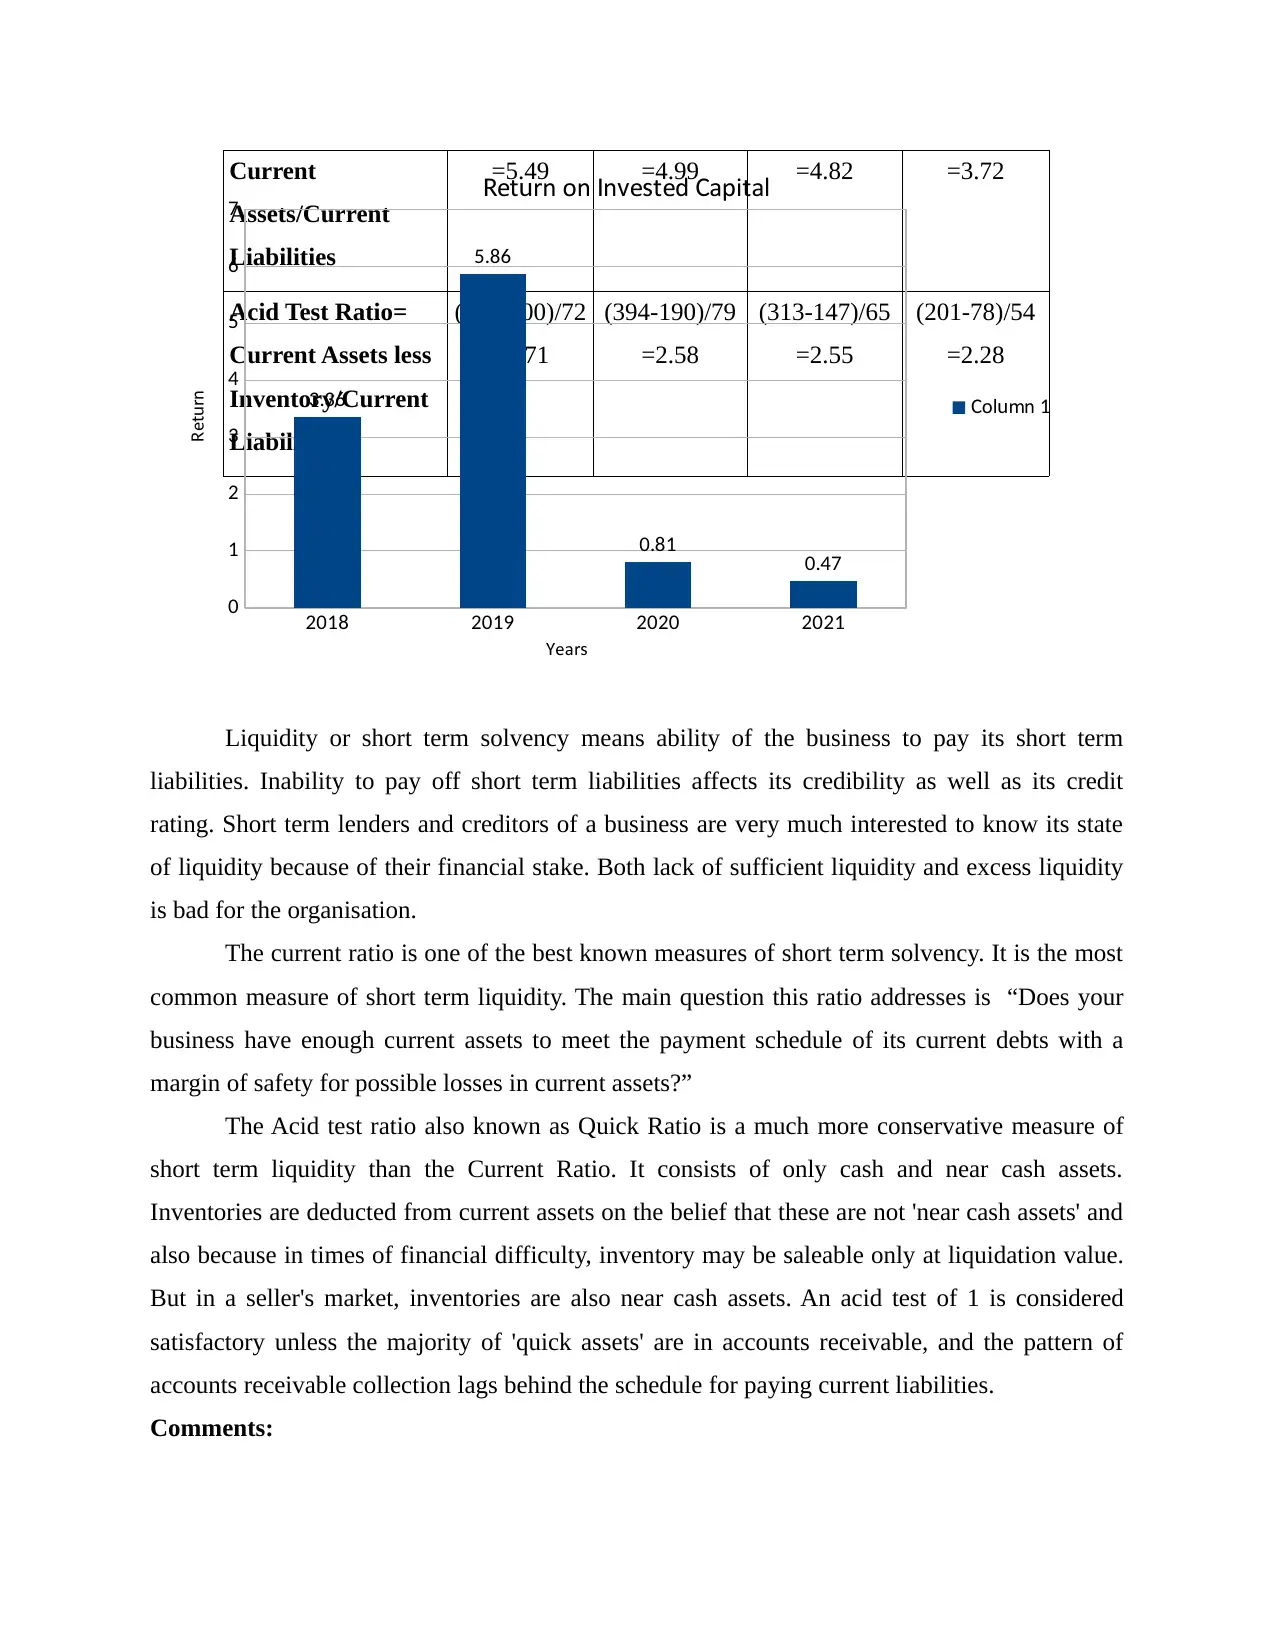
Current
Assets/Current
Liabilities
=5.49 =4.99 =4.82 =3.72
Acid Test Ratio=
Current Assets less
Inventory/Current
Liabilities
(395-200)/72
=2.71
(394-190)/79
=2.58
(313-147)/65
=2.55
(201-78)/54
=2.28
Liquidity or short term solvency means ability of the business to pay its short term
liabilities. Inability to pay off short term liabilities affects its credibility as well as its credit
rating. Short term lenders and creditors of a business are very much interested to know its state
of liquidity because of their financial stake. Both lack of sufficient liquidity and excess liquidity
is bad for the organisation.
The current ratio is one of the best known measures of short term solvency. It is the most
common measure of short term liquidity. The main question this ratio addresses is “Does your
business have enough current assets to meet the payment schedule of its current debts with a
margin of safety for possible losses in current assets?”
The Acid test ratio also known as Quick Ratio is a much more conservative measure of
short term liquidity than the Current Ratio. It consists of only cash and near cash assets.
Inventories are deducted from current assets on the belief that these are not 'near cash assets' and
also because in times of financial difficulty, inventory may be saleable only at liquidation value.
But in a seller's market, inventories are also near cash assets. An acid test of 1 is considered
satisfactory unless the majority of 'quick assets' are in accounts receivable, and the pattern of
accounts receivable collection lags behind the schedule for paying current liabilities.
Comments:
2018 2019 2020 2021
0
1
2
3
4
5
6
7
3.36
5.86
0.81 0.47
et rn on n e ted apitalR u I v s C
ol mnC u 1
earY s
et rnR u
Paraphrase This Document
Need a fresh take? Get an instant paraphrase of this document with our AI Paraphraser
The higher the current ratio, the more capable a company is for paying its obligations
because it has a larger proportion of short term asset value relative to the value of its short term
liabilities. The company has an increasing current ratio from last 4 years. However, if the current
ratio is too high i.e. above 2, it might be that the company is unable to use its current assets or its
short term financing facilities efficiently. This implies that the resources may be tied up in the
company's working capital and are not put to use in profitable ways. In this case, the company
needs to stop playing safe and reduce it so as to have an optimum liquidity position.
The company has an increasing acid test ratio but its acid test ratio is much lower than the
current ratio. If the acid-test ratio is much lower than the current ratio, it means that the
company's current assets are highly dependent on inventory. On the other hand, an increasing
acid test ratio indicates a company has faster inventory turnover and cash conversion cycles
(Baloch and Meng 2019).
Efficiency Ratios 2021 2020 2019 2018
Inventory Turnover
Ratio=
COGS/Ending
Inventory
645/200
=3.23
630/190
=3.32
478/147
=3.25
280/78
=3.59
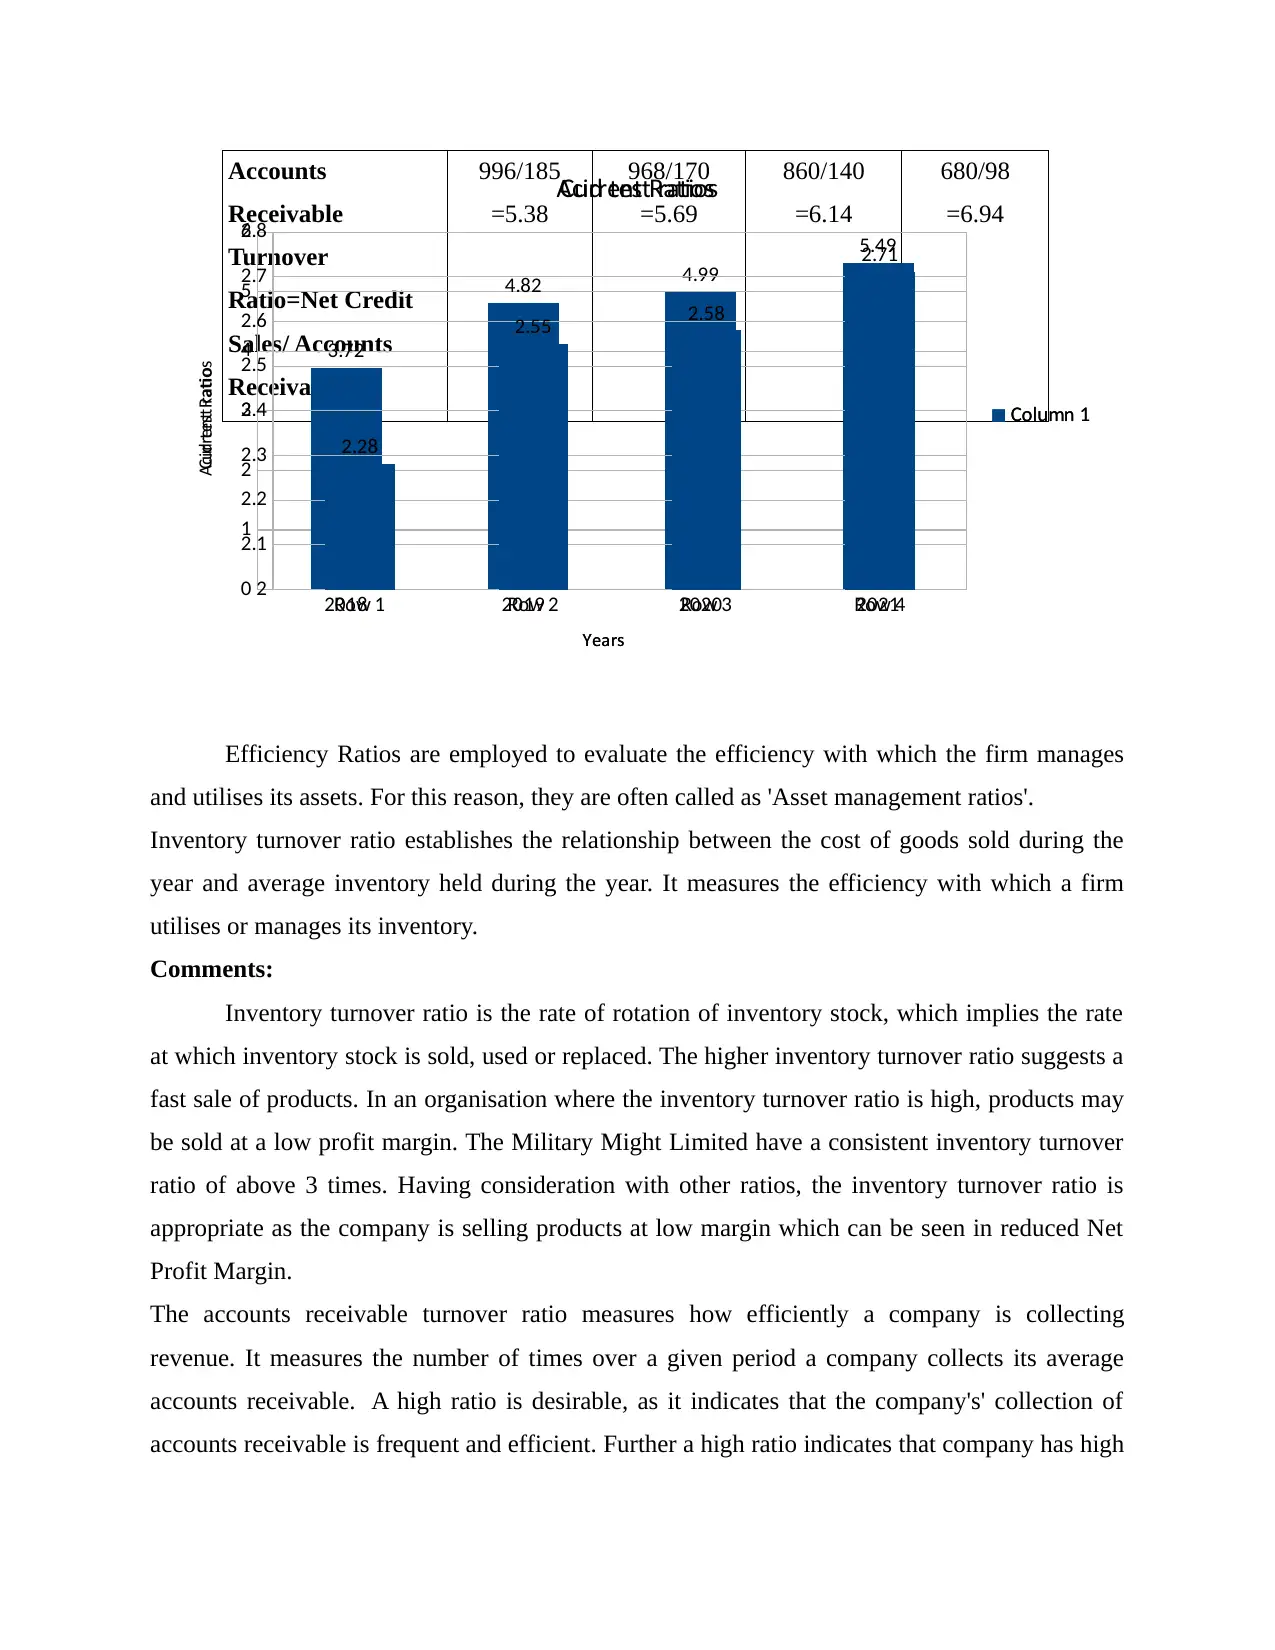
Accounts
Receivable
Turnover
Ratio=Net Credit
Sales/ Accounts
Receivables
996/185
=5.38
968/170
=5.69
860/140
=6.14
680/98
=6.94
Efficiency Ratios are employed to evaluate the efficiency with which the firm manages
and utilises its assets. For this reason, they are often called as 'Asset management ratios'.
Inventory turnover ratio establishes the relationship between the cost of goods sold during the
year and average inventory held during the year. It measures the efficiency with which a firm
utilises or manages its inventory.
Comments:
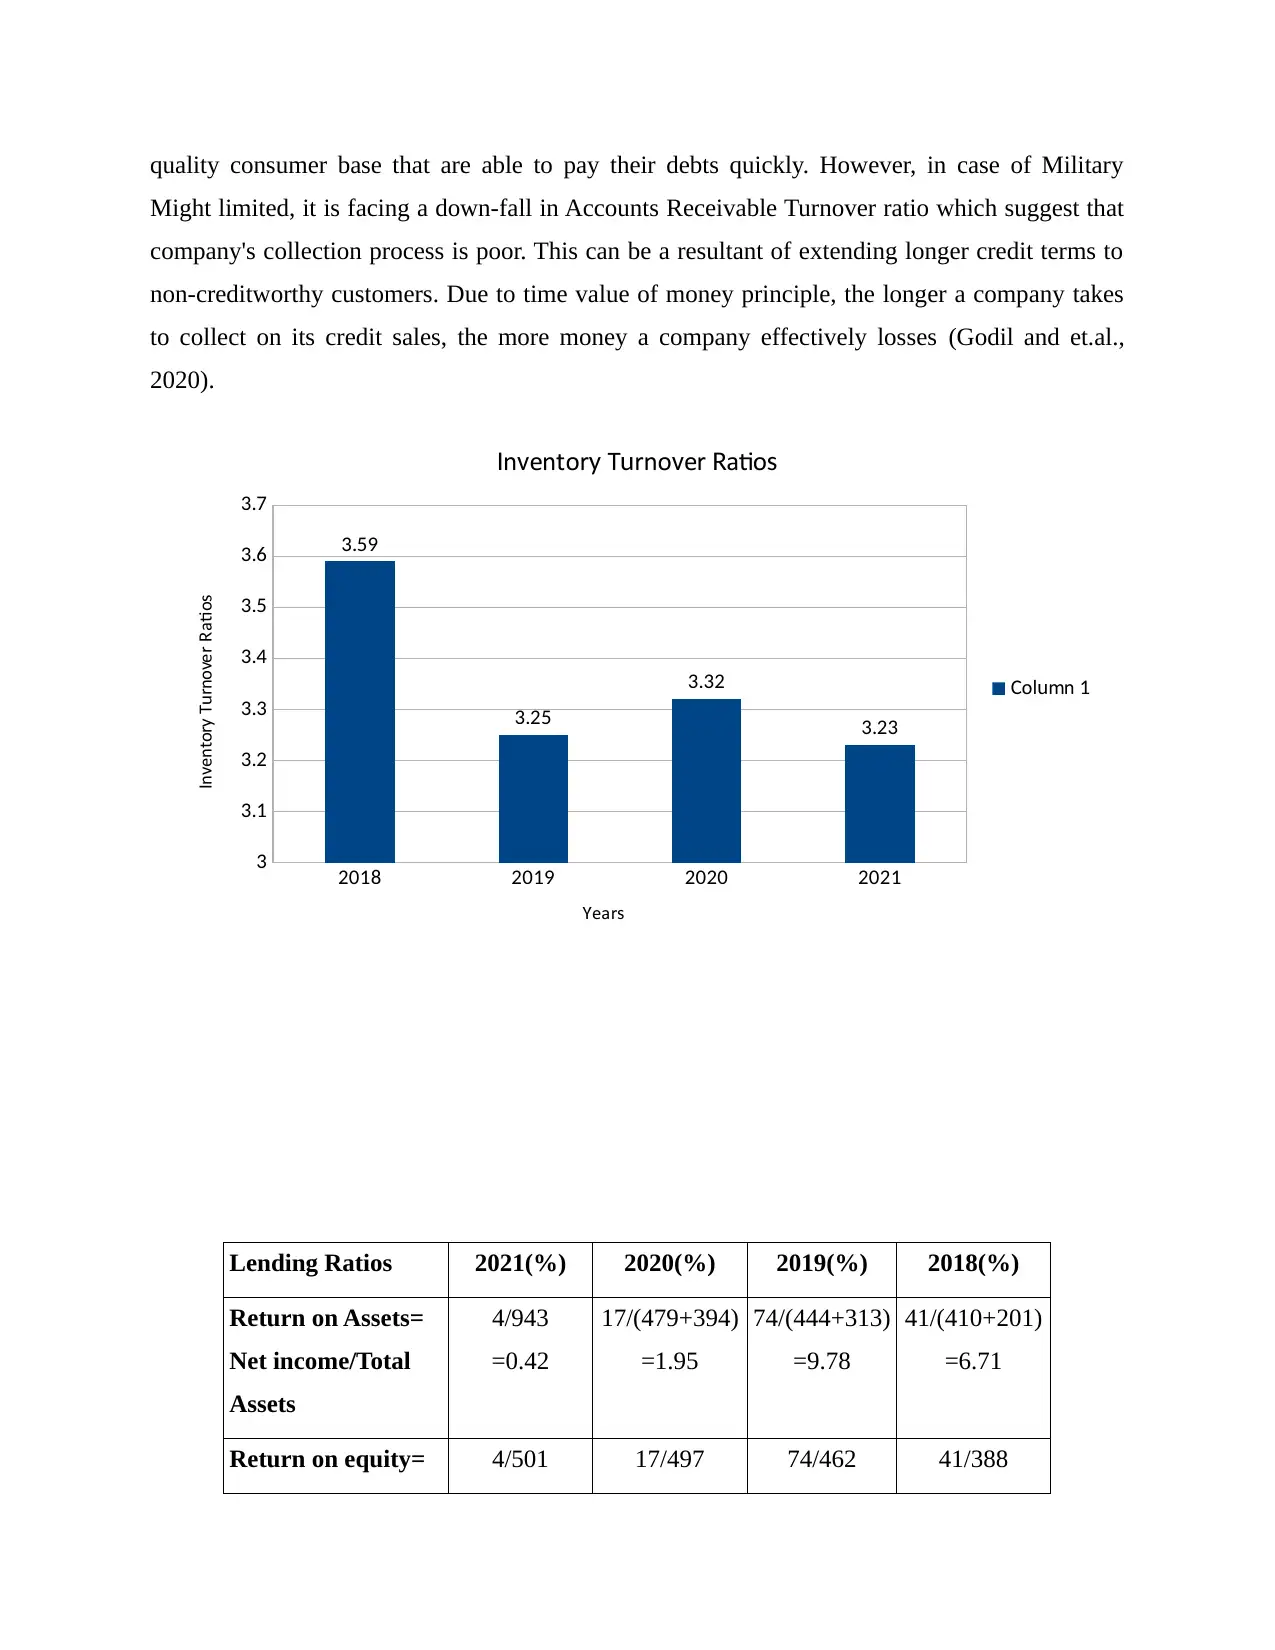
Inventory turnover ratio is the rate of rotation of inventory stock, which implies the rate
at which inventory stock is sold, used or replaced. The higher inventory turnover ratio suggests a
fast sale of products. In an organisation where the inventory turnover ratio is high, products may
be sold at a low profit margin. The Military Might Limited have a consistent inventory turnover
ratio of above 3 times. Having consideration with other ratios, the inventory turnover ratio is
appropriate as the company is selling products at low margin which can be seen in reduced Net
Profit Margin.
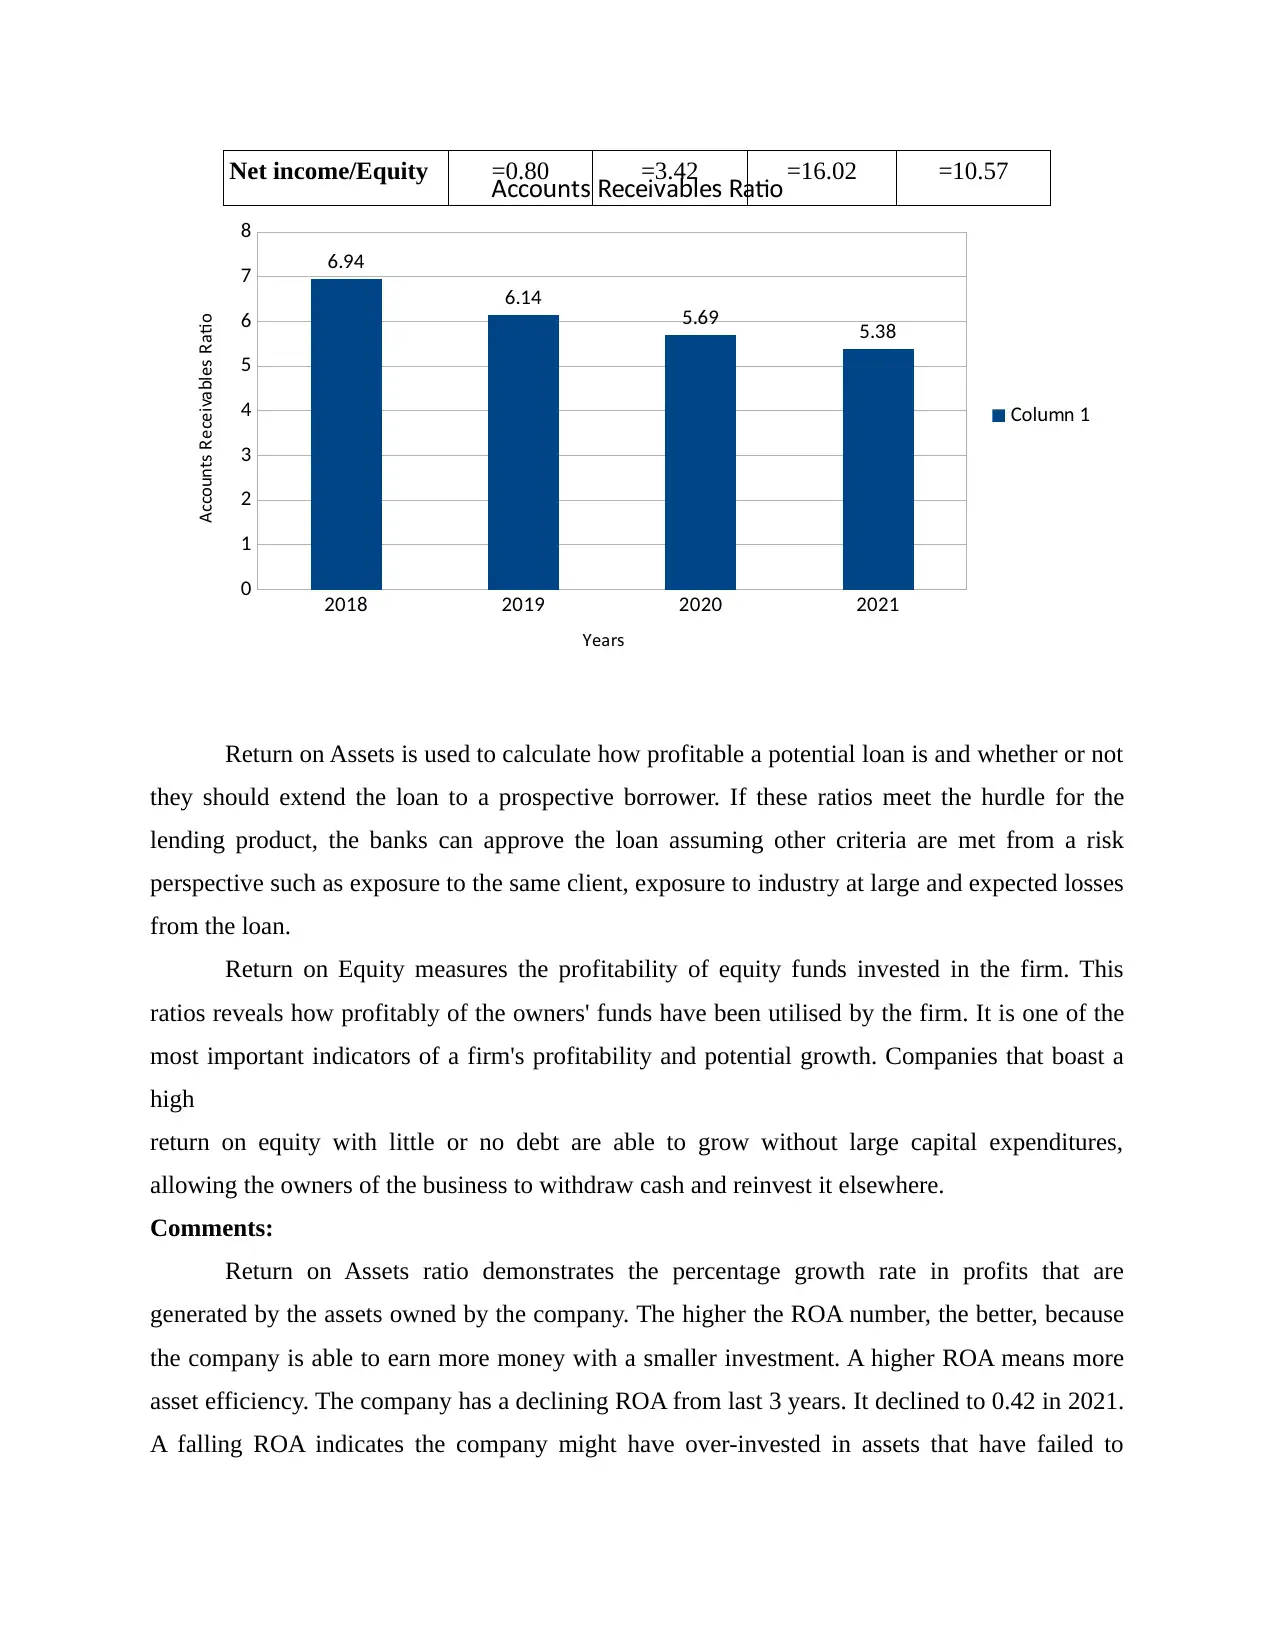
The accounts receivable turnover ratio measures how efficiently a company is collecting
revenue. It measures the number of times over a given period a company collects its average
accounts receivable. A high ratio is desirable, as it indicates that the company's' collection of
accounts receivable is frequent and efficient. Further a high ratio indicates that company has high
2018 2019 2020 2021
0
1
2
3
4
5
6
3.72
4.82 4.99
5.49
rrent atioCu R s
ol mnC u 1
earY s
rrent atioCu R
oR w 1 oR w 2 oR w 3 oR w 4
2
2.1
2.2
2.3
2.4
2.5
2.6
2.7
2.8
2.28
2.55 2.58
2.71
Acid te t ratios s
ol mnC u 1
earY s
Acid te t ratios s
Receivable
Turnover
Ratio=Net Credit
Sales/ Accounts
Receivables
996/185
=5.38
968/170
=5.69
860/140
=6.14
680/98
=6.94
Efficiency Ratios are employed to evaluate the efficiency with which the firm manages
and utilises its assets. For this reason, they are often called as 'Asset management ratios'.
Inventory turnover ratio establishes the relationship between the cost of goods sold during the
year and average inventory held during the year. It measures the efficiency with which a firm
utilises or manages its inventory.
Comments:
Inventory turnover ratio is the rate of rotation of inventory stock, which implies the rate
at which inventory stock is sold, used or replaced. The higher inventory turnover ratio suggests a
fast sale of products. In an organisation where the inventory turnover ratio is high, products may
be sold at a low profit margin. The Military Might Limited have a consistent inventory turnover
ratio of above 3 times. Having consideration with other ratios, the inventory turnover ratio is
appropriate as the company is selling products at low margin which can be seen in reduced Net
Profit Margin.
The accounts receivable turnover ratio measures how efficiently a company is collecting
revenue. It measures the number of times over a given period a company collects its average
accounts receivable. A high ratio is desirable, as it indicates that the company's' collection of
accounts receivable is frequent and efficient. Further a high ratio indicates that company has high
2018 2019 2020 2021
0
1
2
3
4
5
6
3.72
4.82 4.99
5.49
rrent atioCu R s
ol mnC u 1
earY s
rrent atioCu R
oR w 1 oR w 2 oR w 3 oR w 4
2
2.1
2.2
2.3
2.4
2.5
2.6
2.7
2.8
2.28
2.55 2.58
2.71
Acid te t ratios s
ol mnC u 1
earY s
Acid te t ratios s
⊘ This is a preview!⊘
Do you want full access?
Subscribe today to unlock all pages.
Trusted by 1+ million students worldwide
quality consumer base that are able to pay their debts quickly. However, in case of Military
Might limited, it is facing a down-fall in Accounts Receivable Turnover ratio which suggest that
company's collection process is poor. This can be a resultant of extending longer credit terms to
non-creditworthy customers. Due to time value of money principle, the longer a company takes
to collect on its credit sales, the more money a company effectively losses (Godil and et.al.,
2020).
Lending Ratios 2021(%) 2020(%) 2019(%) 2018(%)
Return on Assets=
Net income/Total
Assets
4/943
=0.42
17/(479+394)
=1.95
74/(444+313)
=9.78
41/(410+201)
=6.71
Return on equity= 4/501 17/497 74/462 41/388
2018 2019 2020 2021
3
3.1
3.2
3.3
3.4
3.5
3.6
3.7
3.59
3.25
3.32
3.23
n entor T rno er atioI v y u v R s
ol mnC u 1
earY s
n entor T rno er atioI v y u v R s
Paraphrase This Document
Need a fresh take? Get an instant paraphrase of this document with our AI Paraphraser
Net income/Equity =0.80 =3.42 =16.02 =10.57
Return on Assets is used to calculate how profitable a potential loan is and whether or not
they should extend the loan to a prospective borrower. If these ratios meet the hurdle for the
lending product, the banks can approve the loan assuming other criteria are met from a risk
perspective such as exposure to the same client, exposure to industry at large and expected losses
from the loan.
Return on Equity measures the profitability of equity funds invested in the firm. This
ratios reveals how profitably of the owners' funds have been utilised by the firm. It is one of the
most important indicators of a firm's profitability and potential growth. Companies that boast a
high
return on equity with little or no debt are able to grow without large capital expenditures,
allowing the owners of the business to withdraw cash and reinvest it elsewhere.
Comments:
Return on Assets ratio demonstrates the percentage growth rate in profits that are
generated by the assets owned by the company. The higher the ROA number, the better, because
the company is able to earn more money with a smaller investment. A higher ROA means more
asset efficiency. The company has a declining ROA from last 3 years. It declined to 0.42 in 2021.
A falling ROA indicates the company might have over-invested in assets that have failed to
2018 2019 2020 2021
0
1
2
3
4
5
6
7
8
6.94
6.14 5.69 5.38
Acco nt ecei a le atiou s R v b s R
ol mnC u 1
earY s
Acco nt ecei a le atiou s R v b s R
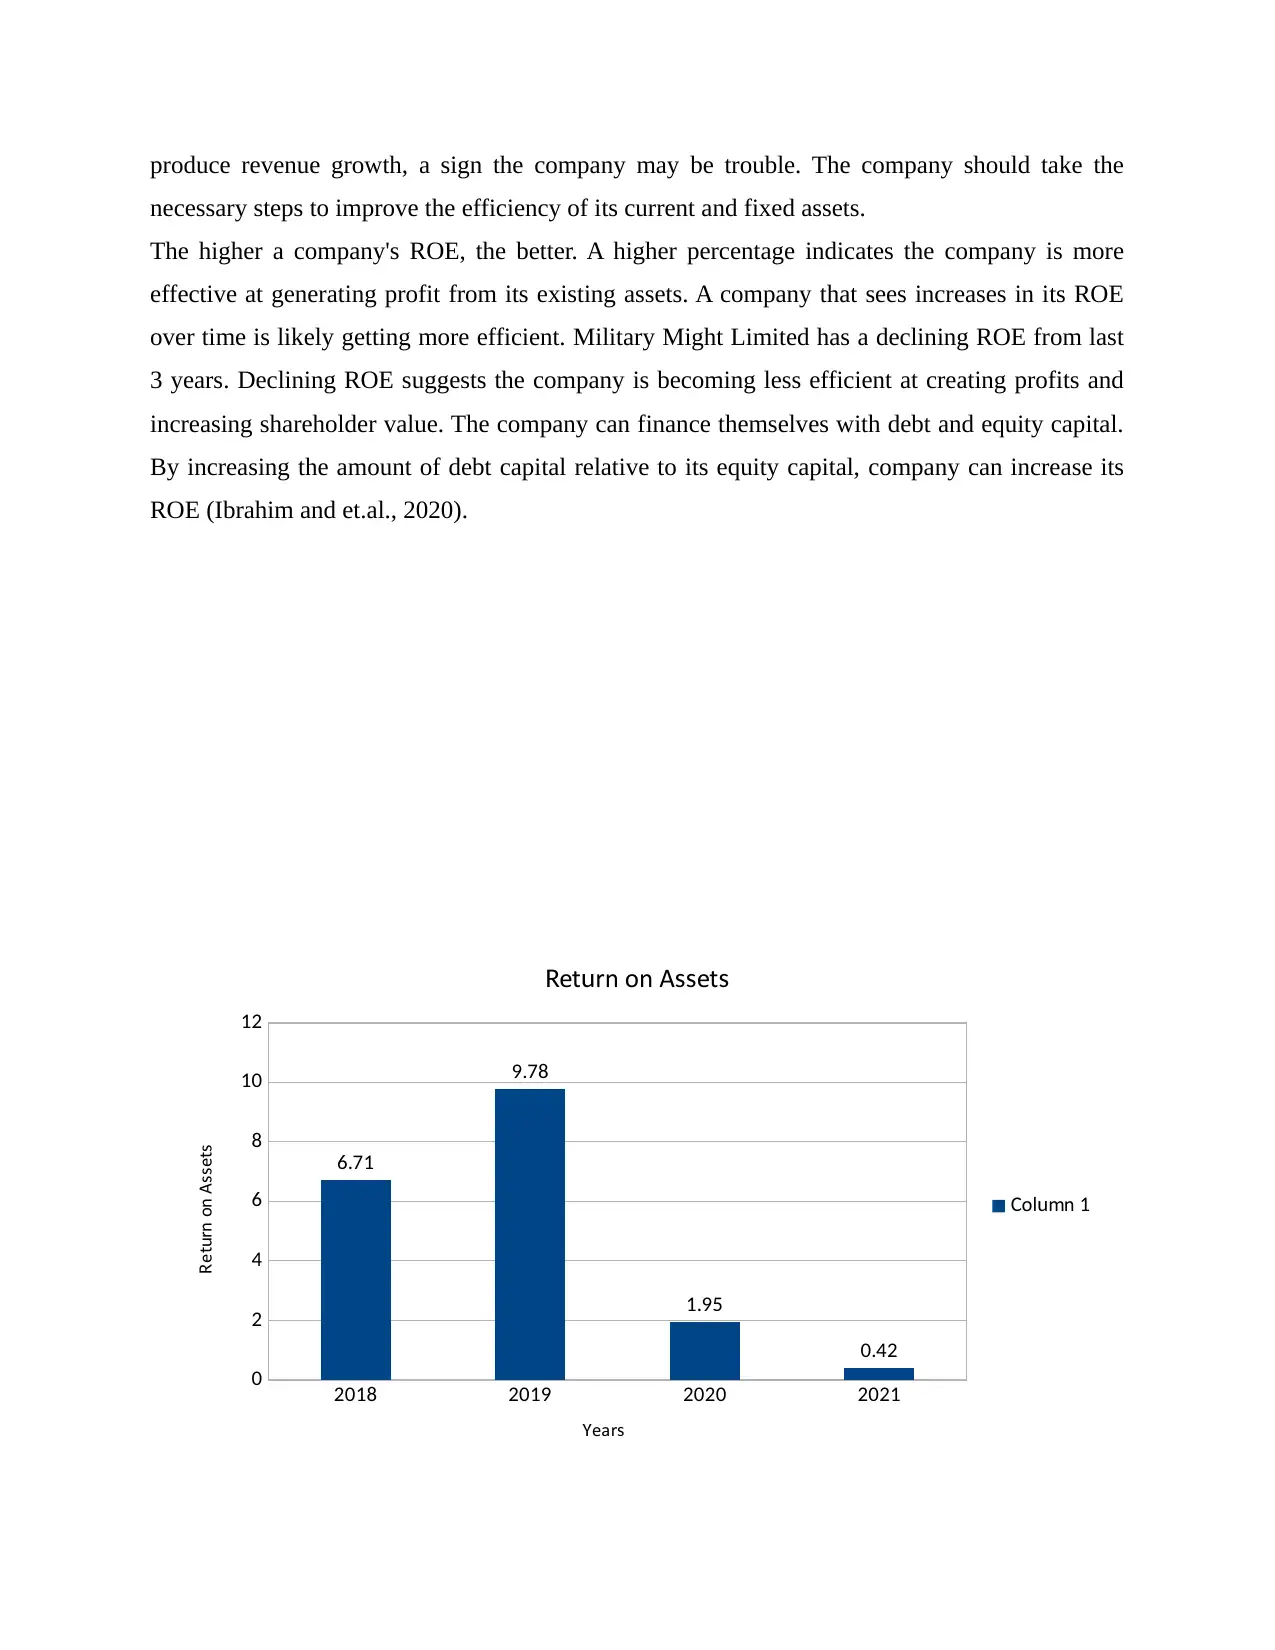
produce revenue growth, a sign the company may be trouble. The company should take the
necessary steps to improve the efficiency of its current and fixed assets.
The higher a company's ROE, the better. A higher percentage indicates the company is more
effective at generating profit from its existing assets. A company that sees increases in its ROE
over time is likely getting more efficient. Military Might Limited has a declining ROE from last
3 years. Declining ROE suggests the company is becoming less efficient at creating profits and
increasing shareholder value. The company can finance themselves with debt and equity capital.
By increasing the amount of debt capital relative to its equity capital, company can increase its
ROE (Ibrahim and et.al., 2020).
2018 2019 2020 2021
0
2
4
6
8
10
12
6.71
9.78
1.95
0.42
et rn on A etR u ss s
ol mnC u 1
earY s
et rn on A etR u ss s
⊘ This is a preview!⊘
Do you want full access?
Subscribe today to unlock all pages.
Trusted by 1+ million students worldwide
1 out of 17
Related Documents


Your All-in-One AI-Powered Toolkit for Academic Success.
+13062052269
info@desklib.com
Available 24*7 on WhatsApp / Email
![[object Object]](/_next/static/media/star-bottom.7253800d.svg)
Unlock your academic potential
Copyright © 2020–2026 A2Z Services. All Rights Reserved. Developed and managed by ZUCOL.