Financial Analysis Report: Morrisons PLC & Tesco PLC - 2017
VerifiedAdded on 2021/04/16
|9
|1990
|21
Report
AI Summary
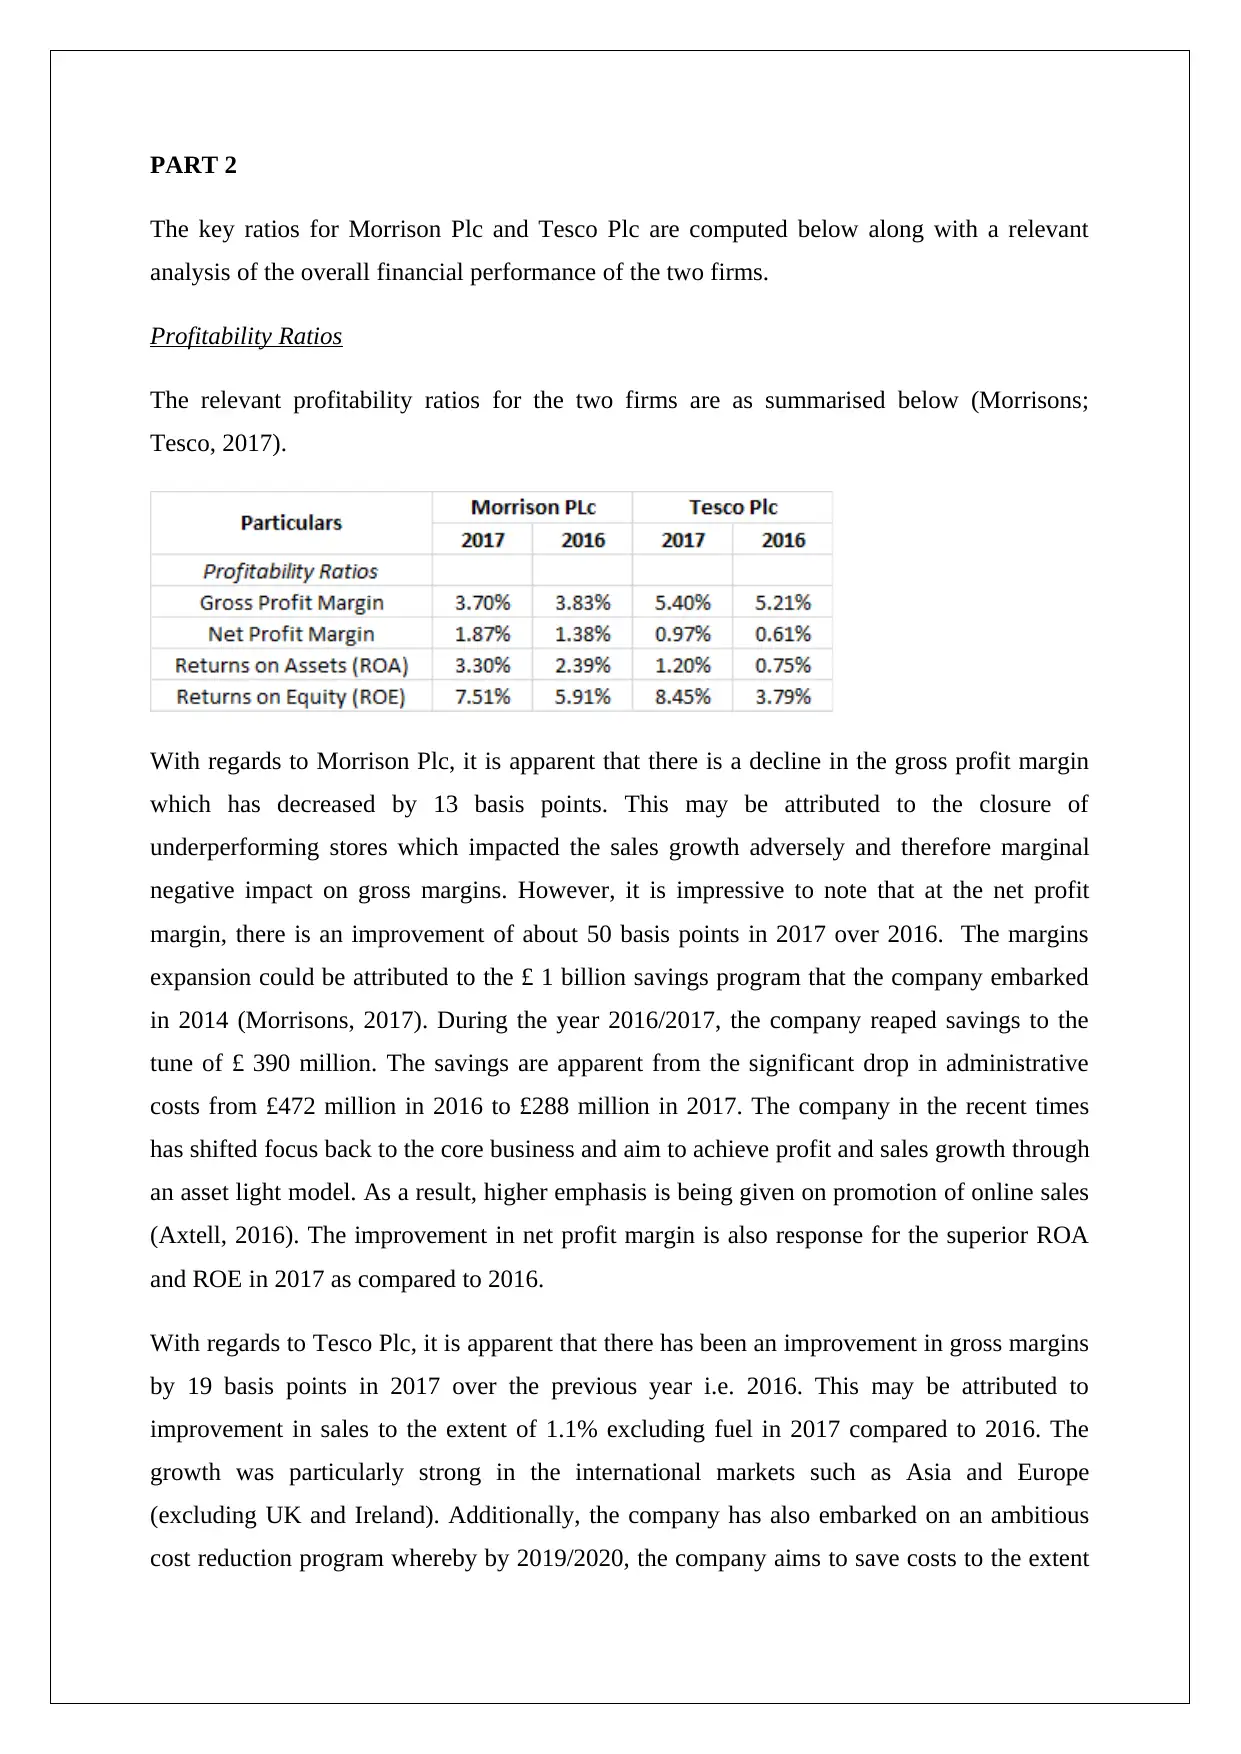
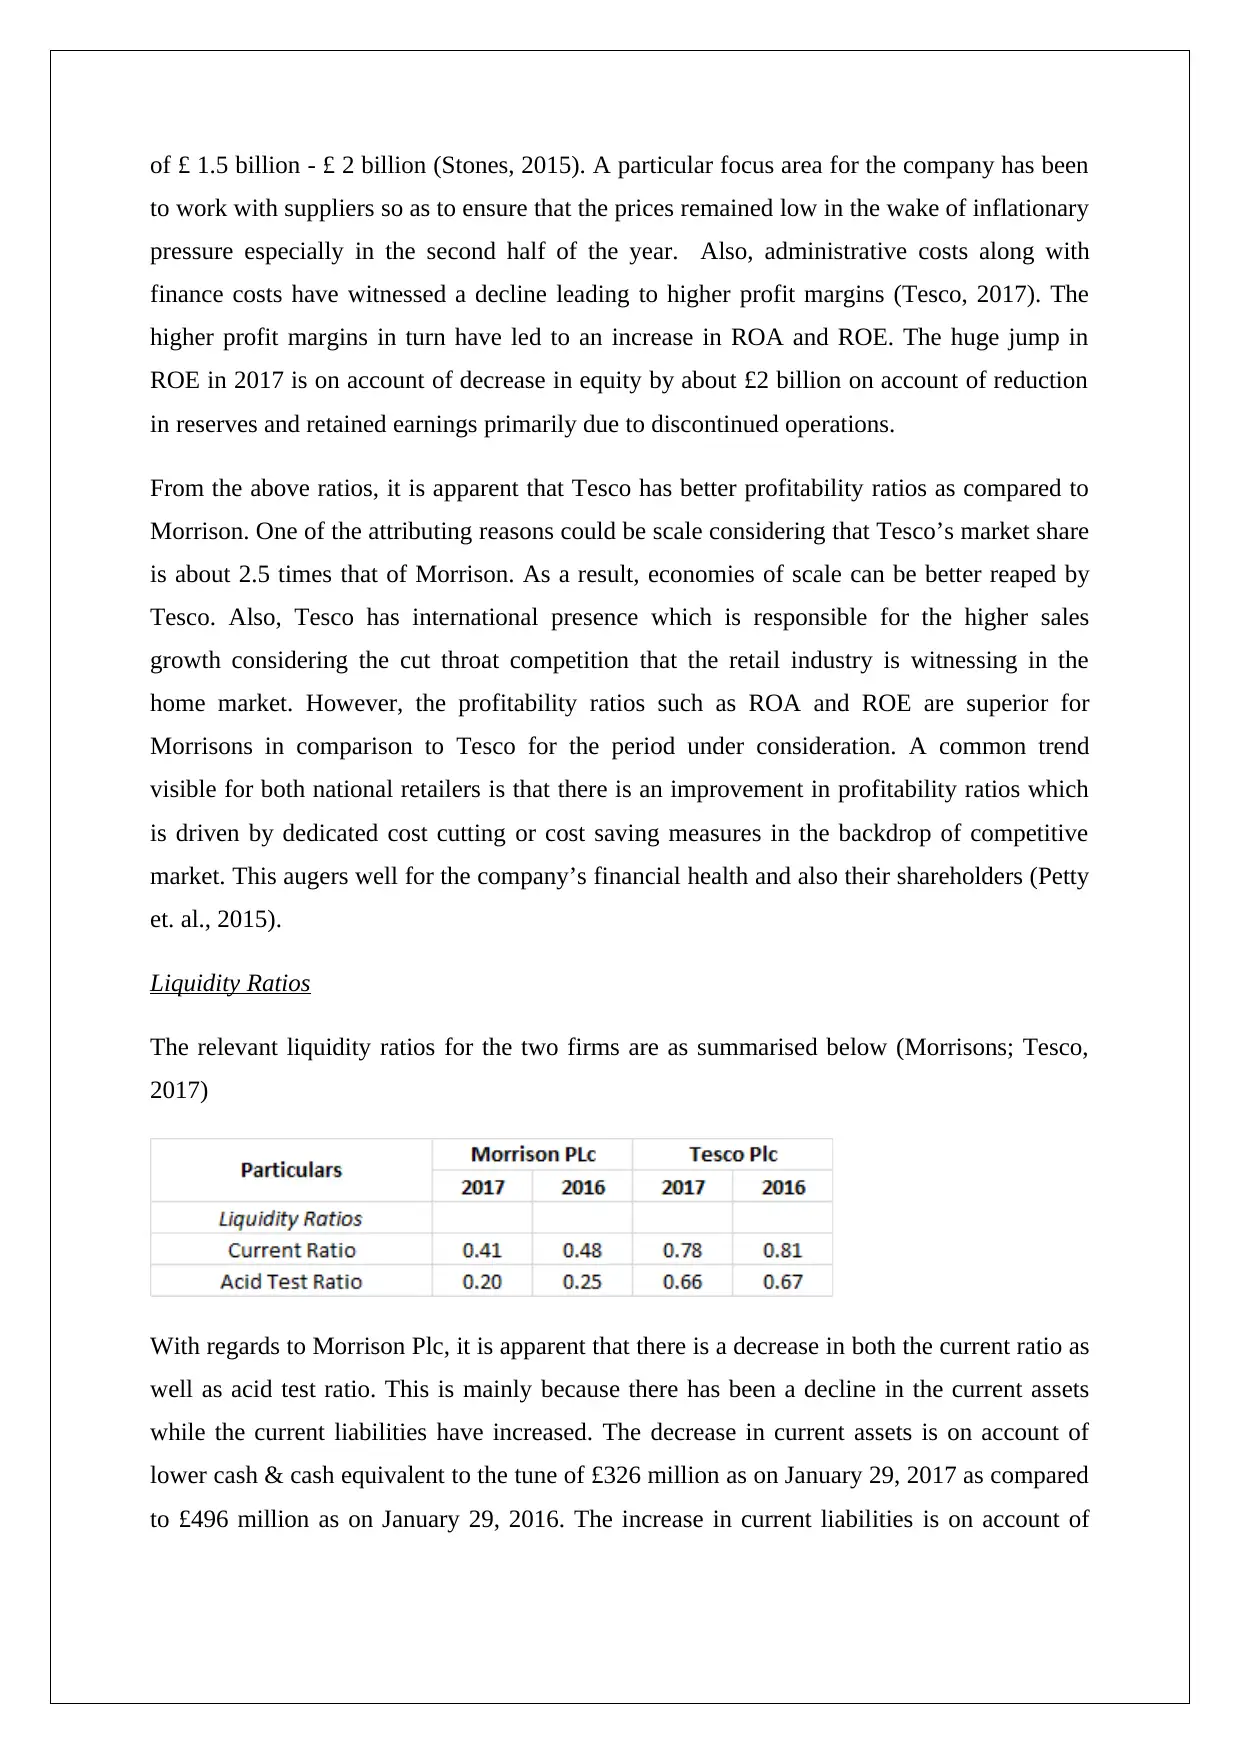
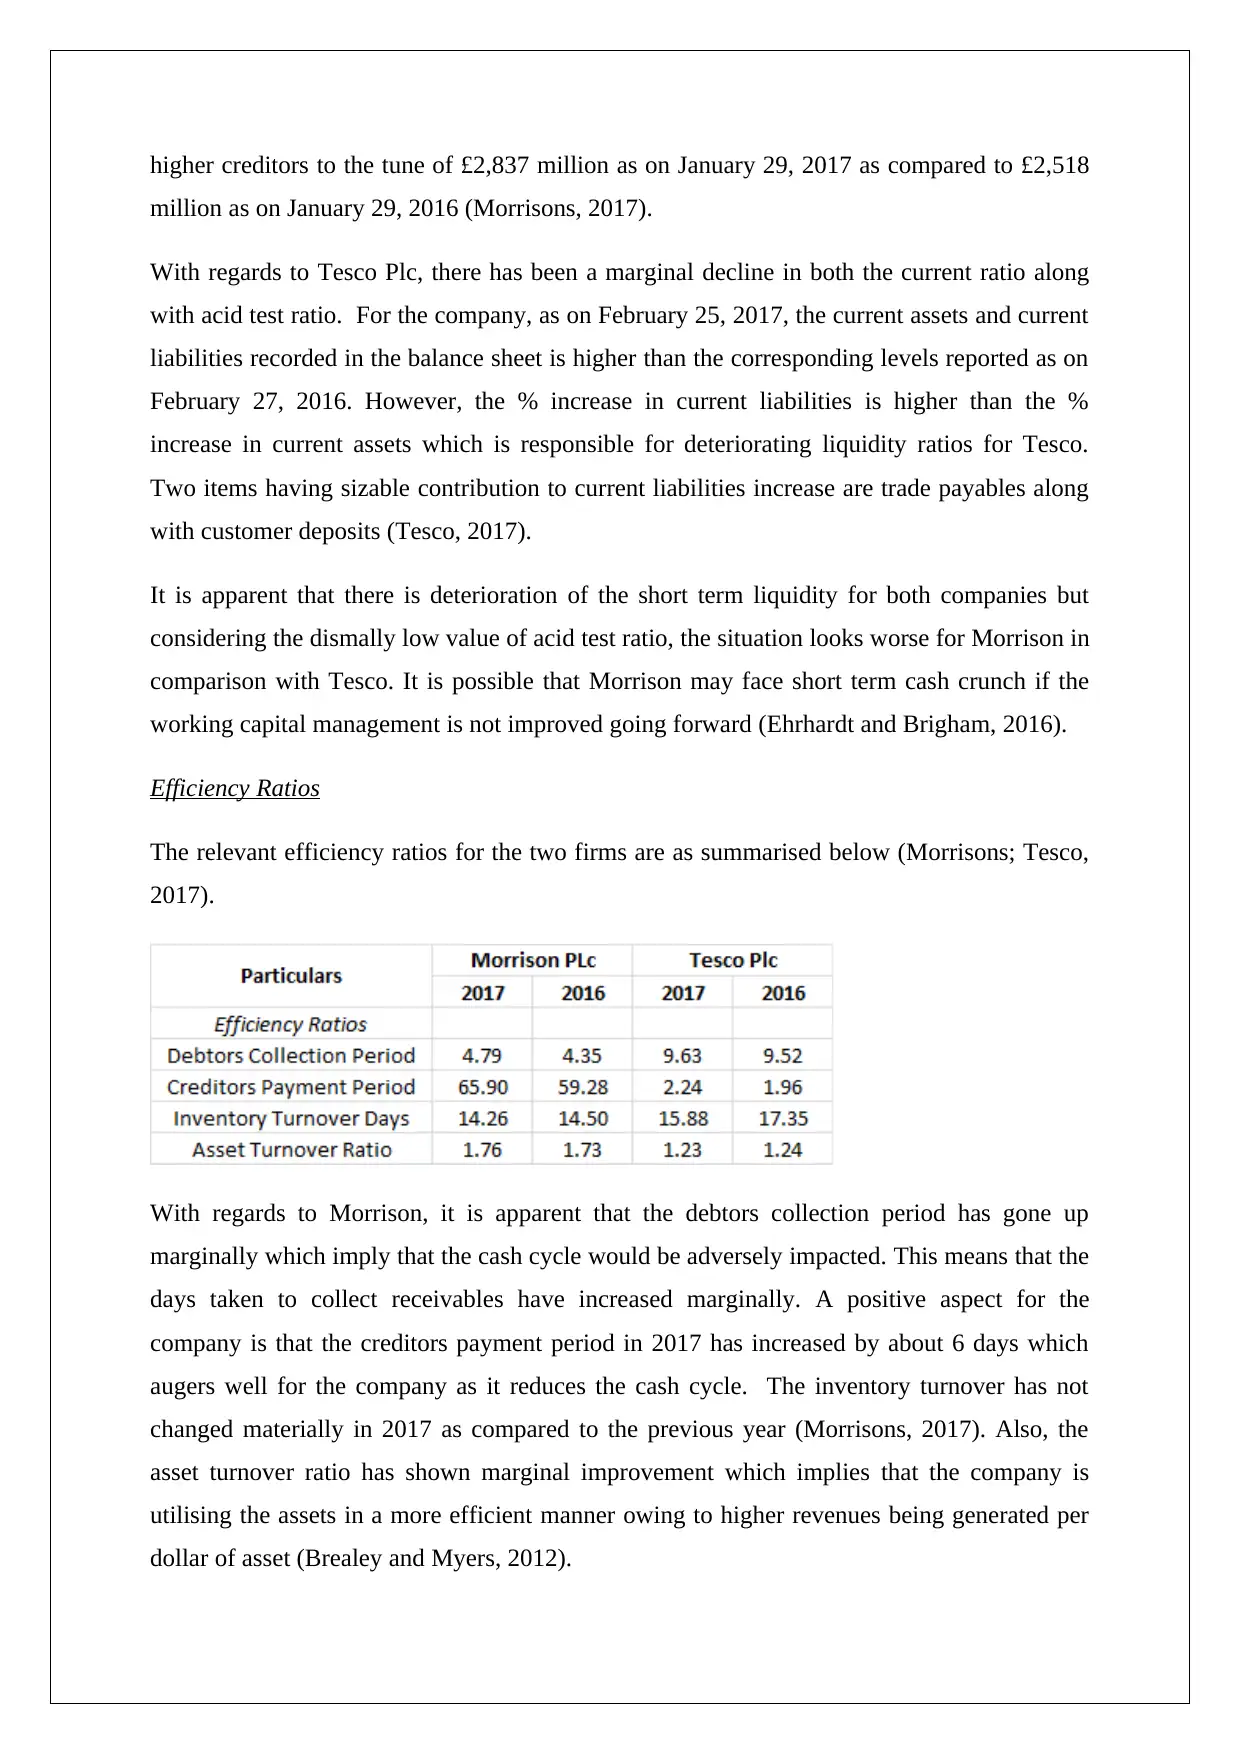
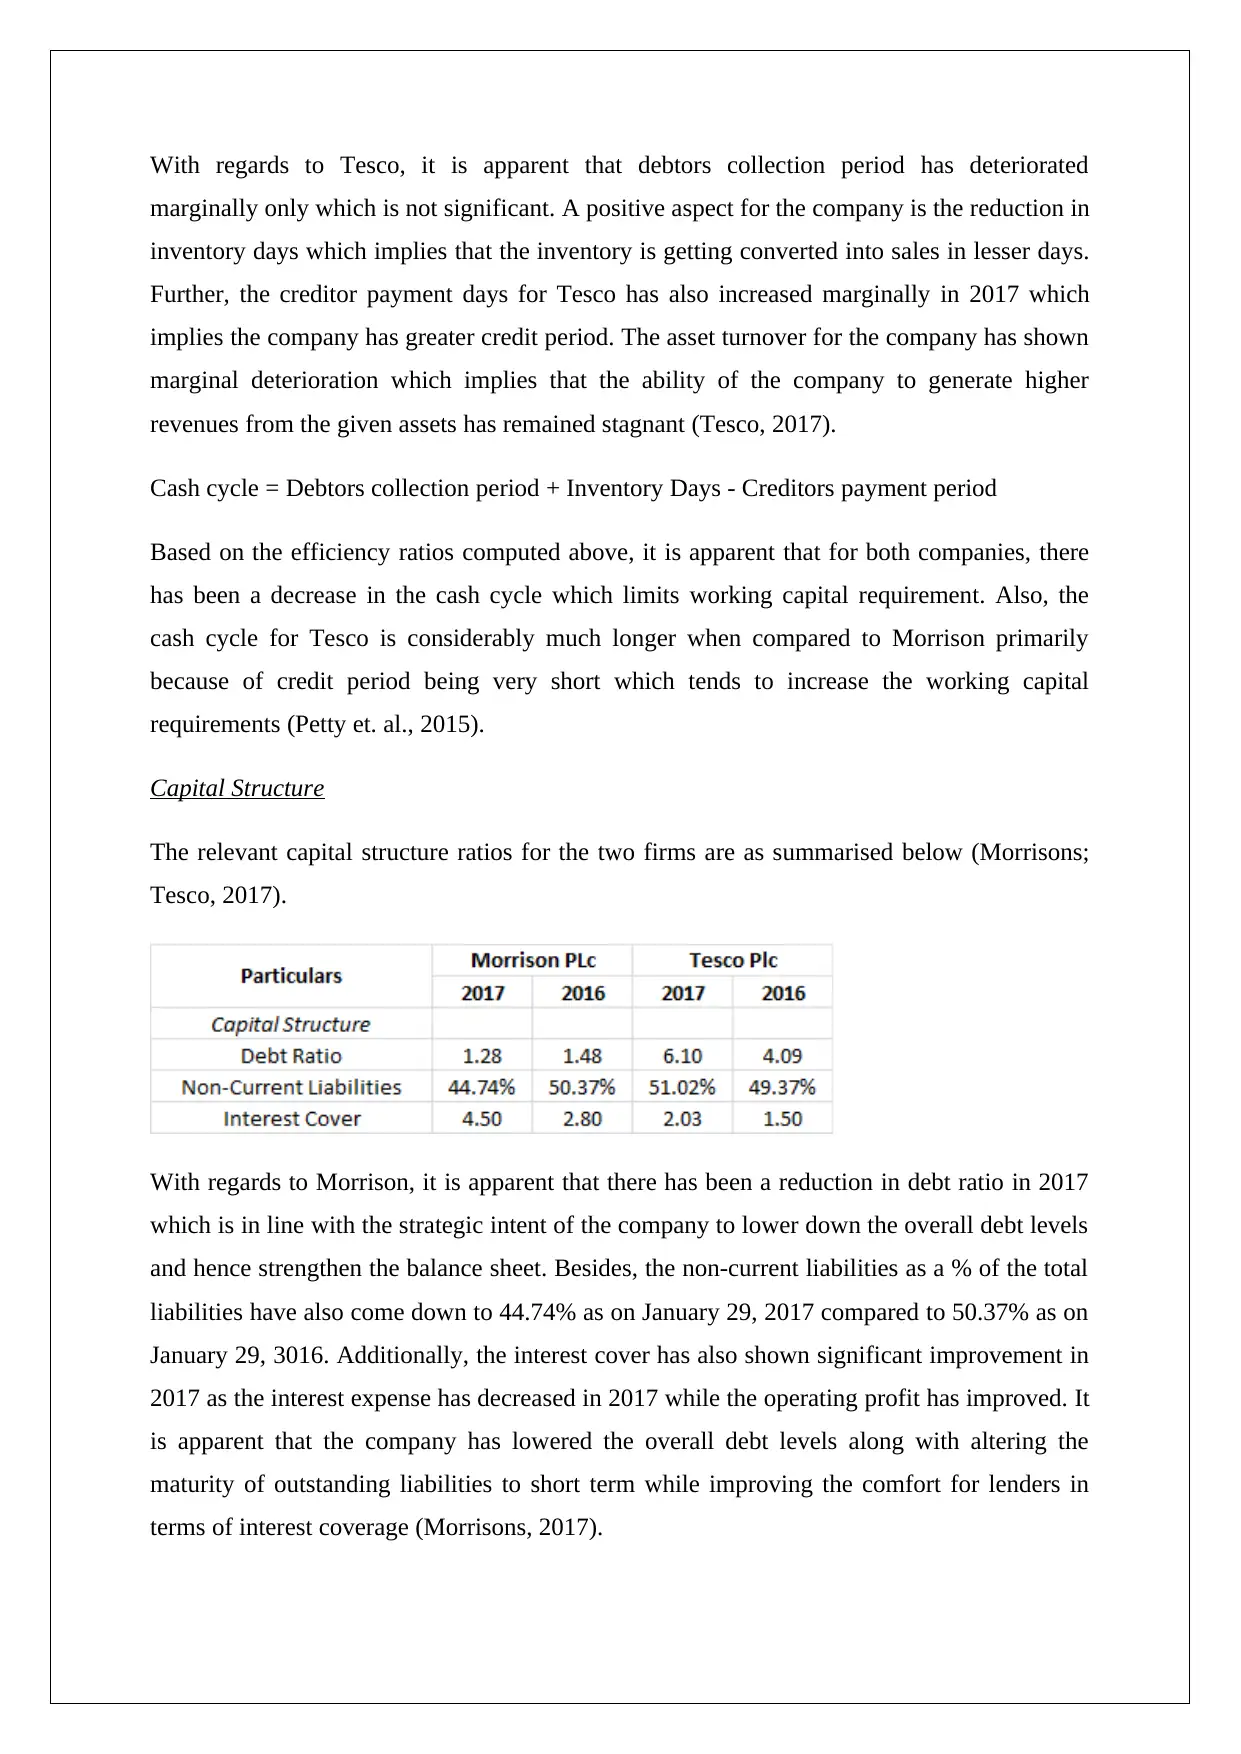
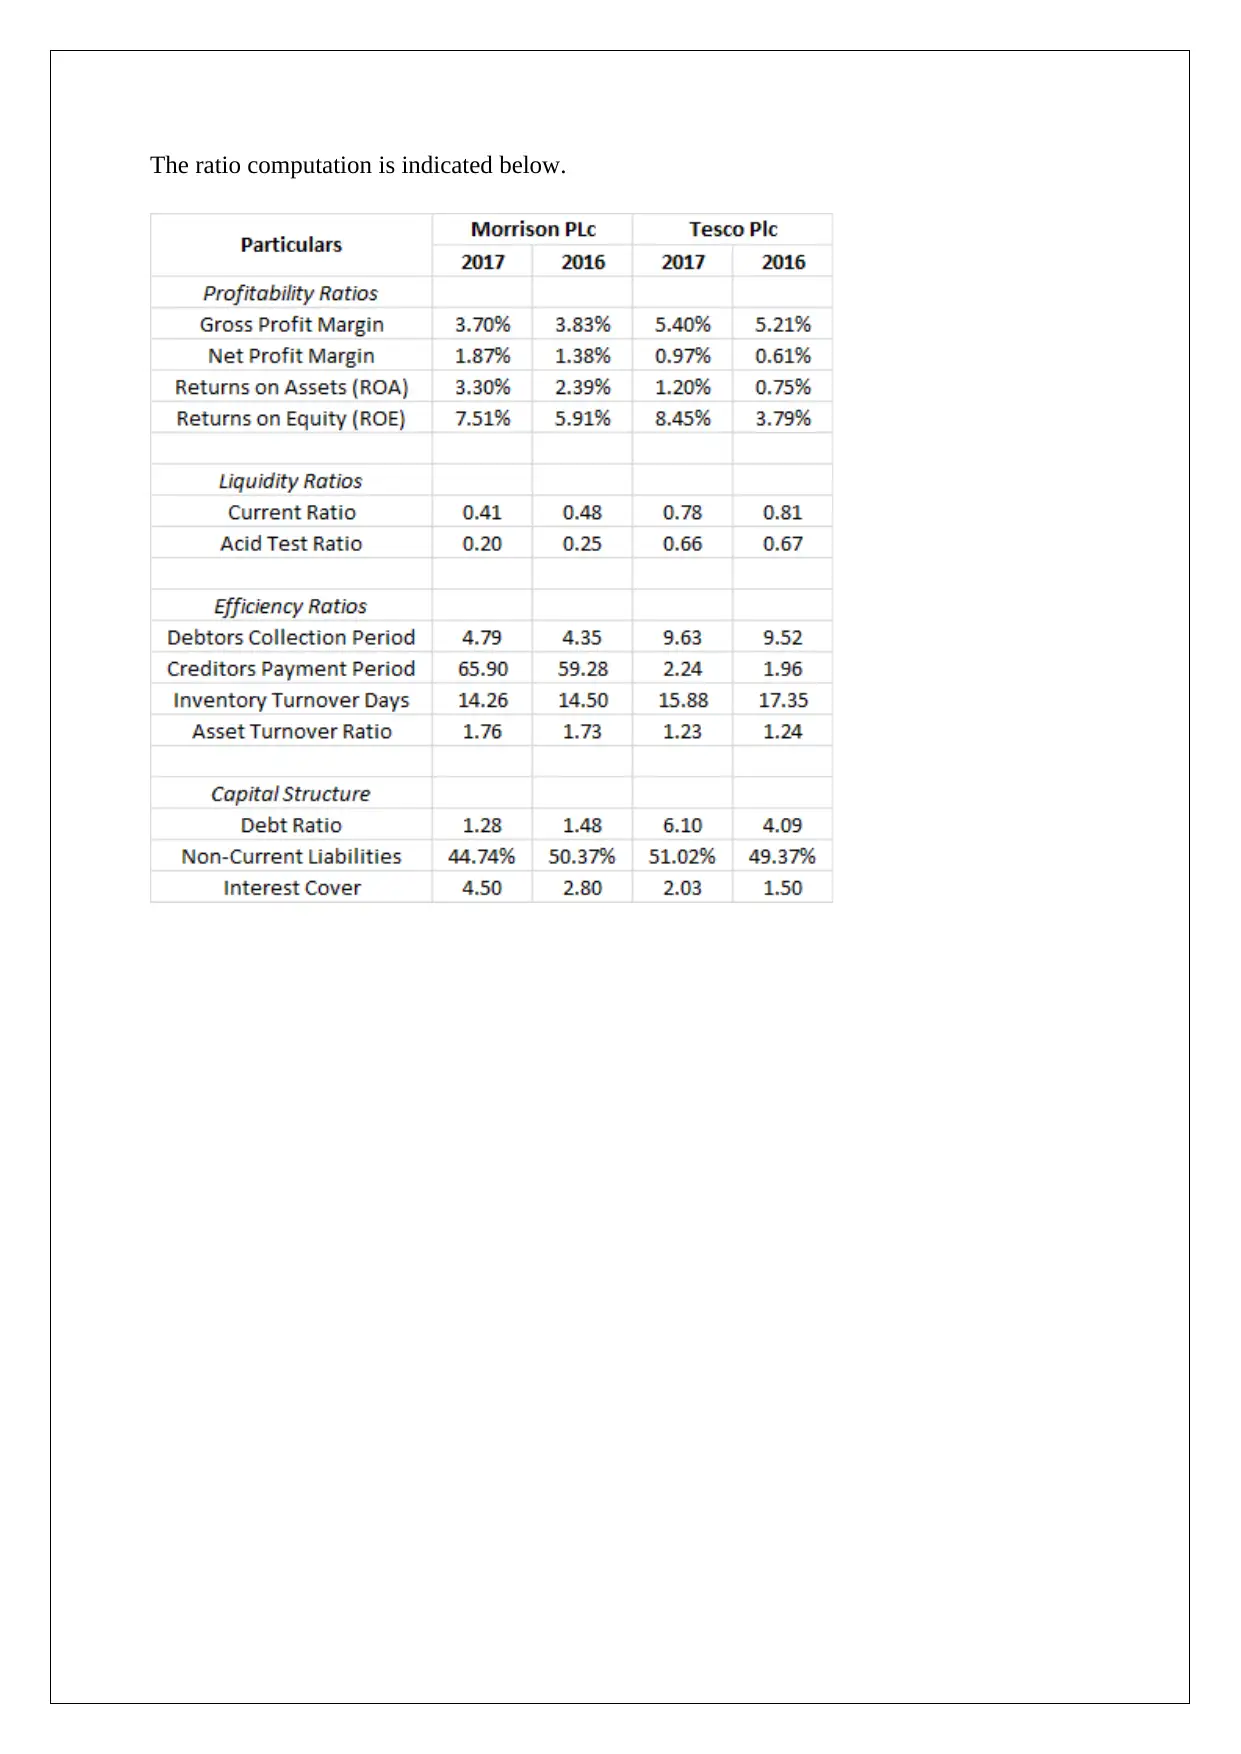
This report presents a comprehensive financial analysis of Morrisons PLC and Tesco PLC, focusing on their performance in 2017. The analysis encompasses key financial ratios, including profitability (gross profit margin, net profit margin, ROA, ROE), liquidity (current ratio, acid test ratio), efficiency (debtors collection period, inventory turnover, creditors payment period, asset turnover), and capital structure (debt ratio, interest cover). The report compares the two companies, highlighting their strengths and weaknesses based on the computed ratios and trends. It notes that Tesco generally demonstrates better profitability ratios, while Morrisons exhibits superior ROA and ROE. Both companies are seen to be improving profitability through cost-cutting measures. The analysis also reveals that both companies have reduced their debt levels and improved interest coverage, with Morrisons showing greater deleveraging. The report utilizes data from the companies' annual reports and provides relevant references to support the analysis.

Accounting Financial
Analysis Report
Morrisons PLC & Tesco PLC
STUDENT ID:
[Pick the date]
Analysis Report
Morrisons PLC & Tesco PLC
STUDENT ID:
[Pick the date]
Paraphrase This Document
Need a fresh take? Get an instant paraphrase of this document with our AI Paraphraser

PART 2
The key ratios for Morrison Plc and Tesco Plc are computed below along with a relevant
analysis of the overall financial performance of the two firms.
Profitability Ratios
The relevant profitability ratios for the two firms are as summarised below (Morrisons;
Tesco, 2017).
With regards to Morrison Plc, it is apparent that there is a decline in the gross profit margin
which has decreased by 13 basis points. This may be attributed to the closure of
underperforming stores which impacted the sales growth adversely and therefore marginal
negative impact on gross margins. However, it is impressive to note that at the net profit
margin, there is an improvement of about 50 basis points in 2017 over 2016. The margins
expansion could be attributed to the £ 1 billion savings program that the company embarked
in 2014 (Morrisons, 2017). During the year 2016/2017, the company reaped savings to the
tune of £ 390 million. The savings are apparent from the significant drop in administrative
costs from £472 million in 2016 to £288 million in 2017. The company in the recent times
has shifted focus back to the core business and aim to achieve profit and sales growth through
an asset light model. As a result, higher emphasis is being given on promotion of online sales
(Axtell, 2016). The improvement in net profit margin is also response for the superior ROA
and ROE in 2017 as compared to 2016.
With regards to Tesco Plc, it is apparent that there has been an improvement in gross margins
by 19 basis points in 2017 over the previous year i.e. 2016. This may be attributed to
improvement in sales to the extent of 1.1% excluding fuel in 2017 compared to 2016. The
growth was particularly strong in the international markets such as Asia and Europe
(excluding UK and Ireland). Additionally, the company has also embarked on an ambitious
cost reduction program whereby by 2019/2020, the company aims to save costs to the extent

of £ 1.5 billion - £ 2 billion (Stones, 2015). A particular focus area for the company has been
to work with suppliers so as to ensure that the prices remained low in the wake of inflationary
pressure especially in the second half of the year. Also, administrative costs along with
finance costs have witnessed a decline leading to higher profit margins (Tesco, 2017). The
higher profit margins in turn have led to an increase in ROA and ROE. The huge jump in
ROE in 2017 is on account of decrease in equity by about £2 billion on account of reduction
in reserves and retained earnings primarily due to discontinued operations.
From the above ratios, it is apparent that Tesco has better profitability ratios as compared to
Morrison. One of the attributing reasons could be scale considering that Tesco’s market share
is about 2.5 times that of Morrison. As a result, economies of scale can be better reaped by
Tesco. Also, Tesco has international presence which is responsible for the higher sales
growth considering the cut throat competition that the retail industry is witnessing in the
home market. However, the profitability ratios such as ROA and ROE are superior for
Morrisons in comparison to Tesco for the period under consideration. A common trend
visible for both national retailers is that there is an improvement in profitability ratios which
is driven by dedicated cost cutting or cost saving measures in the backdrop of competitive
market. This augers well for the company’s financial health and also their shareholders (Petty
et. al., 2015).
Liquidity Ratios
The relevant liquidity ratios for the two firms are as summarised below (Morrisons; Tesco,
2017)
With regards to Morrison Plc, it is apparent that there is a decrease in both the current ratio as
well as acid test ratio. This is mainly because there has been a decline in the current assets
while the current liabilities have increased. The decrease in current assets is on account of
lower cash & cash equivalent to the tune of £326 million as on January 29, 2017 as compared
to £496 million as on January 29, 2016. The increase in current liabilities is on account of
⊘ This is a preview!⊘
Do you want full access?
Subscribe today to unlock all pages.

Trusted by 1+ million students worldwide

higher creditors to the tune of £2,837 million as on January 29, 2017 as compared to £2,518
million as on January 29, 2016 (Morrisons, 2017).
With regards to Tesco Plc, there has been a marginal decline in both the current ratio along
with acid test ratio. For the company, as on February 25, 2017, the current assets and current
liabilities recorded in the balance sheet is higher than the corresponding levels reported as on
February 27, 2016. However, the % increase in current liabilities is higher than the %
increase in current assets which is responsible for deteriorating liquidity ratios for Tesco.
Two items having sizable contribution to current liabilities increase are trade payables along
with customer deposits (Tesco, 2017).
It is apparent that there is deterioration of the short term liquidity for both companies but
considering the dismally low value of acid test ratio, the situation looks worse for Morrison in
comparison with Tesco. It is possible that Morrison may face short term cash crunch if the
working capital management is not improved going forward (Ehrhardt and Brigham, 2016).
Efficiency Ratios
The relevant efficiency ratios for the two firms are as summarised below (Morrisons; Tesco,
2017).
With regards to Morrison, it is apparent that the debtors collection period has gone up
marginally which imply that the cash cycle would be adversely impacted. This means that the
days taken to collect receivables have increased marginally. A positive aspect for the
company is that the creditors payment period in 2017 has increased by about 6 days which
augers well for the company as it reduces the cash cycle. The inventory turnover has not
changed materially in 2017 as compared to the previous year (Morrisons, 2017). Also, the
asset turnover ratio has shown marginal improvement which implies that the company is
utilising the assets in a more efficient manner owing to higher revenues being generated per
dollar of asset (Brealey and Myers, 2012).
Paraphrase This Document
Need a fresh take? Get an instant paraphrase of this document with our AI Paraphraser

With regards to Tesco, it is apparent that debtors collection period has deteriorated
marginally only which is not significant. A positive aspect for the company is the reduction in
inventory days which implies that the inventory is getting converted into sales in lesser days.
Further, the creditor payment days for Tesco has also increased marginally in 2017 which
implies the company has greater credit period. The asset turnover for the company has shown
marginal deterioration which implies that the ability of the company to generate higher
revenues from the given assets has remained stagnant (Tesco, 2017).
Cash cycle = Debtors collection period + Inventory Days - Creditors payment period
Based on the efficiency ratios computed above, it is apparent that for both companies, there
has been a decrease in the cash cycle which limits working capital requirement. Also, the
cash cycle for Tesco is considerably much longer when compared to Morrison primarily
because of credit period being very short which tends to increase the working capital
requirements (Petty et. al., 2015).
Capital Structure
The relevant capital structure ratios for the two firms are as summarised below (Morrisons;
Tesco, 2017).
With regards to Morrison, it is apparent that there has been a reduction in debt ratio in 2017
which is in line with the strategic intent of the company to lower down the overall debt levels
and hence strengthen the balance sheet. Besides, the non-current liabilities as a % of the total
liabilities have also come down to 44.74% as on January 29, 2017 compared to 50.37% as on
January 29, 3016. Additionally, the interest cover has also shown significant improvement in
2017 as the interest expense has decreased in 2017 while the operating profit has improved. It
is apparent that the company has lowered the overall debt levels along with altering the
maturity of outstanding liabilities to short term while improving the comfort for lenders in
terms of interest coverage (Morrisons, 2017).

With regards to Tesco, the debt ratio has worsened owing to increasing levels of both the
current and non-current liabilities. Also, the shareholders’ equity has taken a dip from £8,626
million as on February 29, 2016 to £6,438 as on February 27, 2017. The dip in equity is on
account of the losses owing to exceptional items which erased the retained earnings. A
positive aspect for the company is that the increase in non-current obligations in on account
of post-employment benefit obligations and not caused due to increase in borrowings. The
increasing share of non-current obligations can also be explained by the increased employee
benefit obligations to the tune of approximately £3 billion. Owing to lower debt (both current
and non-current), the interest expense has reduced in 2017 by £28 million. Thus coupled with
higher operating profit has led to improvement in interest cover (Tesco, 2017).
From the above analysis, it is apparent that both companies in 2017 have reduced their debt
levels. Besides, the interest coverage ratio has also improved for both companies. On a
comparative basis, the capital structure ratios of Morrison indicate greater deleveraging of the
balance sheet as compared to Tesco (Petty et. al., 2015).
⊘ This is a preview!⊘
Do you want full access?
Subscribe today to unlock all pages.

Trusted by 1+ million students worldwide

References
Axtell, W. (2016) Morrisons details strategy for growth, [online] Available at
https://bakeryinfo.co.uk/news/fullstory.php/aid/15677/Morrisons_details_strategy_for_growt
h.html [Retrieved March 18, 2018]
Brealey, R., and Myers, S., (2011) Principles of Corporate Finance. 9th ed. New York:
McGraw –Hill.
Ehrhardt, M. C. and Brigham, E. F. (2016) Corporate Finance: A Focused Approach. 6th ed.
London: South- Western College Publisher.
Morrisons (2017) Annual Report 2016-2017, [online] Available at https://www.morrisons-
corporate.com/annual-report-2017/static/downloads/Morrisons_AR_2016_Web_Full.pdf
[Retrieved March 18, 2018]
Petty, J.W., Titman, S., Keown, A., Martin, J.D., Martin, P., Burrow, M., and Nguyen, H. (2012)
Financial Management, Principles and Applications. 6th ed. NSW: Pearson Education, French
Forest Australia.
Simms, A. (2007) Tescopoly: How one shop came out on top and why it matters. London:
Constable
Stones, M. (2015) Tesco reveals sales fall and big cost-cutting plan, [online] Available at
https://www.foodmanufacture.co.uk/Article/2015/01/09/Tesco-unveils-sales-down-and-cost-
cutting-plan [Retrieved March 18, 2018]
Tesco (2017) Annual Report 2016-2017, [online] Available at
https://www.tescoplc.com/media/392373/68336_tesco_ar_digital_interactive_250417.pdf
[Retrieved March 18, 2018]
Paraphrase This Document
Need a fresh take? Get an instant paraphrase of this document with our AI Paraphraser

Appendix
The data used for computation of ratios is summarised below.

The ratio computation is indicated below.
⊘ This is a preview!⊘
Do you want full access?
Subscribe today to unlock all pages.

Trusted by 1+ million students worldwide
1 out of 9
Related Documents

Your All-in-One AI-Powered Toolkit for Academic Success.
+13062052269
info@desklib.com
Available 24*7 on WhatsApp / Email
Unlock your academic potential
Copyright © 2020–2025 A2Z Services. All Rights Reserved. Developed and managed by ZUCOL.