Bangor University ASB 4007: Financial Analysis of Mothercare Limited

Verified

Added on  2022/08/12

|14
|2398
|15
Report
AI Summary
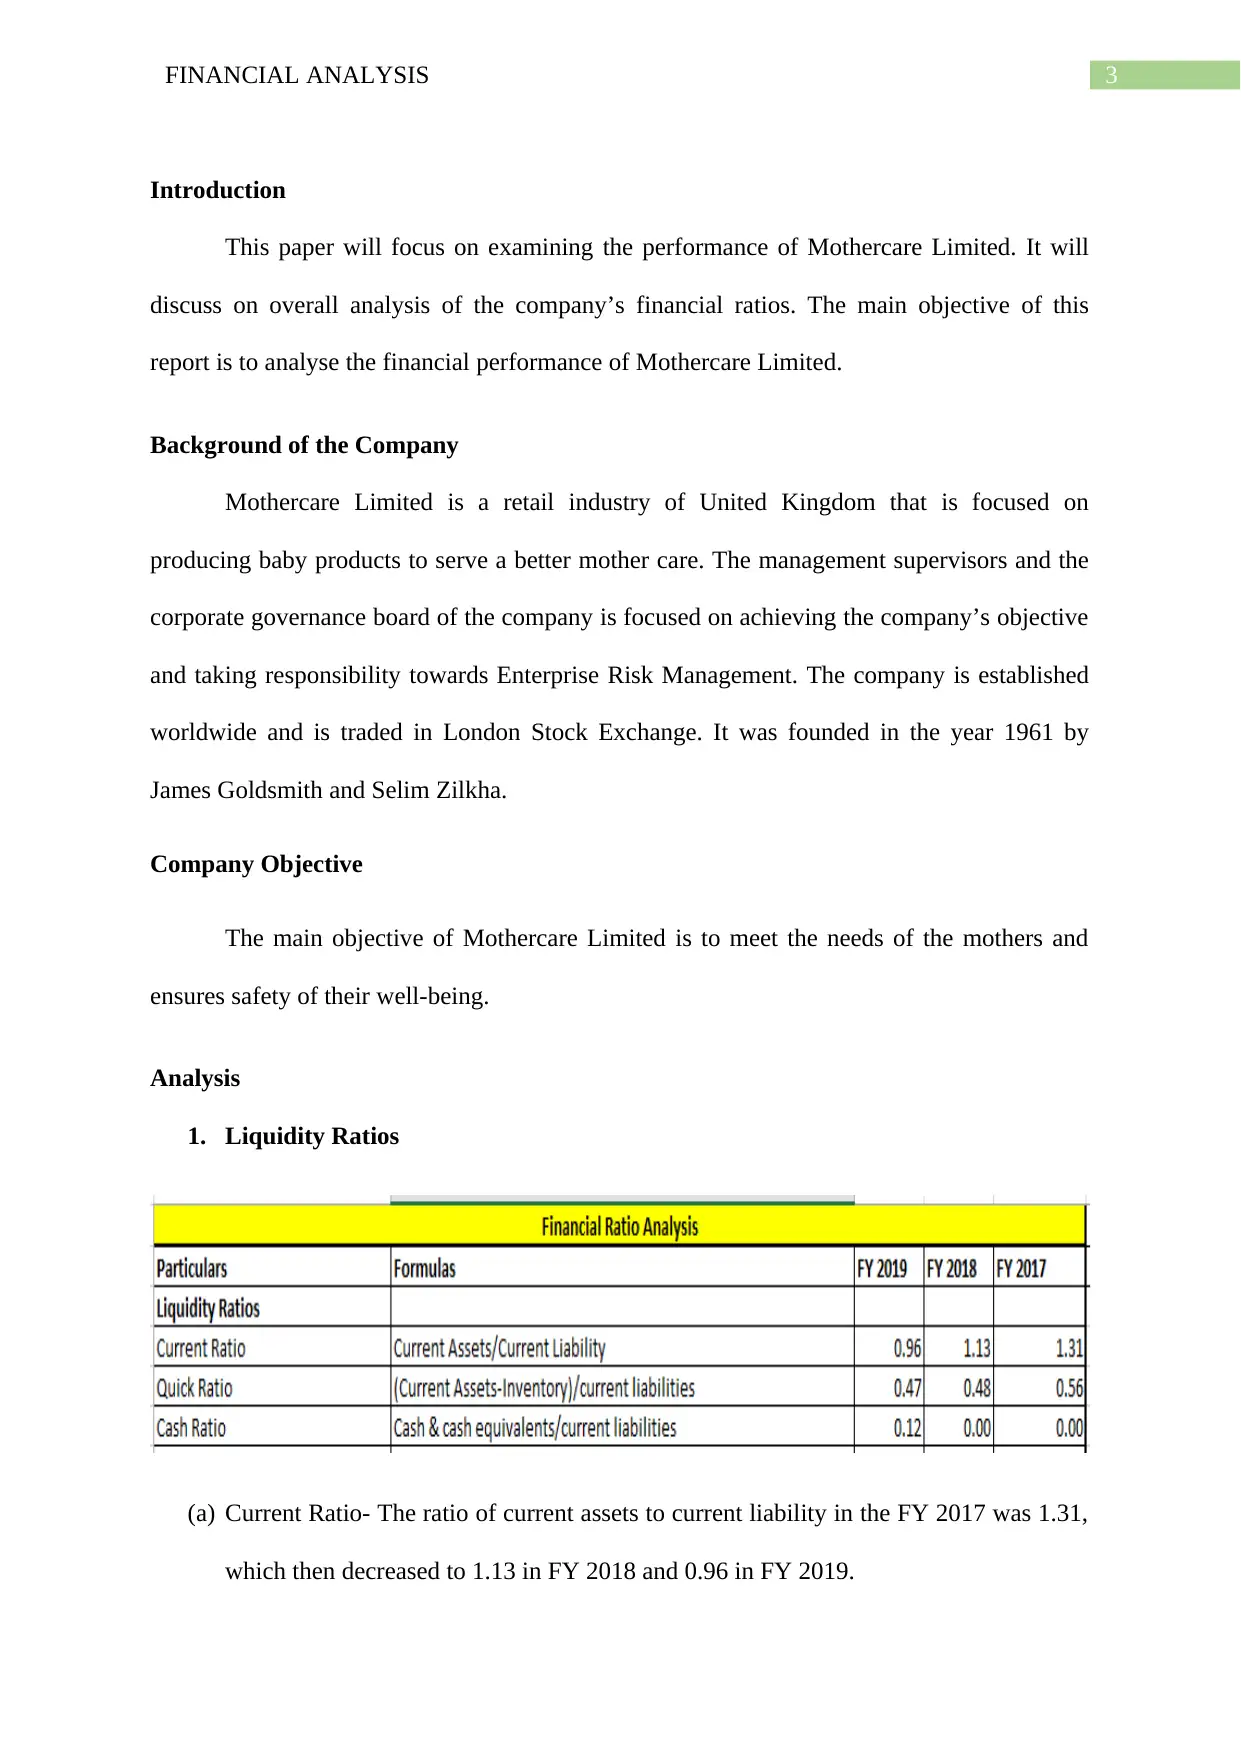
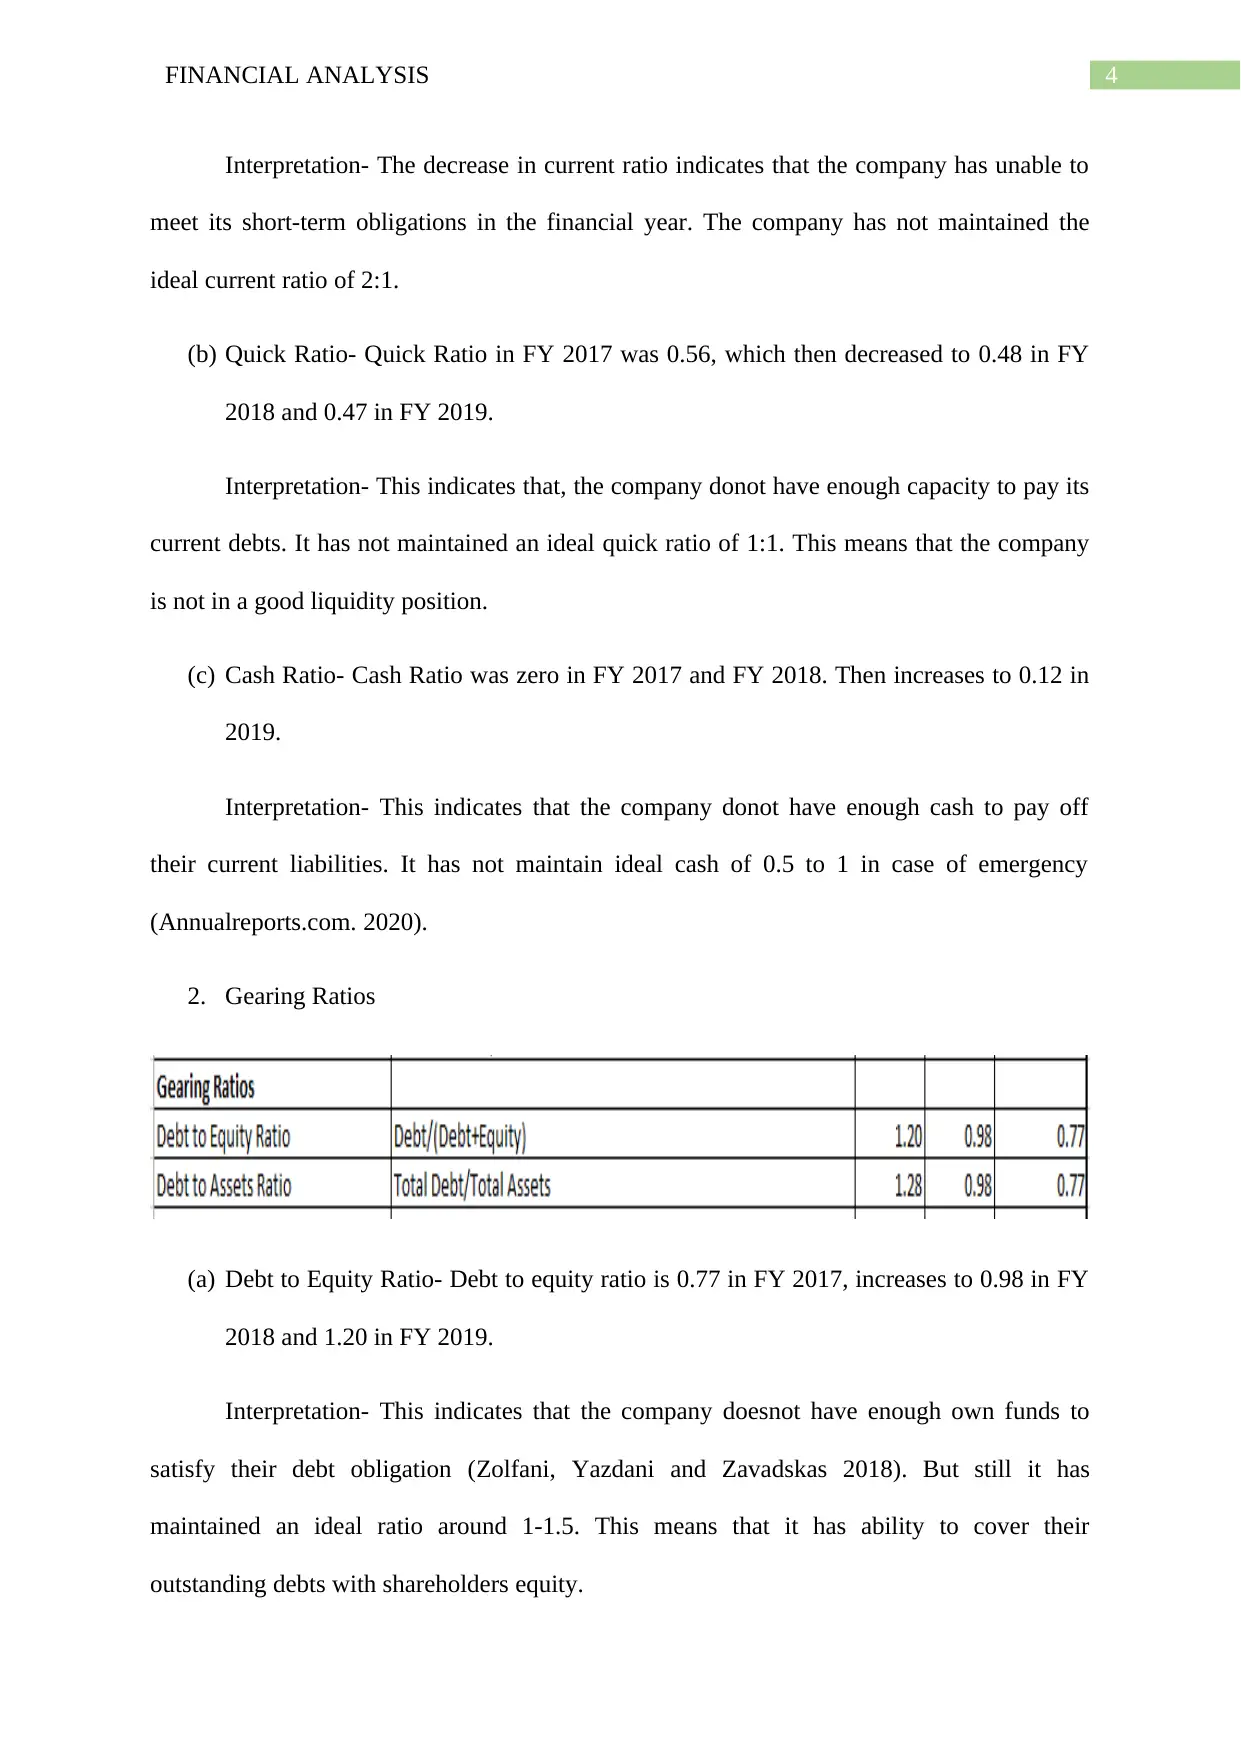
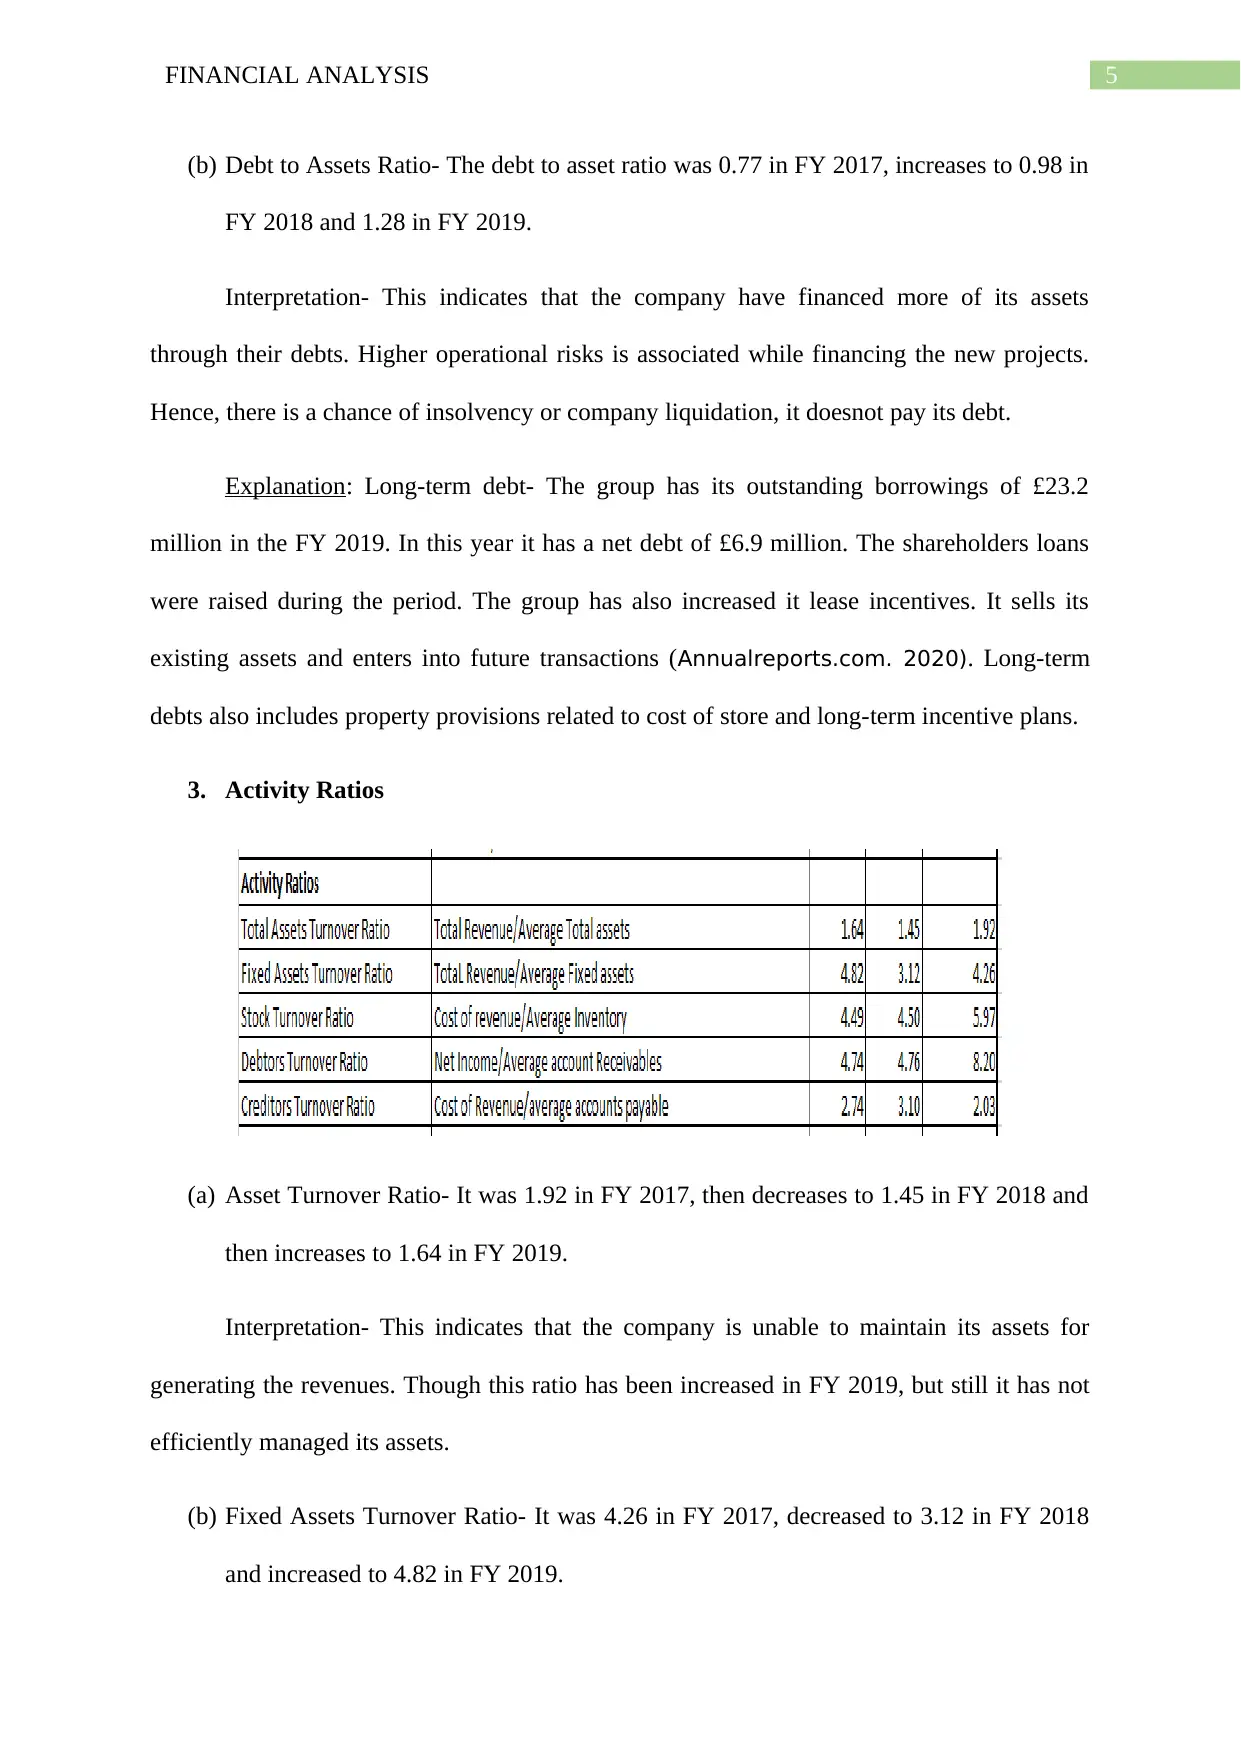
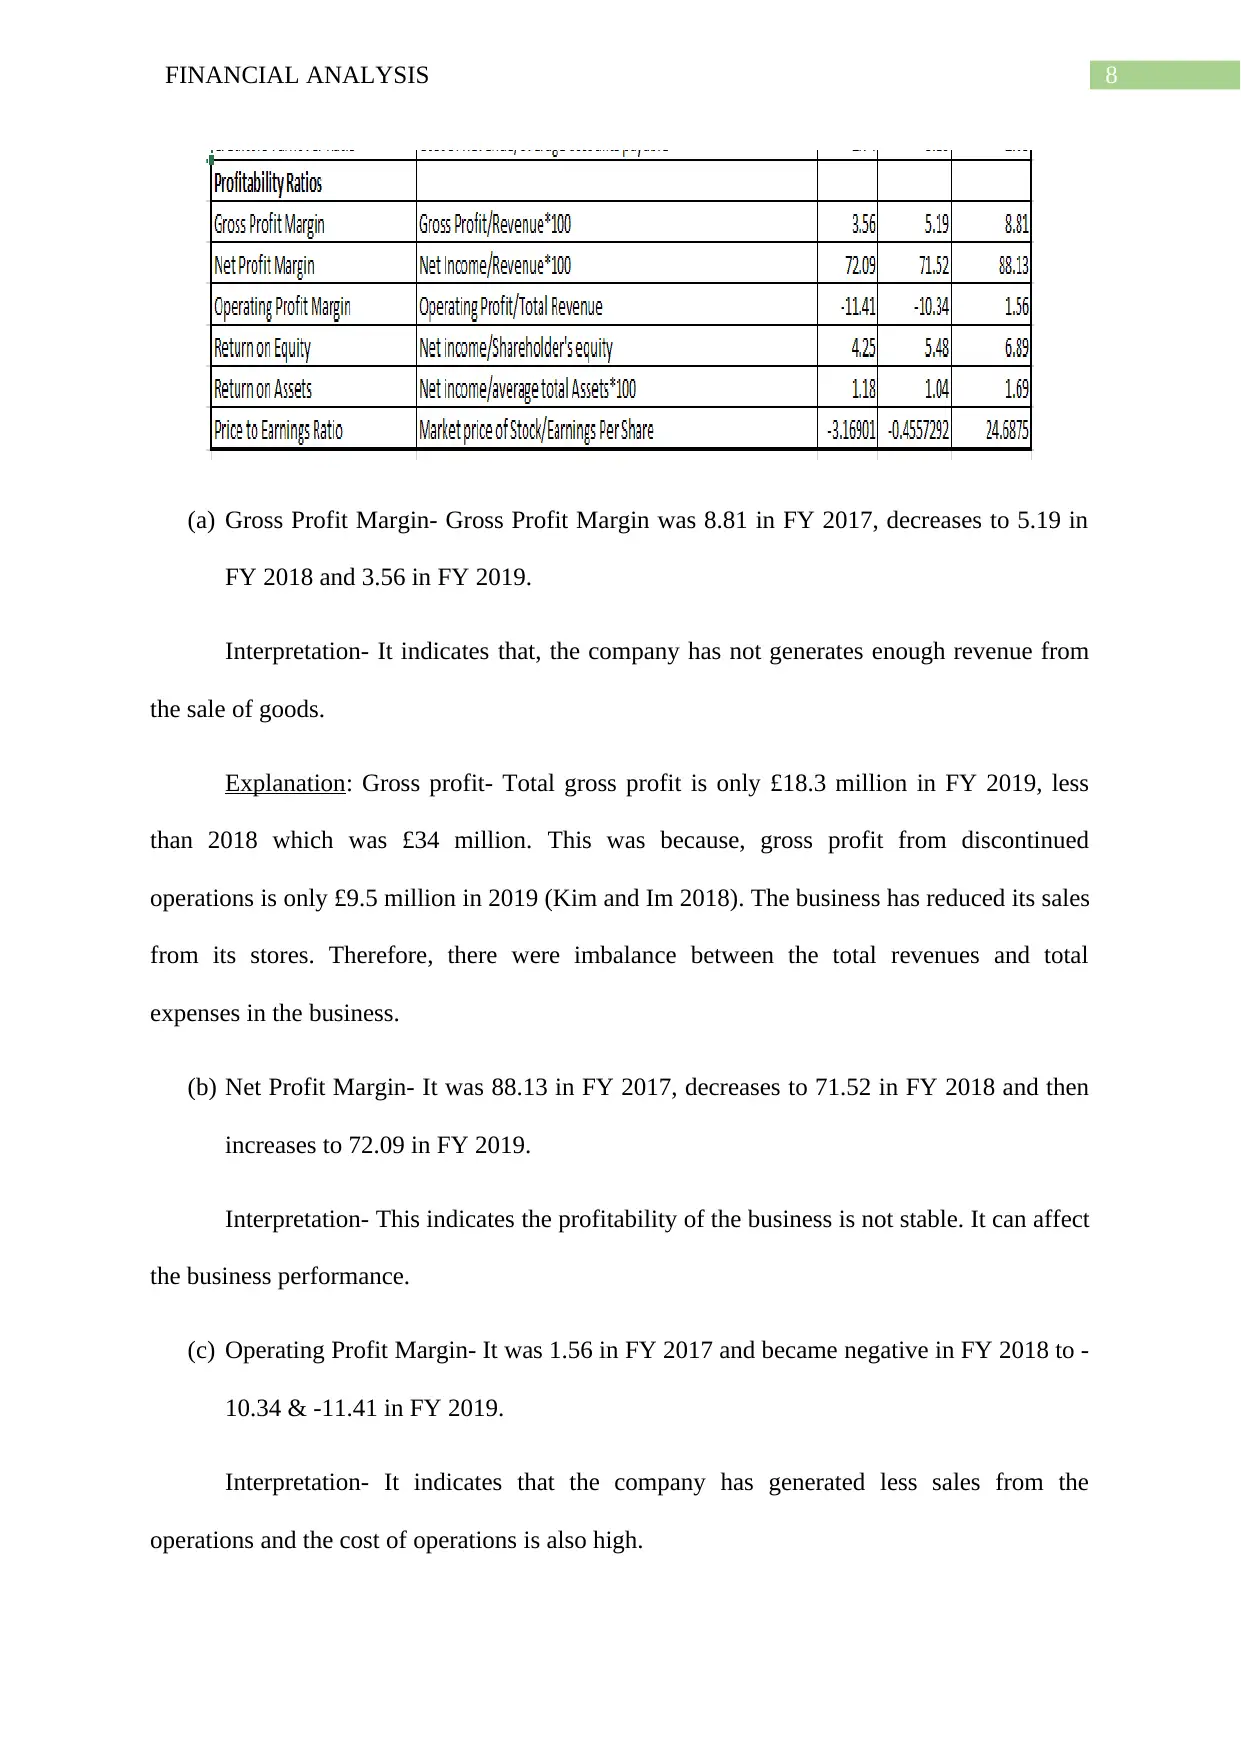
This report presents a financial analysis of Mothercare Limited, examining its performance through various financial ratios. The analysis covers liquidity ratios (current, quick, and cash ratios), gearing ratios (debt to equity and debt to assets), activity ratios (asset turnover, fixed assets turnover, stock turnover, debtor’s turnover, and creditor’s turnover), and profitability ratios (gross profit margin, net profit margin, operating profit margin, return on equity, return on assets, and price to earnings ratio). The report interprets the trends in these ratios over a three-year period (FY 2017-2019), providing insights into the company's financial position, including its ability to meet short-term obligations, manage debt, efficiently utilize assets, and generate profits. The conclusion highlights the increase in share price over the last ten years but notes the company's losses compared to the previous year, emphasizing the need for improved operational management.
Document Page
Running Head: FINANCIAL ANALYSIS
FINANCIAL ANALYSIS
Name of the Student
Name of the University
Author Note
tabler-icon-diamond-filled.svg

Paraphrase This Document

Need a fresh take? Get an instant paraphrase of this document with our AI Paraphraser
Document Page
1FINANCIAL ANALYSIS
Executive Summary
The main objective of this report is to analyse the financial performance of
Mothercare Limited. The study is supported by analysing the annual report of the company. It
is found that share price of company has been increased from the last ten years. But, the
company is in loss as compared to previous year. It should focus on properly managing its
operations.
Document Page
2FINANCIAL ANALYSIS
Table of Contents
Introduction................................................................................................................................3
Background of the Company.....................................................................................................3
Analysis......................................................................................................................................3
Conclusion................................................................................................................................10
References................................................................................................................................11
Document Page
3FINANCIAL ANALYSIS
Introduction
This paper will focus on examining the performance of Mothercare Limited. It will
discuss on overall analysis of the company’s financial ratios. The main objective of this
report is to analyse the financial performance of Mothercare Limited.
Background of the Company
Mothercare Limited is a retail industry of United Kingdom that is focused on
producing baby products to serve a better mother care. The management supervisors and the
corporate governance board of the company is focused on achieving the company’s objective
and taking responsibility towards Enterprise Risk Management. The company is established
worldwide and is traded in London Stock Exchange. It was founded in the year 1961 by
James Goldsmith and Selim Zilkha.
Company Objective
The main objective of Mothercare Limited is to meet the needs of the mothers and
ensures safety of their well-being.
Analysis
1. Liquidity Ratios
(a) Current Ratio- The ratio of current assets to current liability in the FY 2017 was 1.31,
which then decreased to 1.13 in FY 2018 and 0.96 in FY 2019.
tabler-icon-diamond-filled.svg

Paraphrase This Document

Need a fresh take? Get an instant paraphrase of this document with our AI Paraphraser
Document Page
4FINANCIAL ANALYSIS
Interpretation- The decrease in current ratio indicates that the company has unable to
meet its short-term obligations in the financial year. The company has not maintained the
ideal current ratio of 2:1.
(b) Quick Ratio- Quick Ratio in FY 2017 was 0.56, which then decreased to 0.48 in FY
2018 and 0.47 in FY 2019.
Interpretation- This indicates that, the company donot have enough capacity to pay its
current debts. It has not maintained an ideal quick ratio of 1:1. This means that the company
is not in a good liquidity position.
(c) Cash Ratio- Cash Ratio was zero in FY 2017 and FY 2018. Then increases to 0.12 in
2019.
Interpretation- This indicates that the company donot have enough cash to pay off
their current liabilities. It has not maintain ideal cash of 0.5 to 1 in case of emergency
(Annualreports.com. 2020).
2. Gearing Ratios
(a) Debt to Equity Ratio- Debt to equity ratio is 0.77 in FY 2017, increases to 0.98 in FY
2018 and 1.20 in FY 2019.
Interpretation- This indicates that the company doesnot have enough own funds to
satisfy their debt obligation (Zolfani, Yazdani and Zavadskas 2018). But still it has
maintained an ideal ratio around 1-1.5. This means that it has ability to cover their
outstanding debts with shareholders equity.
Document Page
5FINANCIAL ANALYSIS
(b) Debt to Assets Ratio- The debt to asset ratio was 0.77 in FY 2017, increases to 0.98 in
FY 2018 and 1.28 in FY 2019.
Interpretation- This indicates that the company have financed more of its assets
through their debts. Higher operational risks is associated while financing the new projects.
Hence, there is a chance of insolvency or company liquidation, it doesnot pay its debt.
Explanation: Long-term debt- The group has its outstanding borrowings of £23.2
million in the FY 2019. In this year it has a net debt of £6.9 million. The shareholders loans
were raised during the period. The group has also increased it lease incentives. It sells its
existing assets and enters into future transactions (Annualreports.com. 2020). Long-term
debts also includes property provisions related to cost of store and long-term incentive plans.
3. Activity Ratios
(a) Asset Turnover Ratio- It was 1.92 in FY 2017, then decreases to 1.45 in FY 2018 and
then increases to 1.64 in FY 2019.
Interpretation- This indicates that the company is unable to maintain its assets for
generating the revenues. Though this ratio has been increased in FY 2019, but still it has not
efficiently managed its assets.
(b) Fixed Assets Turnover Ratio- It was 4.26 in FY 2017, decreased to 3.12 in FY 2018
and increased to 4.82 in FY 2019.
Document Page
6FINANCIAL ANALYSIS
Interpretation- This indicates that, the business is efficiently utilised its property, plant
and equipment and building in the FY 2019.
(c) Stock turnover ratio- The ratios was 5.97 in FY 2017, decreased to 4.50 in FY 2018 &
4.49 in FY 2019.
Interpretation- This indicates that company has hold its inventory for a longer period
of time. This can also means that, sales are below the expected levels.
Explanation:
Stock/Inventory- The inventories includes finished goods & the goods for resale. The
cost is related to direct materials, direct labour costs and overheads to bring the stocks in
present location.
Cost of Sales- This includes the sale of goods to the customers. The customers have
the right to return the goods within 30 days (Zavadskas et al. 2018). With this an adjustment
in the revenue is recognised. The cost of sales has been decreased in the FY 2019.
(d) Debtor’s turnover ratio- It was 8.20 in FY 2017, decreases to 4.76 in FY 2018 and
4.74 in FY 2019.
Interpretation- This indicates that the company is not efficiently collecting its
receivables. The debts from the customers are not payed quickly.
Explanation: Debtors- The amount from accounts receivables are the gross trade
receivables of the company. It includes all the payments, accrued incomes, prepaid facility
expenses and other receivables that are due within one year. Credit risks is inherent with this
receivables (Walmsley et al. 2018). The group checks this credit risks and assess credit
quality with the potential customers to set the credit limits. Provisions for doubtful
tabler-icon-diamond-filled.svg

Paraphrase This Document

Need a fresh take? Get an instant paraphrase of this document with our AI Paraphraser
Document Page
7FINANCIAL ANALYSIS
receivables are published based on historical data with related to financial position. No
interest is charged on receivables.
Net Income- The total net income has been decreased in the FY 2019 as compared to
previous years. The period has a loss of £93.4 million which was only £76.1 in the year 2018.
There were loss from discontinued operations in the period 2019.
(e) Creditor’s turnover ratio- It was 2.03 in FY 2017, increases to 3.10 in FY 2018 and
then decreases to 2.74 in FY 2019.
Interpretation- This indicates that, the company is slowly paying the amount to its
suppliers. Company’s financial position may be affected (Bschorer, Kuschke and Strunz
2017).
Explanation: Creditors- This includes the amount outstanding for ongoing costs &
trade purchases. Average credit period for trade purchases is 44 days. Financial risk
management policies is linked with the payables. It also includes payroll & taxes from social
security, accruals, deferred income, lease incentives and VAT payables.
Operating Profit/Loss: The total revenue has been generated from the whole sale
operations of the group that has been regularly reported in the company performance report.
The customers have the right to return the goods within 30 days.
4. Profitability Ratios
Document Page
8FINANCIAL ANALYSIS
(a) Gross Profit Margin- Gross Profit Margin was 8.81 in FY 2017, decreases to 5.19 in
FY 2018 and 3.56 in FY 2019.
Interpretation- It indicates that, the company has not generates enough revenue from
the sale of goods.
Explanation: Gross profit- Total gross profit is only £18.3 million in FY 2019, less
than 2018 which was £34 million. This was because, gross profit from discontinued
operations is only £9.5 million in 2019 (Kim and Im 2018). The business has reduced its sales
from its stores. Therefore, there were imbalance between the total revenues and total
expenses in the business.
(b) Net Profit Margin- It was 88.13 in FY 2017, decreases to 71.52 in FY 2018 and then
increases to 72.09 in FY 2019.
Interpretation- This indicates the profitability of the business is not stable. It can affect
the business performance.
(c) Operating Profit Margin- It was 1.56 in FY 2017 and became negative in FY 2018 to -
10.34 & -11.41 in FY 2019.
Interpretation- It indicates that the company has generated less sales from the
operations and the cost of operations is also high.
Document Page
9FINANCIAL ANALYSIS
Explanation: Operating Profit- There is a decline in operating profit in FY 2018/19
and became negative. It was £10.4 in FY 2017. The profit was generated from UK business
operations. The revenue was generated from sale of international operations. This includes
both online and retail sales.
(d) Return on equity- It was 6.89 in FY 2017, decreases to 5.48 in FY 2018 and 4.25 in
FY 2019.
Interpretation- This indicates that, there are no shares in the company treasury and has
borrowed more debts to buy its own stock.
Explanation: Shareholders fund- Total share capital in FY 2019 is more as compared
to previous year. The shares were issues at 50 pence each at every year. 1 pence is the
ordinary share and 49 pence is deferred shares was subdivided in FY 2018 by the company.
Deferred shares donot have any voting rights.
Market value- The shareholdings have a market value of £0.2 million in FY 2019.
(e) Return on assets- It was 1.69 in FY 2017, decreases to 1.04 in FY 2018 & 1.18 in FY
2019.
Interpretation- This indicates that the company is not generating enough income from
the sale of assets. This means that profitability of the company decreases.
(f) Price to earnings ratio- It was 24.69 in FY 2017 and becomes negative to -0.46 in FY
2018 & -3.17 in FY 2019.
Interpretation- This indicates that, the company has negative earnings. The earnings
per share became negative in the two consecutive years.
tabler-icon-diamond-filled.svg

Paraphrase This Document

Need a fresh take? Get an instant paraphrase of this document with our AI Paraphraser
Document Page
10FINANCIAL ANALYSIS
Explanation: Market price- The market price of stock was more in year 2019. It was
22.5 in the respective year. This is the price of the company stock on 31st march of the
financial year. It was 17.5 in FY 2018 and 118.5 in FY 2017.
Shares outstanding- The shares outstanding was generated under Save You Earn
Schemes of the company. It has a weighted average contractual life of 27 years and range at a
price of 13p to 169p on March 2019.
Market capitalisation- The current value of the company is traded at a market
capitalisation of £76.7 million.
Figure 1: (Share price and Market Capitalisation of the company)
The above graph shows the share performance from all the general retailers’ index
from the last 10 years (Annualreports.com. 2020).
Document Page
11FINANCIAL ANALYSIS
Conclusion
Therefore, it can be concluded that, the share price of company has been increased
from the last ten years. But, the company is in loss as compared to previous year. It should
focus on properly managing its operations.
chevron_up_icon
1 out of 14
circle_padding
hide_on_mobile
zoom_out_icon
[object Object]