Financial Management Project: Myer Company Case Study and Analysis
VerifiedAdded on 2021/06/15
|19
|6702
|30
Project
AI Summary
This project report presents a financial analysis of Myer, a major Australian department store, examining its performance over a five-year period. The report begins with an introduction, case study overview, and company overview of Myer. It then delves into a detailed financial analysis, utilizing ratio analysis to assess profitability, asset efficiency, liquidity, capital structure, and investor ratios. The analysis includes comparisons with Myer's competitor, David Jones (using Woolworths' data due to data unavailability). The report calculates and interprets various financial ratios, such as Return on Capital Employed, Gross Profit Margin, and Operating Profit Margin, providing insights into Myer's financial health and performance trends. Recommendations and a conclusion summarize the findings, supported by references and an appendix containing financial data. The project aims to evaluate Myer's financial position and performance, highlighting strengths and weaknesses, and offering suggestions for improvement.
Running Head: Financial Management
1
Project Report: Financial Management
1
Project Report: Financial Management
Paraphrase This Document
Need a fresh take? Get an instant paraphrase of this document with our AI Paraphraser
Financial Management
2
Contents
Introduction.......................................................................................................................3
Case study.........................................................................................................................3
Company overview...........................................................................................................3
Financial analysis..............................................................................................................4
Ratio analysis....................................................................................................................4
Profitability ratios.........................................................................................................4
Asset efficiency position...............................................................................................6
Liquidity ratios..............................................................................................................8
Capital structure ratios................................................................................................10
Investor’s ratios..........................................................................................................11
Recommendation and Conclusion..................................................................................13
References.......................................................................................................................14
Appendix.........................................................................................................................15
Financial Management
3
Introduction:
In this report, a case study of “Myer” has been studied and the financial analysis study
has been conducted on the company. The report explains about the changes into structure of
the company and the current performance of the company on the basis of the competitors of
the company. The main competitor of the company is David Jones limited, subsidiary
company of Woolworths limited. In the report, financial statement of the company of last 5
years has been evaluated and on the basis of that financial statement, ratio analysis study has
been conducted to measure the financial performance of the comapny. The financial
statement of the company has been compared with the financial statement of David Jones
limited to make better decision about the position of the company.
Case study:
The report has been prepared on the basis of Myer case study. This case study
explains that the Myer is one of the largest full line department stores in Australia. The
company has more than 60 stores in the Australia. The company has faced various mergers
and acquisitions from 1900. Currently, the company is listed in Australian stock exchange.
The case study explains about the several changes into the ownership of the company from
19901. And in this report, the financial statement of the company of last 5 years has been
valuated to identify about the current performance of the company.
Company overview:
Myer is an upmarket departmental chain which is operating its business in Australian
market. It is also operating its business in Australian territories. The main products of the
comapny are women swear. Menswear, miss shop, baby products, children wear, beauty,
cosmetics, furniture flooring, footwear, handbag, accessories, fragrance and cosmetics etc.
currently, there are 64 stores of the company through which comapny is selling numerous
range of products to the customers. The company has an interesting story of its ownership
which has been stated in the case study as well. Current financial performance of the
company has been lower
1 Reuters. (2018). “Myer Limited” [Online]. Available:
https://www.reuters.com/finance/stocks/company-profile/MYR.AX [2018, May].
⊘ This is a preview!⊘
Do you want full access?
Subscribe today to unlock all pages.
Trusted by 1+ million students worldwide
Financial Management
4
Financial analysis:
Financial analysis is a process to evaluate and analyze the financial statement of an
organization. This process evaluates the entire financial figures and the transaction of the
company to identify the changes into the organizational performance the position and the
performance of the organization. Financial statement of an organization could be analyzed on
the basis of various techniques such as ratio analysis, vertical analysis, trend analysis etc. the
financial statement analysis process make it easy for the related parties to make decision
about the position and the performance of the company2.
Financial statement analysis process takes the concern of income statement, balance
sheet and cash flow statement of the company and generates the idea about the performance
of the company. In the report, ratio analysis, a tool of financial analysis, has been conducted
to recognize the financial performance of Myer limited.
Ratio analysis:
Ratio analysis is quantitative analysis over the financial statements of an organization
which contains the information about the financial statement of an organization. Ratio
analysis study is based on the various items of financial statement which are cash flow
statement, income statement and balance sheet. Ratio analysis study is conducted by the
companies to recognize the performance of the company and the investment position of the
company, the study is mainly conducted by the analysts and the investors to recognize the
investment position in the company3.
In the report, ratio analysis study has been conducted on Myer limited and the
competitor David Jones, subsidiary company of Woolworths limited (the financial data of
David Jones in not available so the financial data of Woolworths has been taken.). The ratio
analysis study evaluates about the liquidity, profitability, efficiency, investment and capital
2 Thomas R. Robinson,, Henry Elaine, Pirie Wendy L., and Broihahn Michael
A.. International financial statement analysis. John Wiley & Sons, 2015.
3 Baruch Lev. Financial statement analysis: A new approach. Prentice hall, 2014.
Paraphrase This Document
Need a fresh take? Get an instant paraphrase of this document with our AI Paraphraser
Financial Management
5
structure position of the company. Following is the ratio analysis calculations and the
analysis:
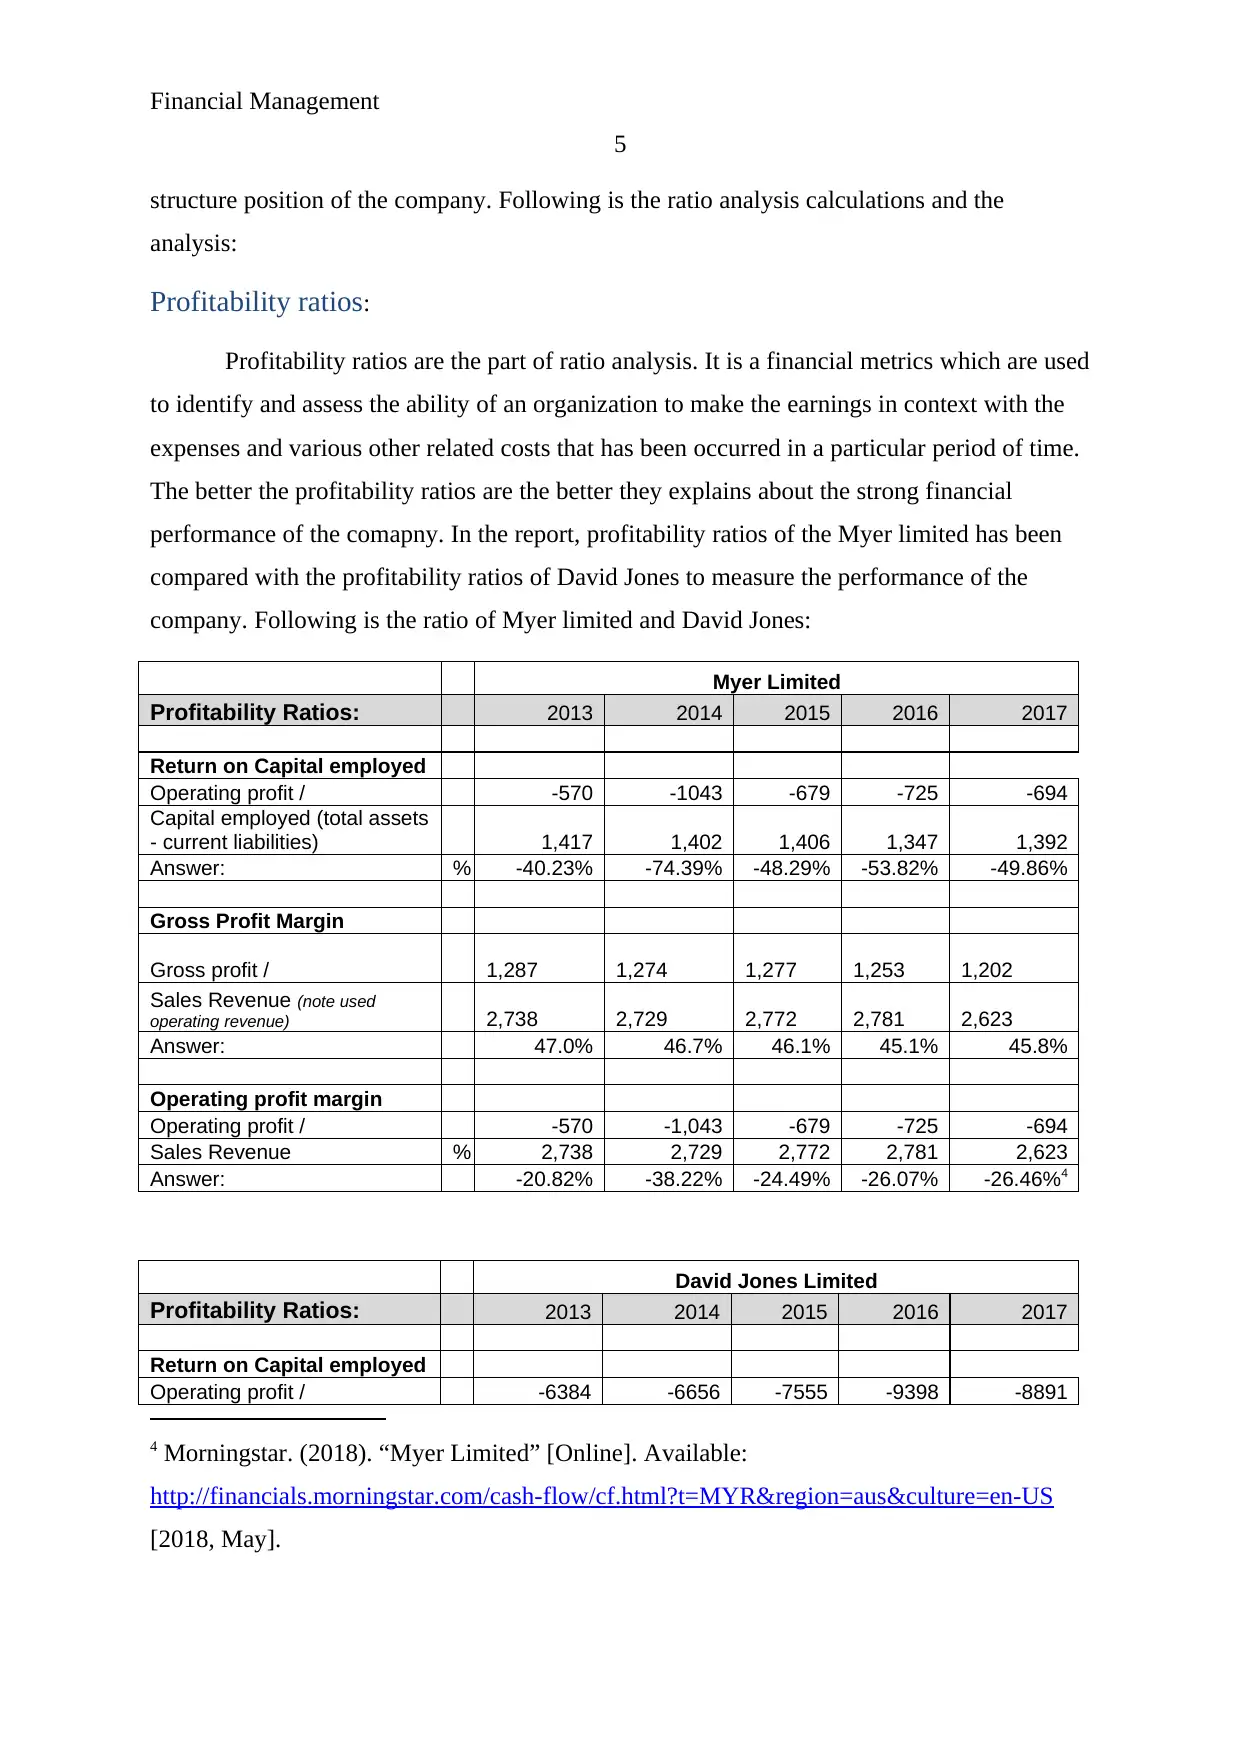
Profitability ratios:
Profitability ratios are the part of ratio analysis. It is a financial metrics which are used
to identify and assess the ability of an organization to make the earnings in context with the
expenses and various other related costs that has been occurred in a particular period of time.
The better the profitability ratios are the better they explains about the strong financial
performance of the comapny. In the report, profitability ratios of the Myer limited has been
compared with the profitability ratios of David Jones to measure the performance of the
company. Following is the ratio of Myer limited and David Jones:
Myer Limited
Profitability Ratios: 2013 2014 2015 2016 2017
Return on Capital employed
Operating profit / -570 -1043 -679 -725 -694
Capital employed (total assets
- current liabilities) 1,417 1,402 1,406 1,347 1,392
Answer: % -40.23% -74.39% -48.29% -53.82% -49.86%
Gross Profit Margin
Gross profit / 1,287 1,274 1,277 1,253 1,202
Sales Revenue (note used
operating revenue) 2,738 2,729 2,772 2,781 2,623
Answer: 47.0% 46.7% 46.1% 45.1% 45.8%
Operating profit margin
Operating profit / -570 -1,043 -679 -725 -694
Sales Revenue % 2,738 2,729 2,772 2,781 2,623
Answer: -20.82% -38.22% -24.49% -26.07% -26.46%4
David Jones Limited
Profitability Ratios: 2013 2014 2015 2016 2017
Return on Capital employed
Operating profit / -6384 -6656 -7555 -9398 -8891
4 Morningstar. (2018). “Myer Limited” [Online]. Available:
http://financials.morningstar.com/cash-flow/cf.html?t=MYR®ion=aus&culture=en-US
[2018, May].
5
structure position of the company. Following is the ratio analysis calculations and the
analysis:
Profitability ratios:
Profitability ratios are the part of ratio analysis. It is a financial metrics which are used
to identify and assess the ability of an organization to make the earnings in context with the
expenses and various other related costs that has been occurred in a particular period of time.
The better the profitability ratios are the better they explains about the strong financial
performance of the comapny. In the report, profitability ratios of the Myer limited has been
compared with the profitability ratios of David Jones to measure the performance of the
company. Following is the ratio of Myer limited and David Jones:
Myer Limited
Profitability Ratios: 2013 2014 2015 2016 2017
Return on Capital employed
Operating profit / -570 -1043 -679 -725 -694
Capital employed (total assets
- current liabilities) 1,417 1,402 1,406 1,347 1,392
Answer: % -40.23% -74.39% -48.29% -53.82% -49.86%
Gross Profit Margin
Gross profit / 1,287 1,274 1,277 1,253 1,202
Sales Revenue (note used
operating revenue) 2,738 2,729 2,772 2,781 2,623
Answer: 47.0% 46.7% 46.1% 45.1% 45.8%
Operating profit margin
Operating profit / -570 -1,043 -679 -725 -694
Sales Revenue % 2,738 2,729 2,772 2,781 2,623
Answer: -20.82% -38.22% -24.49% -26.07% -26.46%4
David Jones Limited
Profitability Ratios: 2013 2014 2015 2016 2017
Return on Capital employed
Operating profit / -6384 -6656 -7555 -9398 -8891
4 Morningstar. (2018). “Myer Limited” [Online]. Available:
http://financials.morningstar.com/cash-flow/cf.html?t=MYR®ion=aus&culture=en-US
[2018, May].
Financial Management
6
Capital employed (total
assets - current liabilities) 15,384 16,647 16,168 14,509 14,092
Answer: % -41.50% -39.98% -46.73% -64.77% -63.09%
Gross Profit Margin
Gross profit / 15,762 16,478 16,524 15,599 15,929
Sales Revenue (note used
operating revenue) 58,674 60,952 60,868 58,276 55,669
Answer: 26.9% 27.0% 27.1% 26.8% 28.6%
Operating profit margin
Operating profit / -6,384 -6,656 -7,555 -9,398 -8,891
Sales Revenue % 58,674 60,952 60,868 58,276 55,669
Answer: -10.88% -10.92% -12.41% -16.13% -15.97%5
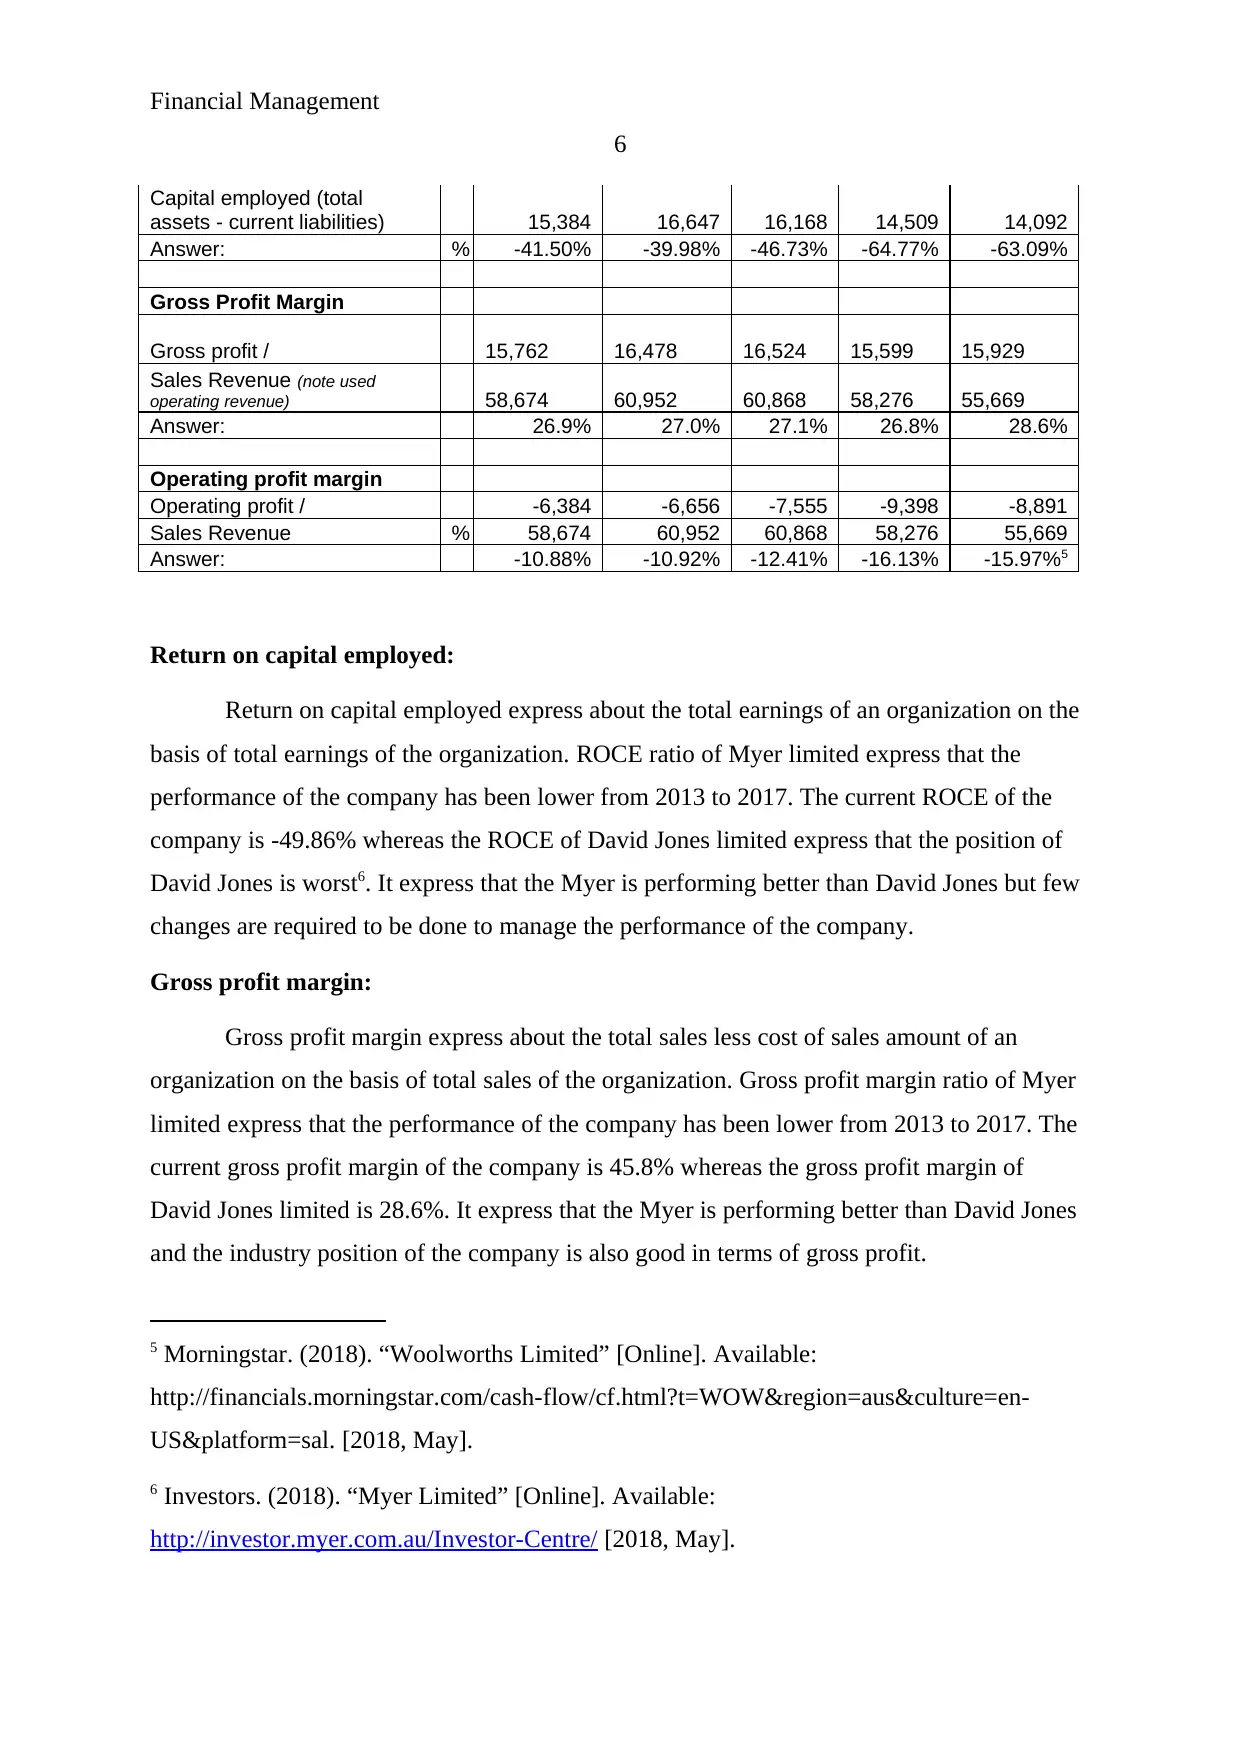
Return on capital employed:
Return on capital employed express about the total earnings of an organization on the
basis of total earnings of the organization. ROCE ratio of Myer limited express that the
performance of the company has been lower from 2013 to 2017. The current ROCE of the
company is -49.86% whereas the ROCE of David Jones limited express that the position of
David Jones is worst6. It express that the Myer is performing better than David Jones but few
changes are required to be done to manage the performance of the company.
Gross profit margin:
Gross profit margin express about the total sales less cost of sales amount of an
organization on the basis of total sales of the organization. Gross profit margin ratio of Myer
limited express that the performance of the company has been lower from 2013 to 2017. The
current gross profit margin of the company is 45.8% whereas the gross profit margin of
David Jones limited is 28.6%. It express that the Myer is performing better than David Jones
and the industry position of the company is also good in terms of gross profit.
5 Morningstar. (2018). “Woolworths Limited” [Online]. Available:
http://financials.morningstar.com/cash-flow/cf.html?t=WOW®ion=aus&culture=en-
US&platform=sal. [2018, May].
6 Investors. (2018). “Myer Limited” [Online]. Available:
http://investor.myer.com.au/Investor-Centre/ [2018, May].
6
Capital employed (total
assets - current liabilities) 15,384 16,647 16,168 14,509 14,092
Answer: % -41.50% -39.98% -46.73% -64.77% -63.09%
Gross Profit Margin
Gross profit / 15,762 16,478 16,524 15,599 15,929
Sales Revenue (note used
operating revenue) 58,674 60,952 60,868 58,276 55,669
Answer: 26.9% 27.0% 27.1% 26.8% 28.6%
Operating profit margin
Operating profit / -6,384 -6,656 -7,555 -9,398 -8,891
Sales Revenue % 58,674 60,952 60,868 58,276 55,669
Answer: -10.88% -10.92% -12.41% -16.13% -15.97%5
Return on capital employed:
Return on capital employed express about the total earnings of an organization on the
basis of total earnings of the organization. ROCE ratio of Myer limited express that the
performance of the company has been lower from 2013 to 2017. The current ROCE of the
company is -49.86% whereas the ROCE of David Jones limited express that the position of
David Jones is worst6. It express that the Myer is performing better than David Jones but few
changes are required to be done to manage the performance of the company.
Gross profit margin:
Gross profit margin express about the total sales less cost of sales amount of an
organization on the basis of total sales of the organization. Gross profit margin ratio of Myer
limited express that the performance of the company has been lower from 2013 to 2017. The
current gross profit margin of the company is 45.8% whereas the gross profit margin of
David Jones limited is 28.6%. It express that the Myer is performing better than David Jones
and the industry position of the company is also good in terms of gross profit.
5 Morningstar. (2018). “Woolworths Limited” [Online]. Available:
http://financials.morningstar.com/cash-flow/cf.html?t=WOW®ion=aus&culture=en-
US&platform=sal. [2018, May].
6 Investors. (2018). “Myer Limited” [Online]. Available:
http://investor.myer.com.au/Investor-Centre/ [2018, May].
⊘ This is a preview!⊘
Do you want full access?
Subscribe today to unlock all pages.
Trusted by 1+ million students worldwide
Financial Management
7
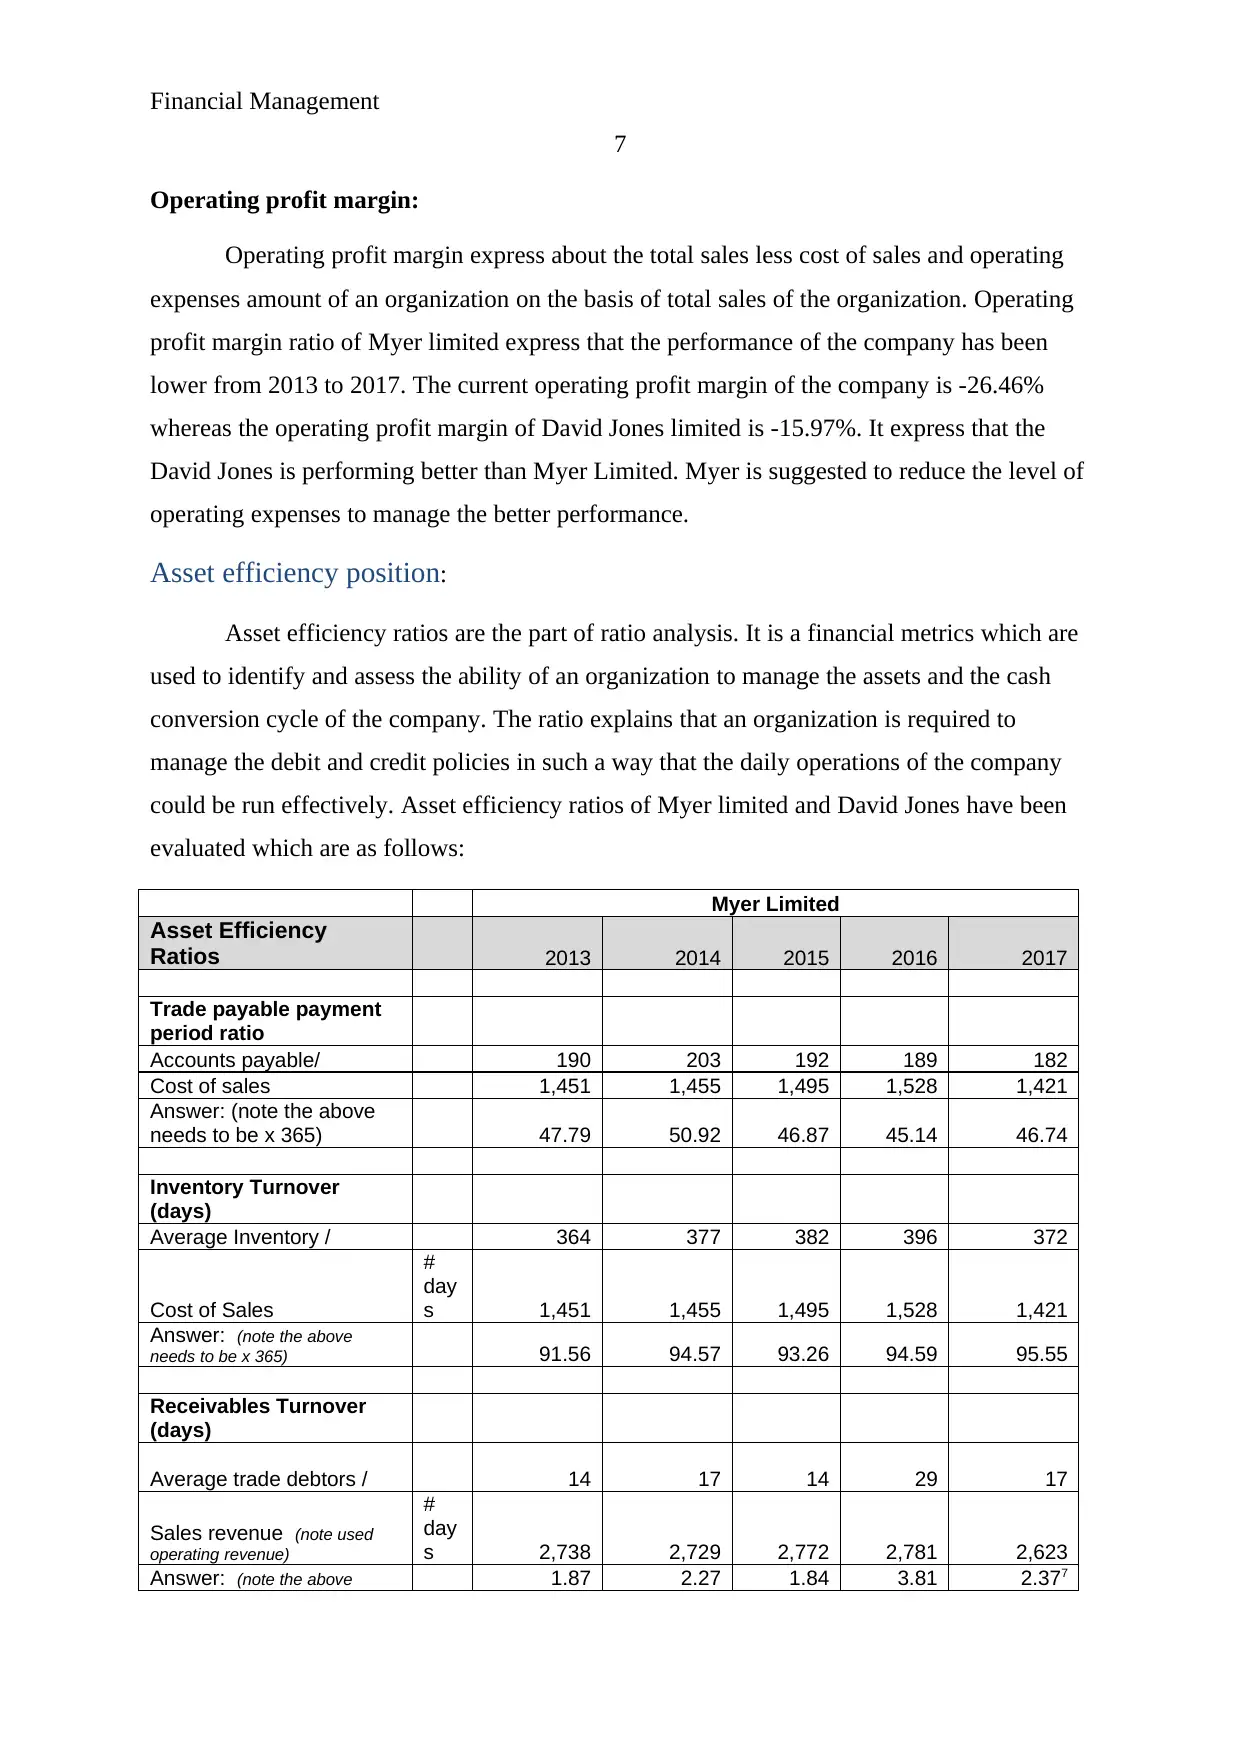
Operating profit margin:
Operating profit margin express about the total sales less cost of sales and operating
expenses amount of an organization on the basis of total sales of the organization. Operating
profit margin ratio of Myer limited express that the performance of the company has been
lower from 2013 to 2017. The current operating profit margin of the company is -26.46%
whereas the operating profit margin of David Jones limited is -15.97%. It express that the
David Jones is performing better than Myer Limited. Myer is suggested to reduce the level of
operating expenses to manage the better performance.
Asset efficiency position:
Asset efficiency ratios are the part of ratio analysis. It is a financial metrics which are
used to identify and assess the ability of an organization to manage the assets and the cash
conversion cycle of the company. The ratio explains that an organization is required to
manage the debit and credit policies in such a way that the daily operations of the company
could be run effectively. Asset efficiency ratios of Myer limited and David Jones have been
evaluated which are as follows:
Myer Limited
Asset Efficiency
Ratios 2013 2014 2015 2016 2017
Trade payable payment
period ratio
Accounts payable/ 190 203 192 189 182
Cost of sales 1,451 1,455 1,495 1,528 1,421
Answer: (note the above
needs to be x 365) 47.79 50.92 46.87 45.14 46.74
Inventory Turnover
(days)
Average Inventory / 364 377 382 396 372
Cost of Sales
#
day
s 1,451 1,455 1,495 1,528 1,421
Answer: (note the above
needs to be x 365) 91.56 94.57 93.26 94.59 95.55
Receivables Turnover
(days)
Average trade debtors / 14 17 14 29 17
Sales revenue (note used
operating revenue)
#
day
s 2,738 2,729 2,772 2,781 2,623
Answer: (note the above 1.87 2.27 1.84 3.81 2.377
7
Operating profit margin:
Operating profit margin express about the total sales less cost of sales and operating
expenses amount of an organization on the basis of total sales of the organization. Operating
profit margin ratio of Myer limited express that the performance of the company has been
lower from 2013 to 2017. The current operating profit margin of the company is -26.46%
whereas the operating profit margin of David Jones limited is -15.97%. It express that the
David Jones is performing better than Myer Limited. Myer is suggested to reduce the level of
operating expenses to manage the better performance.
Asset efficiency position:
Asset efficiency ratios are the part of ratio analysis. It is a financial metrics which are
used to identify and assess the ability of an organization to manage the assets and the cash
conversion cycle of the company. The ratio explains that an organization is required to
manage the debit and credit policies in such a way that the daily operations of the company
could be run effectively. Asset efficiency ratios of Myer limited and David Jones have been
evaluated which are as follows:
Myer Limited
Asset Efficiency
Ratios 2013 2014 2015 2016 2017
Trade payable payment
period ratio
Accounts payable/ 190 203 192 189 182
Cost of sales 1,451 1,455 1,495 1,528 1,421
Answer: (note the above
needs to be x 365) 47.79 50.92 46.87 45.14 46.74
Inventory Turnover
(days)
Average Inventory / 364 377 382 396 372
Cost of Sales
#
day
s 1,451 1,455 1,495 1,528 1,421
Answer: (note the above
needs to be x 365) 91.56 94.57 93.26 94.59 95.55
Receivables Turnover
(days)
Average trade debtors / 14 17 14 29 17
Sales revenue (note used
operating revenue)
#
day
s 2,738 2,729 2,772 2,781 2,623
Answer: (note the above 1.87 2.27 1.84 3.81 2.377
Paraphrase This Document
Need a fresh take? Get an instant paraphrase of this document with our AI Paraphraser
Financial Management
8
needs to be x 365)
David Jones Limited
Asset Efficiency
Ratios 2013 2014 2015 2016 2017
Trade payable payment
period ratio
Accounts payable/ 4,080 4,657 5,040 4,809 5,068
Cost of sales 42,913 44,475 44,345 42,677 39,740
Answer: (note the above
needs to be x 365) 34.70 38.22 41.48 41.13 46.55
Inventory Turnover
(days)
Average Inventory / 4,205 4,693 4,872 4,558 4,080
Cost of Sales
#
day
s 42,913 44,475 44,345 42,677 39,740
Answer: (note the above
needs to be x 365) 35.77 38.51 40.10 38.98 37.47
Receivables Turnover
(days)
Average trade debtors / 698 617 584 434 410
Sales revenue (note used
operating revenue)
#
day
s 58,674 60,952 60,868 58,276 55,669
Answer: (note the above
needs to be x 365) 4.34 3.69 3.50 2.72 2.698
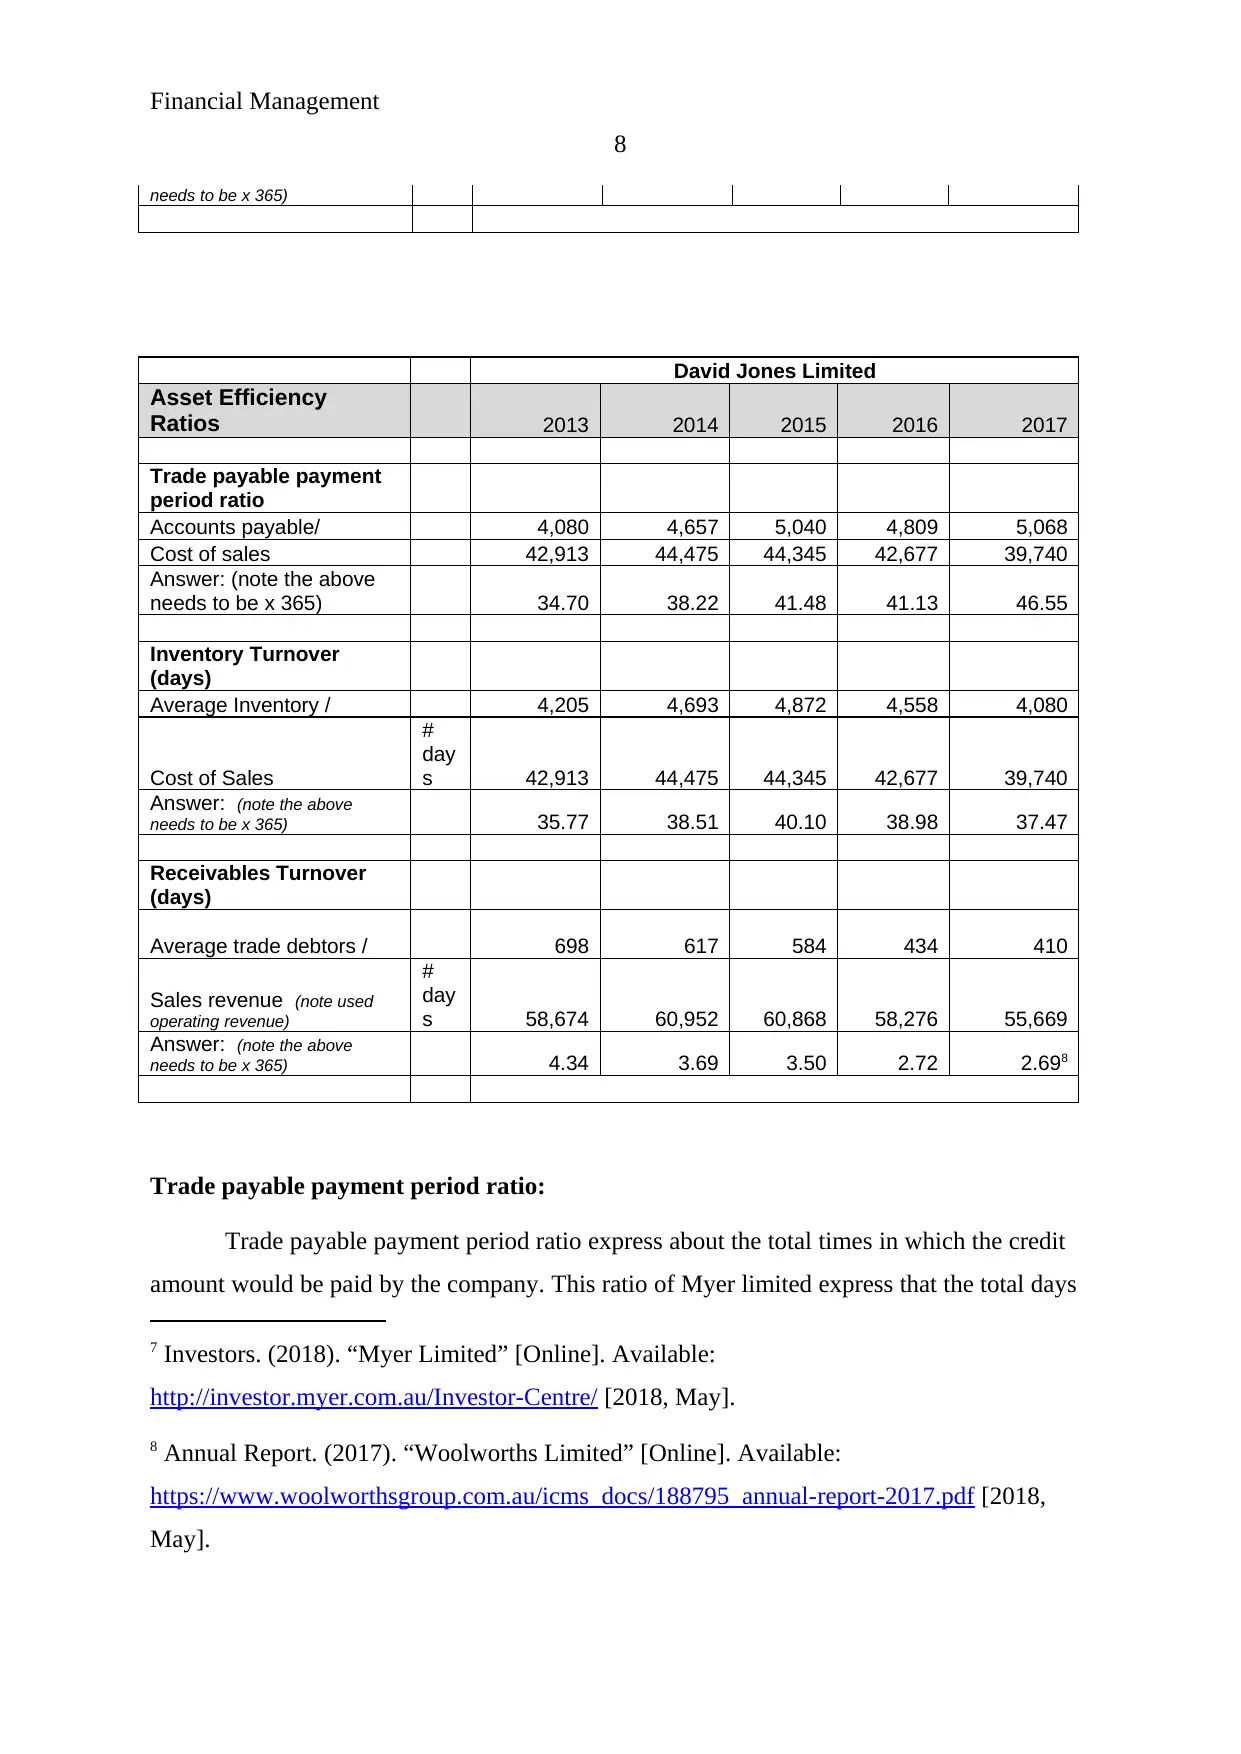
Trade payable payment period ratio:
Trade payable payment period ratio express about the total times in which the credit
amount would be paid by the company. This ratio of Myer limited express that the total days
7 Investors. (2018). “Myer Limited” [Online]. Available:
http://investor.myer.com.au/Investor-Centre/ [2018, May].
8 Annual Report. (2017). “Woolworths Limited” [Online]. Available:
https://www.woolworthsgroup.com.au/icms_docs/188795_annual-report-2017.pdf [2018,
May].
8
needs to be x 365)
David Jones Limited
Asset Efficiency
Ratios 2013 2014 2015 2016 2017
Trade payable payment
period ratio
Accounts payable/ 4,080 4,657 5,040 4,809 5,068
Cost of sales 42,913 44,475 44,345 42,677 39,740
Answer: (note the above
needs to be x 365) 34.70 38.22 41.48 41.13 46.55
Inventory Turnover
(days)
Average Inventory / 4,205 4,693 4,872 4,558 4,080
Cost of Sales
#
day
s 42,913 44,475 44,345 42,677 39,740
Answer: (note the above
needs to be x 365) 35.77 38.51 40.10 38.98 37.47
Receivables Turnover
(days)
Average trade debtors / 698 617 584 434 410
Sales revenue (note used
operating revenue)
#
day
s 58,674 60,952 60,868 58,276 55,669
Answer: (note the above
needs to be x 365) 4.34 3.69 3.50 2.72 2.698
Trade payable payment period ratio:
Trade payable payment period ratio express about the total times in which the credit
amount would be paid by the company. This ratio of Myer limited express that the total days
7 Investors. (2018). “Myer Limited” [Online]. Available:
http://investor.myer.com.au/Investor-Centre/ [2018, May].
8 Annual Report. (2017). “Woolworths Limited” [Online]. Available:
https://www.woolworthsgroup.com.au/icms_docs/188795_annual-report-2017.pdf [2018,
May].
Financial Management
9
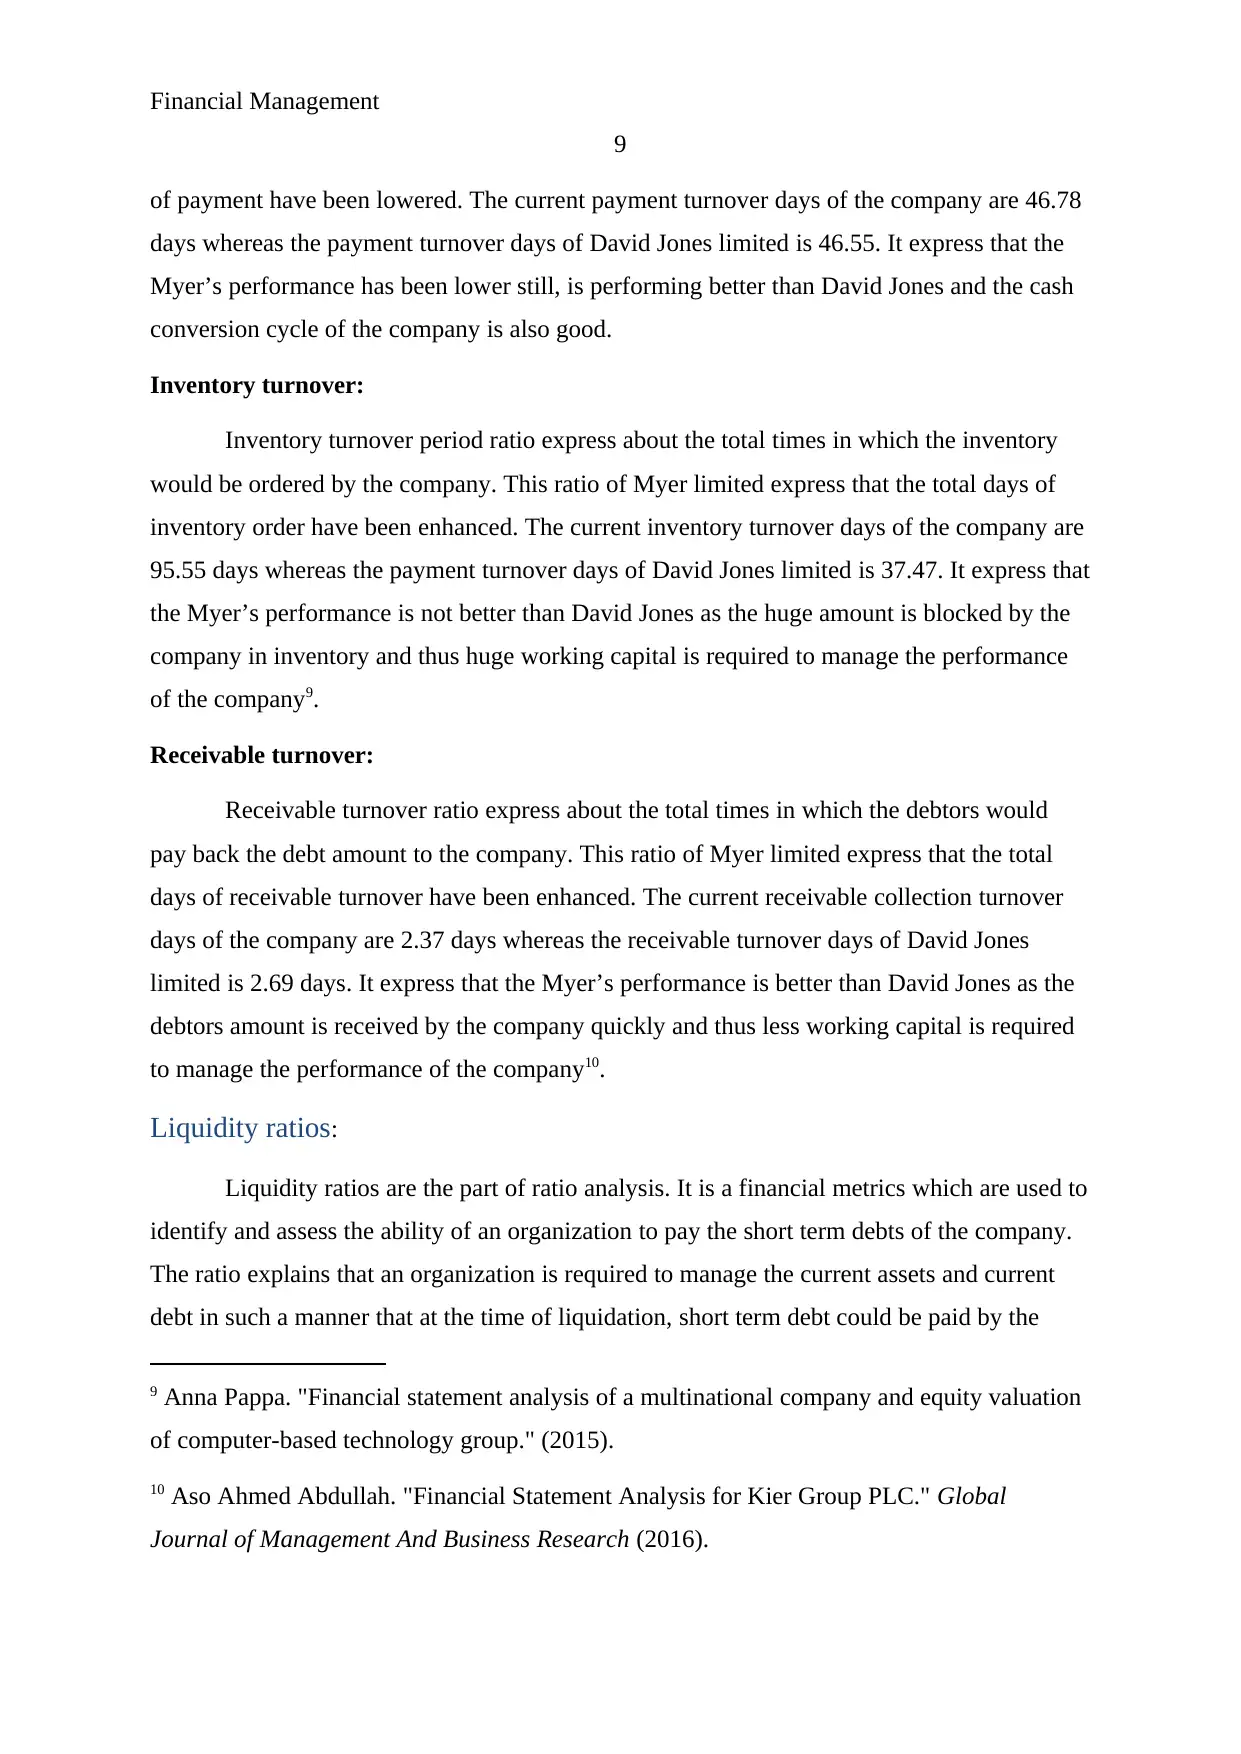
of payment have been lowered. The current payment turnover days of the company are 46.78
days whereas the payment turnover days of David Jones limited is 46.55. It express that the
Myer’s performance has been lower still, is performing better than David Jones and the cash
conversion cycle of the company is also good.
Inventory turnover:
Inventory turnover period ratio express about the total times in which the inventory
would be ordered by the company. This ratio of Myer limited express that the total days of
inventory order have been enhanced. The current inventory turnover days of the company are
95.55 days whereas the payment turnover days of David Jones limited is 37.47. It express that
the Myer’s performance is not better than David Jones as the huge amount is blocked by the
company in inventory and thus huge working capital is required to manage the performance
of the company9.
Receivable turnover:
Receivable turnover ratio express about the total times in which the debtors would
pay back the debt amount to the company. This ratio of Myer limited express that the total
days of receivable turnover have been enhanced. The current receivable collection turnover
days of the company are 2.37 days whereas the receivable turnover days of David Jones
limited is 2.69 days. It express that the Myer’s performance is better than David Jones as the
debtors amount is received by the company quickly and thus less working capital is required
to manage the performance of the company10.
Liquidity ratios:
Liquidity ratios are the part of ratio analysis. It is a financial metrics which are used to
identify and assess the ability of an organization to pay the short term debts of the company.
The ratio explains that an organization is required to manage the current assets and current
debt in such a manner that at the time of liquidation, short term debt could be paid by the
9 Anna Pappa. "Financial statement analysis of a multinational company and equity valuation
of computer-based technology group." (2015).
10 Aso Ahmed Abdullah. "Financial Statement Analysis for Kier Group PLC." Global
Journal of Management And Business Research (2016).
9
of payment have been lowered. The current payment turnover days of the company are 46.78
days whereas the payment turnover days of David Jones limited is 46.55. It express that the
Myer’s performance has been lower still, is performing better than David Jones and the cash
conversion cycle of the company is also good.
Inventory turnover:
Inventory turnover period ratio express about the total times in which the inventory
would be ordered by the company. This ratio of Myer limited express that the total days of
inventory order have been enhanced. The current inventory turnover days of the company are
95.55 days whereas the payment turnover days of David Jones limited is 37.47. It express that
the Myer’s performance is not better than David Jones as the huge amount is blocked by the
company in inventory and thus huge working capital is required to manage the performance
of the company9.
Receivable turnover:
Receivable turnover ratio express about the total times in which the debtors would
pay back the debt amount to the company. This ratio of Myer limited express that the total
days of receivable turnover have been enhanced. The current receivable collection turnover
days of the company are 2.37 days whereas the receivable turnover days of David Jones
limited is 2.69 days. It express that the Myer’s performance is better than David Jones as the
debtors amount is received by the company quickly and thus less working capital is required
to manage the performance of the company10.
Liquidity ratios:
Liquidity ratios are the part of ratio analysis. It is a financial metrics which are used to
identify and assess the ability of an organization to pay the short term debts of the company.
The ratio explains that an organization is required to manage the current assets and current
debt in such a manner that at the time of liquidation, short term debt could be paid by the
9 Anna Pappa. "Financial statement analysis of a multinational company and equity valuation
of computer-based technology group." (2015).
10 Aso Ahmed Abdullah. "Financial Statement Analysis for Kier Group PLC." Global
Journal of Management And Business Research (2016).
⊘ This is a preview!⊘
Do you want full access?
Subscribe today to unlock all pages.
Trusted by 1+ million students worldwide
Financial Management
10
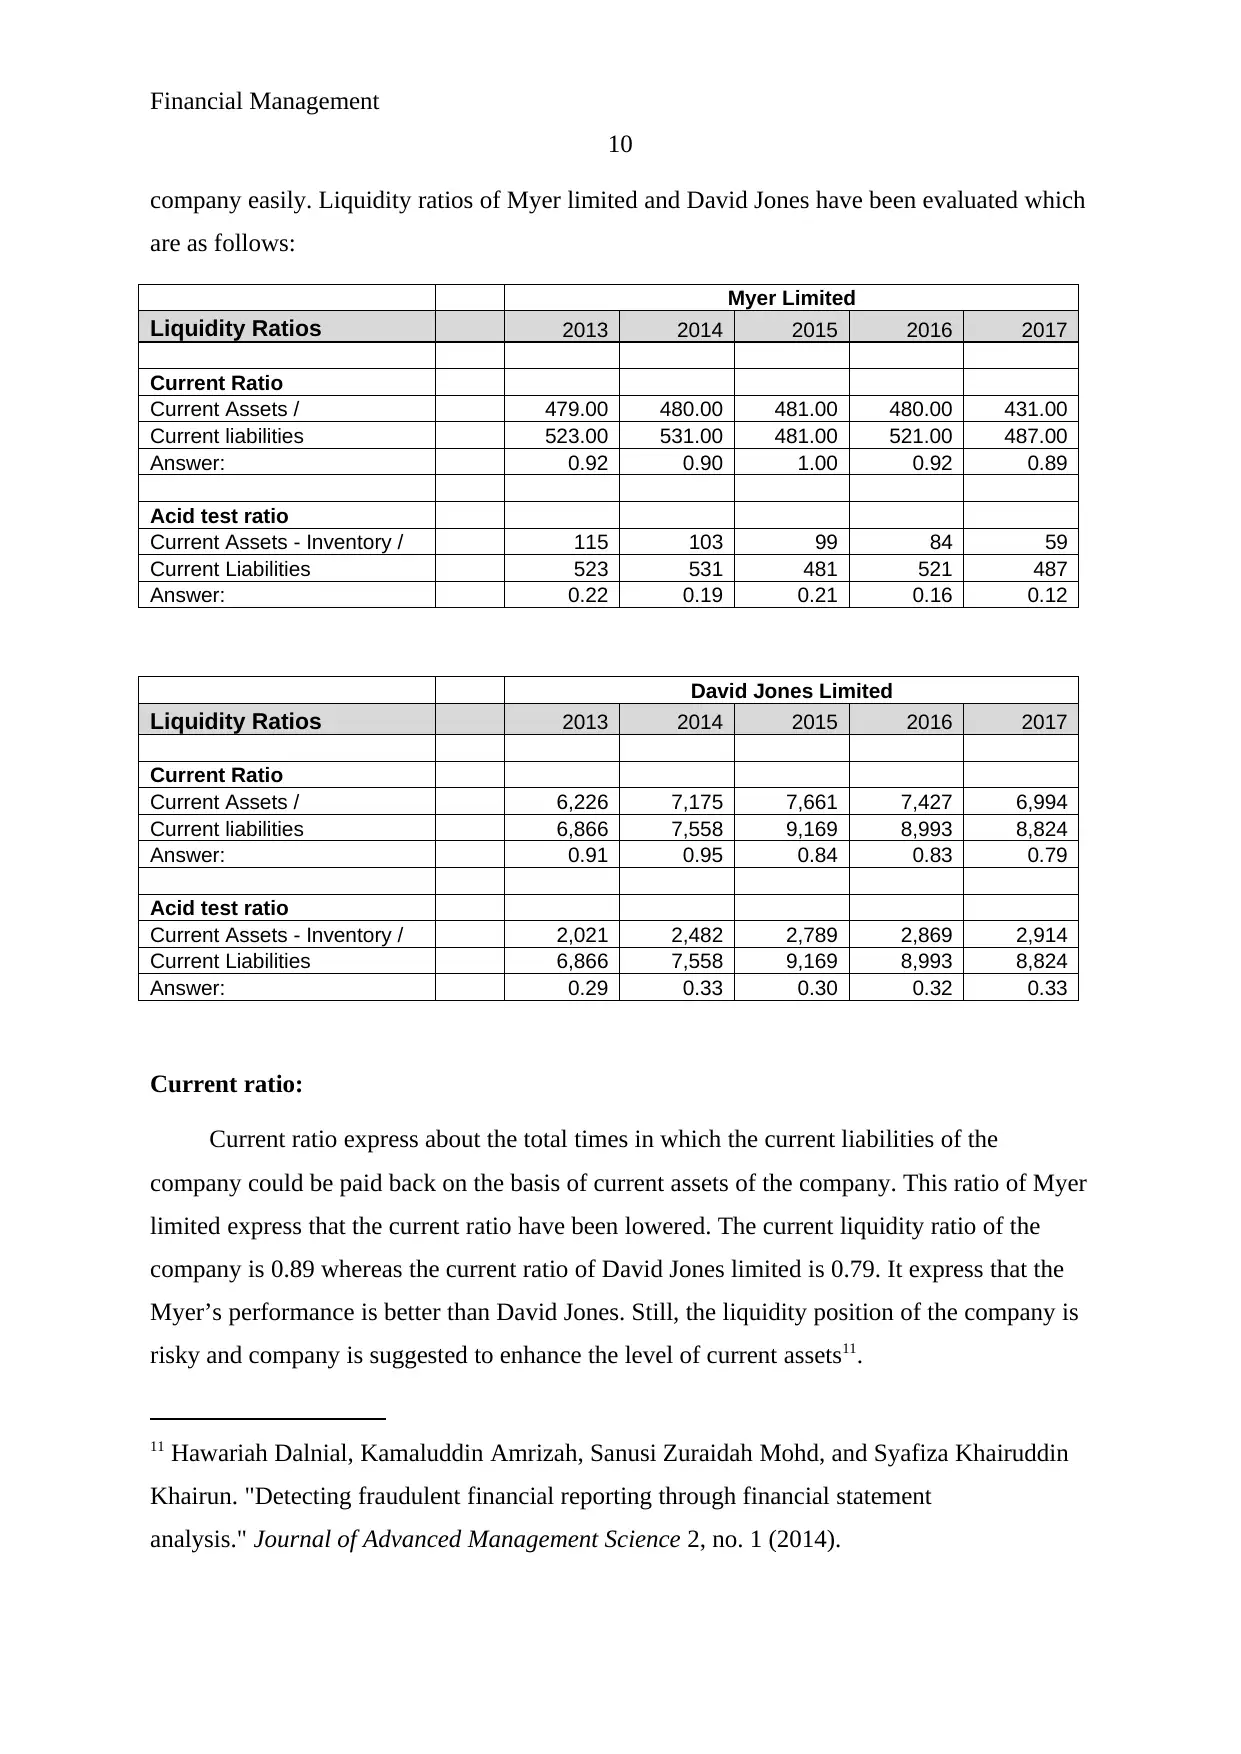
company easily. Liquidity ratios of Myer limited and David Jones have been evaluated which
are as follows:
Myer Limited
Liquidity Ratios 2013 2014 2015 2016 2017
Current Ratio
Current Assets / 479.00 480.00 481.00 480.00 431.00
Current liabilities 523.00 531.00 481.00 521.00 487.00
Answer: 0.92 0.90 1.00 0.92 0.89
Acid test ratio
Current Assets - Inventory / 115 103 99 84 59
Current Liabilities 523 531 481 521 487
Answer: 0.22 0.19 0.21 0.16 0.12
David Jones Limited
Liquidity Ratios 2013 2014 2015 2016 2017
Current Ratio
Current Assets / 6,226 7,175 7,661 7,427 6,994
Current liabilities 6,866 7,558 9,169 8,993 8,824
Answer: 0.91 0.95 0.84 0.83 0.79
Acid test ratio
Current Assets - Inventory / 2,021 2,482 2,789 2,869 2,914
Current Liabilities 6,866 7,558 9,169 8,993 8,824
Answer: 0.29 0.33 0.30 0.32 0.33
Current ratio:
Current ratio express about the total times in which the current liabilities of the
company could be paid back on the basis of current assets of the company. This ratio of Myer
limited express that the current ratio have been lowered. The current liquidity ratio of the
company is 0.89 whereas the current ratio of David Jones limited is 0.79. It express that the
Myer’s performance is better than David Jones. Still, the liquidity position of the company is
risky and company is suggested to enhance the level of current assets11.
11 Hawariah Dalnial, Kamaluddin Amrizah, Sanusi Zuraidah Mohd, and Syafiza Khairuddin
Khairun. "Detecting fraudulent financial reporting through financial statement
analysis." Journal of Advanced Management Science 2, no. 1 (2014).
10
company easily. Liquidity ratios of Myer limited and David Jones have been evaluated which
are as follows:
Myer Limited
Liquidity Ratios 2013 2014 2015 2016 2017
Current Ratio
Current Assets / 479.00 480.00 481.00 480.00 431.00
Current liabilities 523.00 531.00 481.00 521.00 487.00
Answer: 0.92 0.90 1.00 0.92 0.89
Acid test ratio
Current Assets - Inventory / 115 103 99 84 59
Current Liabilities 523 531 481 521 487
Answer: 0.22 0.19 0.21 0.16 0.12
David Jones Limited
Liquidity Ratios 2013 2014 2015 2016 2017
Current Ratio
Current Assets / 6,226 7,175 7,661 7,427 6,994
Current liabilities 6,866 7,558 9,169 8,993 8,824
Answer: 0.91 0.95 0.84 0.83 0.79
Acid test ratio
Current Assets - Inventory / 2,021 2,482 2,789 2,869 2,914
Current Liabilities 6,866 7,558 9,169 8,993 8,824
Answer: 0.29 0.33 0.30 0.32 0.33
Current ratio:
Current ratio express about the total times in which the current liabilities of the
company could be paid back on the basis of current assets of the company. This ratio of Myer
limited express that the current ratio have been lowered. The current liquidity ratio of the
company is 0.89 whereas the current ratio of David Jones limited is 0.79. It express that the
Myer’s performance is better than David Jones. Still, the liquidity position of the company is
risky and company is suggested to enhance the level of current assets11.
11 Hawariah Dalnial, Kamaluddin Amrizah, Sanusi Zuraidah Mohd, and Syafiza Khairuddin
Khairun. "Detecting fraudulent financial reporting through financial statement
analysis." Journal of Advanced Management Science 2, no. 1 (2014).
Paraphrase This Document
Need a fresh take? Get an instant paraphrase of this document with our AI Paraphraser
Financial Management
11
Acid test ratio:
Acid test ratio express about the total times in which the current liabilities of the
company could be paid back on the basis of quick assets (those assets which could be turned
into cash at any time) of the company. This ratio of Myer limited express that the acid test
ratio have been lowered. The current liquidity ratio of the company is 0.22 whereas the
current ratio of David Jones limited is 0.33. It express that the Myer’s performance is not
better than David Jones. The liquidity position of the company is risky and company is
suggested to enhance the level of quick assets.
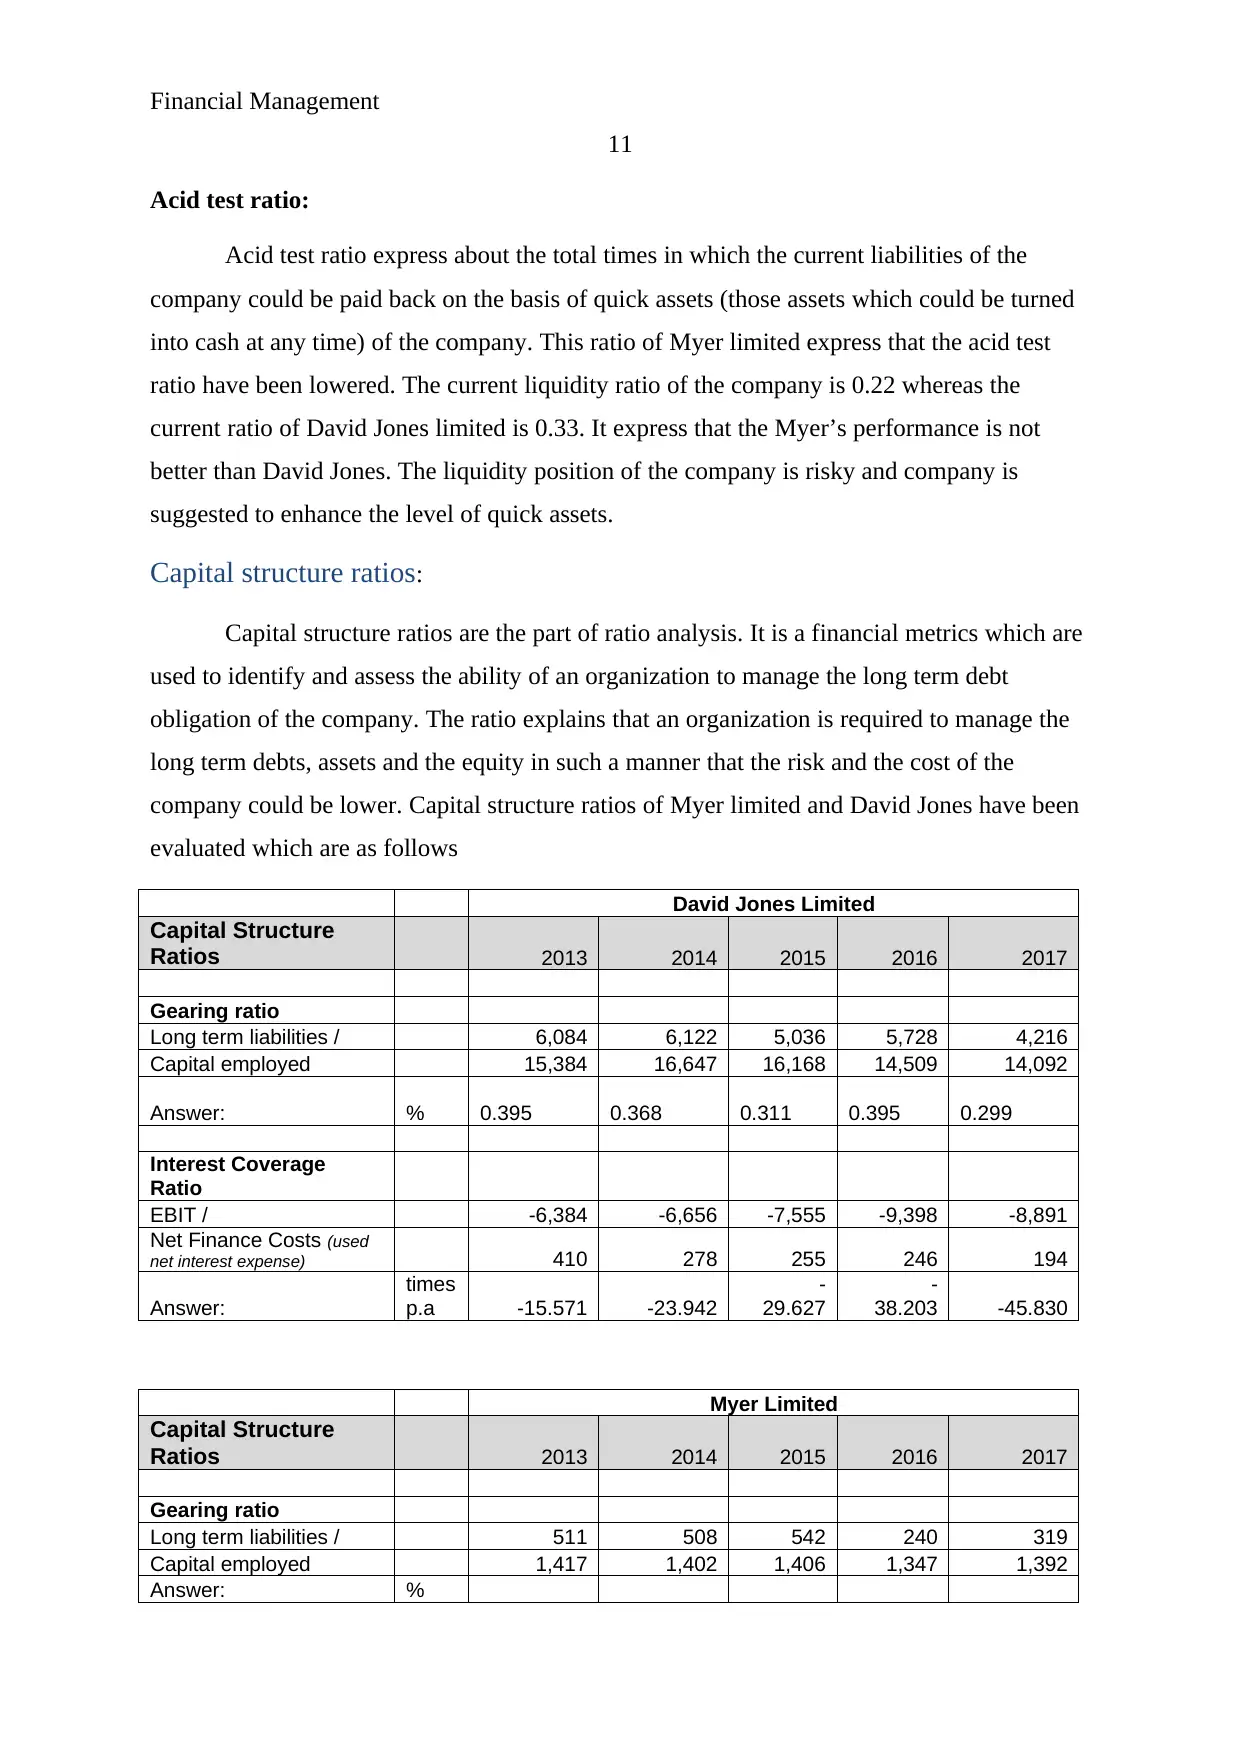
Capital structure ratios:
Capital structure ratios are the part of ratio analysis. It is a financial metrics which are
used to identify and assess the ability of an organization to manage the long term debt
obligation of the company. The ratio explains that an organization is required to manage the
long term debts, assets and the equity in such a manner that the risk and the cost of the
company could be lower. Capital structure ratios of Myer limited and David Jones have been
evaluated which are as follows
David Jones Limited
Capital Structure
Ratios 2013 2014 2015 2016 2017
Gearing ratio
Long term liabilities / 6,084 6,122 5,036 5,728 4,216
Capital employed 15,384 16,647 16,168 14,509 14,092
Answer: % 0.395 0.368 0.311 0.395 0.299
Interest Coverage
Ratio
EBIT / -6,384 -6,656 -7,555 -9,398 -8,891
Net Finance Costs (used
net interest expense) 410 278 255 246 194
Answer:
times
p.a -15.571 -23.942
-
29.627
-
38.203 -45.830
Myer Limited
Capital Structure
Ratios 2013 2014 2015 2016 2017
Gearing ratio
Long term liabilities / 511 508 542 240 319
Capital employed 1,417 1,402 1,406 1,347 1,392
Answer: %
11
Acid test ratio:
Acid test ratio express about the total times in which the current liabilities of the
company could be paid back on the basis of quick assets (those assets which could be turned
into cash at any time) of the company. This ratio of Myer limited express that the acid test
ratio have been lowered. The current liquidity ratio of the company is 0.22 whereas the
current ratio of David Jones limited is 0.33. It express that the Myer’s performance is not
better than David Jones. The liquidity position of the company is risky and company is
suggested to enhance the level of quick assets.
Capital structure ratios:
Capital structure ratios are the part of ratio analysis. It is a financial metrics which are
used to identify and assess the ability of an organization to manage the long term debt
obligation of the company. The ratio explains that an organization is required to manage the
long term debts, assets and the equity in such a manner that the risk and the cost of the
company could be lower. Capital structure ratios of Myer limited and David Jones have been
evaluated which are as follows
David Jones Limited
Capital Structure
Ratios 2013 2014 2015 2016 2017
Gearing ratio
Long term liabilities / 6,084 6,122 5,036 5,728 4,216
Capital employed 15,384 16,647 16,168 14,509 14,092
Answer: % 0.395 0.368 0.311 0.395 0.299
Interest Coverage
Ratio
EBIT / -6,384 -6,656 -7,555 -9,398 -8,891
Net Finance Costs (used
net interest expense) 410 278 255 246 194
Answer:
times
p.a -15.571 -23.942
-
29.627
-
38.203 -45.830
Myer Limited
Capital Structure
Ratios 2013 2014 2015 2016 2017
Gearing ratio
Long term liabilities / 511 508 542 240 319
Capital employed 1,417 1,402 1,406 1,347 1,392
Answer: %
Financial Management
12
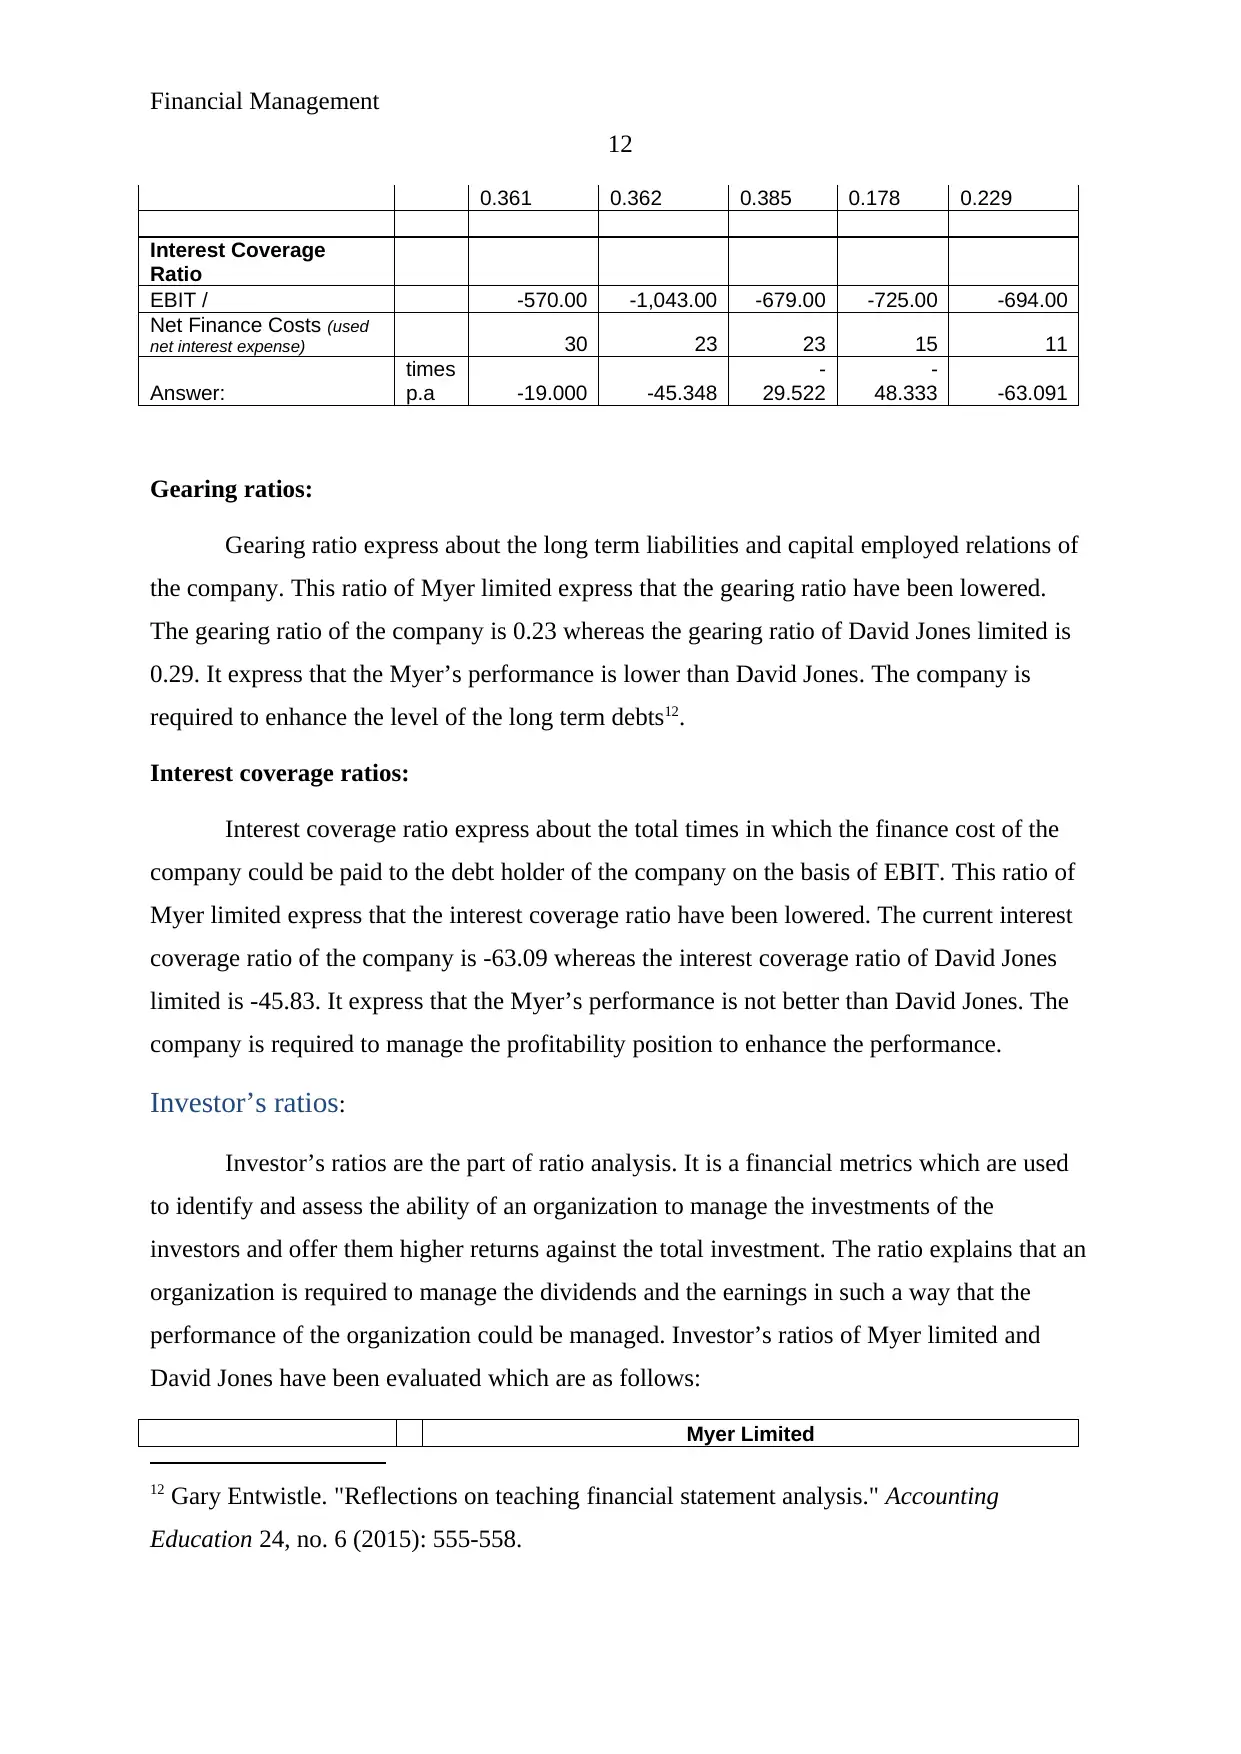
0.361 0.362 0.385 0.178 0.229
Interest Coverage
Ratio
EBIT / -570.00 -1,043.00 -679.00 -725.00 -694.00
Net Finance Costs (used
net interest expense) 30 23 23 15 11
Answer:
times
p.a -19.000 -45.348
-
29.522
-
48.333 -63.091
Gearing ratios:
Gearing ratio express about the long term liabilities and capital employed relations of
the company. This ratio of Myer limited express that the gearing ratio have been lowered.
The gearing ratio of the company is 0.23 whereas the gearing ratio of David Jones limited is
0.29. It express that the Myer’s performance is lower than David Jones. The company is
required to enhance the level of the long term debts12.
Interest coverage ratios:
Interest coverage ratio express about the total times in which the finance cost of the
company could be paid to the debt holder of the company on the basis of EBIT. This ratio of
Myer limited express that the interest coverage ratio have been lowered. The current interest
coverage ratio of the company is -63.09 whereas the interest coverage ratio of David Jones
limited is -45.83. It express that the Myer’s performance is not better than David Jones. The
company is required to manage the profitability position to enhance the performance.
Investor’s ratios:
Investor’s ratios are the part of ratio analysis. It is a financial metrics which are used
to identify and assess the ability of an organization to manage the investments of the
investors and offer them higher returns against the total investment. The ratio explains that an
organization is required to manage the dividends and the earnings in such a way that the
performance of the organization could be managed. Investor’s ratios of Myer limited and
David Jones have been evaluated which are as follows:
Myer Limited
12 Gary Entwistle. "Reflections on teaching financial statement analysis." Accounting
Education 24, no. 6 (2015): 555-558.
12
0.361 0.362 0.385 0.178 0.229
Interest Coverage
Ratio
EBIT / -570.00 -1,043.00 -679.00 -725.00 -694.00
Net Finance Costs (used
net interest expense) 30 23 23 15 11
Answer:
times
p.a -19.000 -45.348
-
29.522
-
48.333 -63.091
Gearing ratios:
Gearing ratio express about the long term liabilities and capital employed relations of
the company. This ratio of Myer limited express that the gearing ratio have been lowered.
The gearing ratio of the company is 0.23 whereas the gearing ratio of David Jones limited is
0.29. It express that the Myer’s performance is lower than David Jones. The company is
required to enhance the level of the long term debts12.
Interest coverage ratios:
Interest coverage ratio express about the total times in which the finance cost of the
company could be paid to the debt holder of the company on the basis of EBIT. This ratio of
Myer limited express that the interest coverage ratio have been lowered. The current interest
coverage ratio of the company is -63.09 whereas the interest coverage ratio of David Jones
limited is -45.83. It express that the Myer’s performance is not better than David Jones. The
company is required to manage the profitability position to enhance the performance.
Investor’s ratios:
Investor’s ratios are the part of ratio analysis. It is a financial metrics which are used
to identify and assess the ability of an organization to manage the investments of the
investors and offer them higher returns against the total investment. The ratio explains that an
organization is required to manage the dividends and the earnings in such a way that the
performance of the organization could be managed. Investor’s ratios of Myer limited and
David Jones have been evaluated which are as follows:
Myer Limited
12 Gary Entwistle. "Reflections on teaching financial statement analysis." Accounting
Education 24, no. 6 (2015): 555-558.
⊘ This is a preview!⊘
Do you want full access?
Subscribe today to unlock all pages.
Trusted by 1+ million students worldwide
1 out of 19
Related Documents


Your All-in-One AI-Powered Toolkit for Academic Success.
+13062052269
info@desklib.com
Available 24*7 on WhatsApp / Email
![[object Object]](/_next/static/media/star-bottom.7253800d.svg)
Unlock your academic potential
Copyright © 2020–2026 A2Z Services. All Rights Reserved. Developed and managed by ZUCOL.