Financial Analysis of National Australian Bank: Report
VerifiedAdded on 2021/05/30
|20
|4009
|28
Report
AI Summary
This report offers a detailed financial analysis of the National Australian Bank (NAB), evaluating its performance to provide insights for potential investors. The analysis includes an overview of the company's structure, ownership, and governance, identifying key shareholders and personnel. It computes and interprets various financial ratios, including short-term and long-term solvency, asset utilization, profitability, and market value ratios. The report also presents graphical representations of share price movements, comparing them to the All Ords Index and identifying factors influencing NAB's share price. Furthermore, it applies the CAPM model to calculate beta and the expected rate of return, computes the Weighted Average Cost of Capital (WACC), and discusses dividend policy and debt ratio. Finally, the report concludes with investment recommendations based on the financial analysis.
Running head: FINANCE FOR BUSINESS
Finance for Business
Name of the Student
Name of the University
Authors Note
Course ID
Finance for Business
Name of the Student
Name of the University
Authors Note
Course ID
Paraphrase This Document
Need a fresh take? Get an instant paraphrase of this document with our AI Paraphraser
1FINANCE FOR BUSINESS
Table of Contents
Introduction:...............................................................................................................................2
Description of Company:...........................................................................................................2
Ownership and structure of governance of the company:..........................................................3
Main Substantial Shareholders:..............................................................................................3
Main people involved in Company’s Governance:................................................................4
Computation of Fundamental Ratios:........................................................................................5
Short Term Solvency:............................................................................................................5
Long Term Solvency:.............................................................................................................6
Asset Utilization:....................................................................................................................6
Profitability Ratios:................................................................................................................7
Market Value Ratios:.................................................................................................................7
Graphical Descriptions of Results:.............................................................................................8
Movement in Monthly Share Price:.......................................................................................8
Comparative Analysis of Movement in Share Price Index to All Ords Index:..........................8
Identifications of factors that influences the share price of the company:.................................9
Calculations of Beta and the Expected Rate of Returns using CAPM:...................................10
Computed Beta of the Company:.........................................................................................10
Calculations of the required rate of Return using CAPM Model:.......................................11
Conservative Investment:.....................................................................................................11
Computation of WACC:..........................................................................................................12
2FINANCE FOR BUSINESS
Weighted Average Cost of Capital for National Australian Bank:......................................12
Explanation of WACC has on management evaluation of investment prospective:...........13
Debt Ratio:...............................................................................................................................13
Dividend Policy:.......................................................................................................................14
Letter of Recommendations.....................................................................................................14
Conclusion:..............................................................................................................................15
Reference List:.........................................................................................................................16
⊘ This is a preview!⊘
Do you want full access?
Subscribe today to unlock all pages.
Trusted by 1+ million students worldwide
3FINANCE FOR BUSINESS
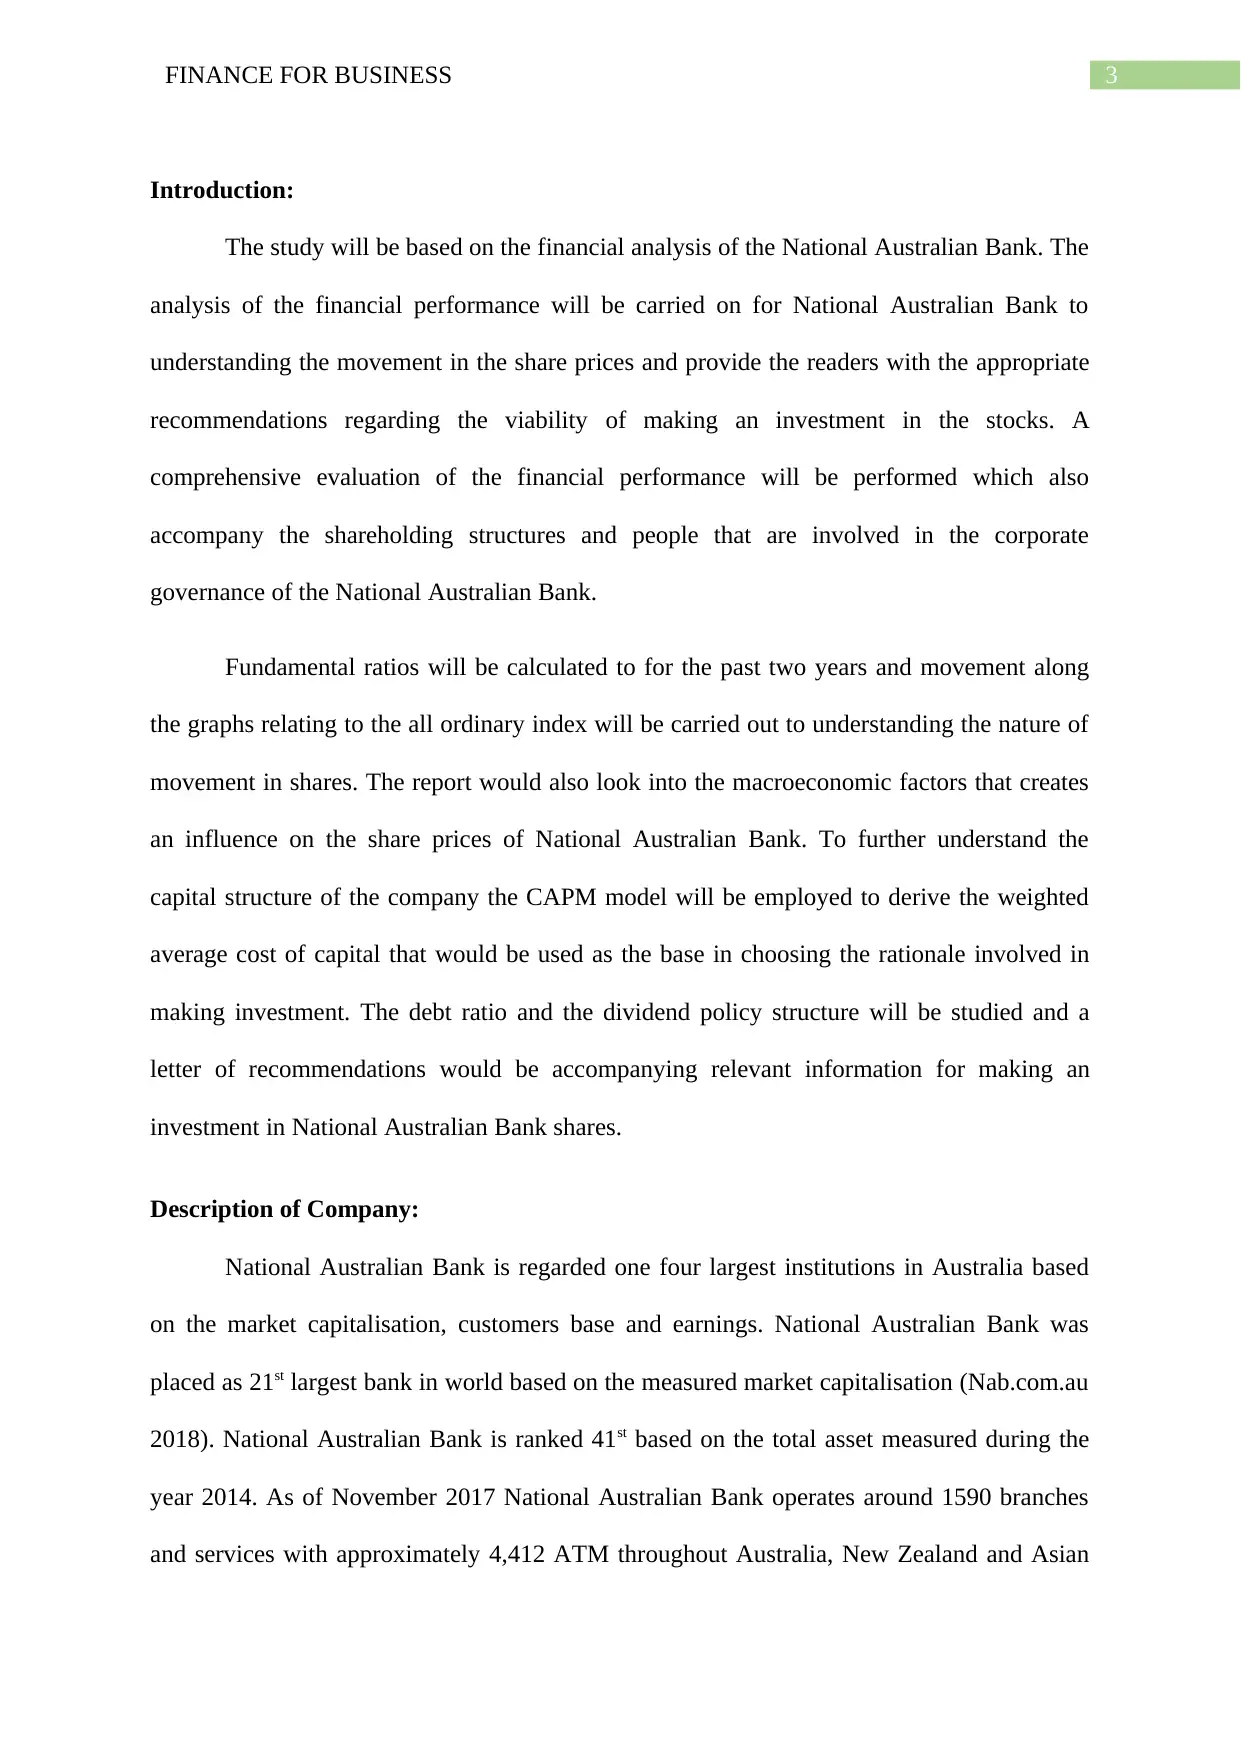
Introduction:
The study will be based on the financial analysis of the National Australian Bank. The
analysis of the financial performance will be carried on for National Australian Bank to
understanding the movement in the share prices and provide the readers with the appropriate
recommendations regarding the viability of making an investment in the stocks. A
comprehensive evaluation of the financial performance will be performed which also
accompany the shareholding structures and people that are involved in the corporate
governance of the National Australian Bank.
Fundamental ratios will be calculated to for the past two years and movement along
the graphs relating to the all ordinary index will be carried out to understanding the nature of
movement in shares. The report would also look into the macroeconomic factors that creates
an influence on the share prices of National Australian Bank. To further understand the
capital structure of the company the CAPM model will be employed to derive the weighted
average cost of capital that would be used as the base in choosing the rationale involved in
making investment. The debt ratio and the dividend policy structure will be studied and a
letter of recommendations would be accompanying relevant information for making an
investment in National Australian Bank shares.
Description of Company:
National Australian Bank is regarded one four largest institutions in Australia based
on the market capitalisation, customers base and earnings. National Australian Bank was
placed as 21st largest bank in world based on the measured market capitalisation (Nab.com.au
2018). National Australian Bank is ranked 41st based on the total asset measured during the
year 2014. As of November 2017 National Australian Bank operates around 1590 branches
and services with approximately 4,412 ATM throughout Australia, New Zealand and Asian
Paraphrase This Document
Need a fresh take? Get an instant paraphrase of this document with our AI Paraphraser
4FINANCE FOR BUSINESS
serving 12.7 million customers. National Australian Bank was created as the National
Commercial Banking Corporation of Australia Ltd during the year 1982 upon the merger of
National Bank of Australasia and the Commercial Banking Company of Sydney. As a result
this, the bank was subsequently renamed as the National Australian Bank Ltd.
The bank witnessed the period of quick expansion as National Australian Bank
bought several bank through acquisition with the acquisition of Home Side Lending which
was one of the leading US based mortgage originator and service provider having base in
Florida (Nab.com.au 2018). National Australian Bank launched during the year 2008
launched a brachless direct banking and traded separately as the U-Bank under the leadership
of the Greg Sutherland and Gerd Schenket. The National Australian Bank during the year
2009 commenced a strategy of reputation change, management of wealth and placed larger
emphasis on the domestic markets.
Ownership and structure of governance of the company:
Main Substantial Shareholders:
As of 31st October 2017, the Black Rock Group along with its associated companies
formed the substantial shareholders of National Australian Bank. The Black Rock Group held
more than 147,042,052 fully paid ordinary shares in the National Australian Bank that
accounted for 10.23% of the total ordinary shares (Nab.com.au 2018). Based on the
information it can be stated that National Australian Bank is a non-family based company.
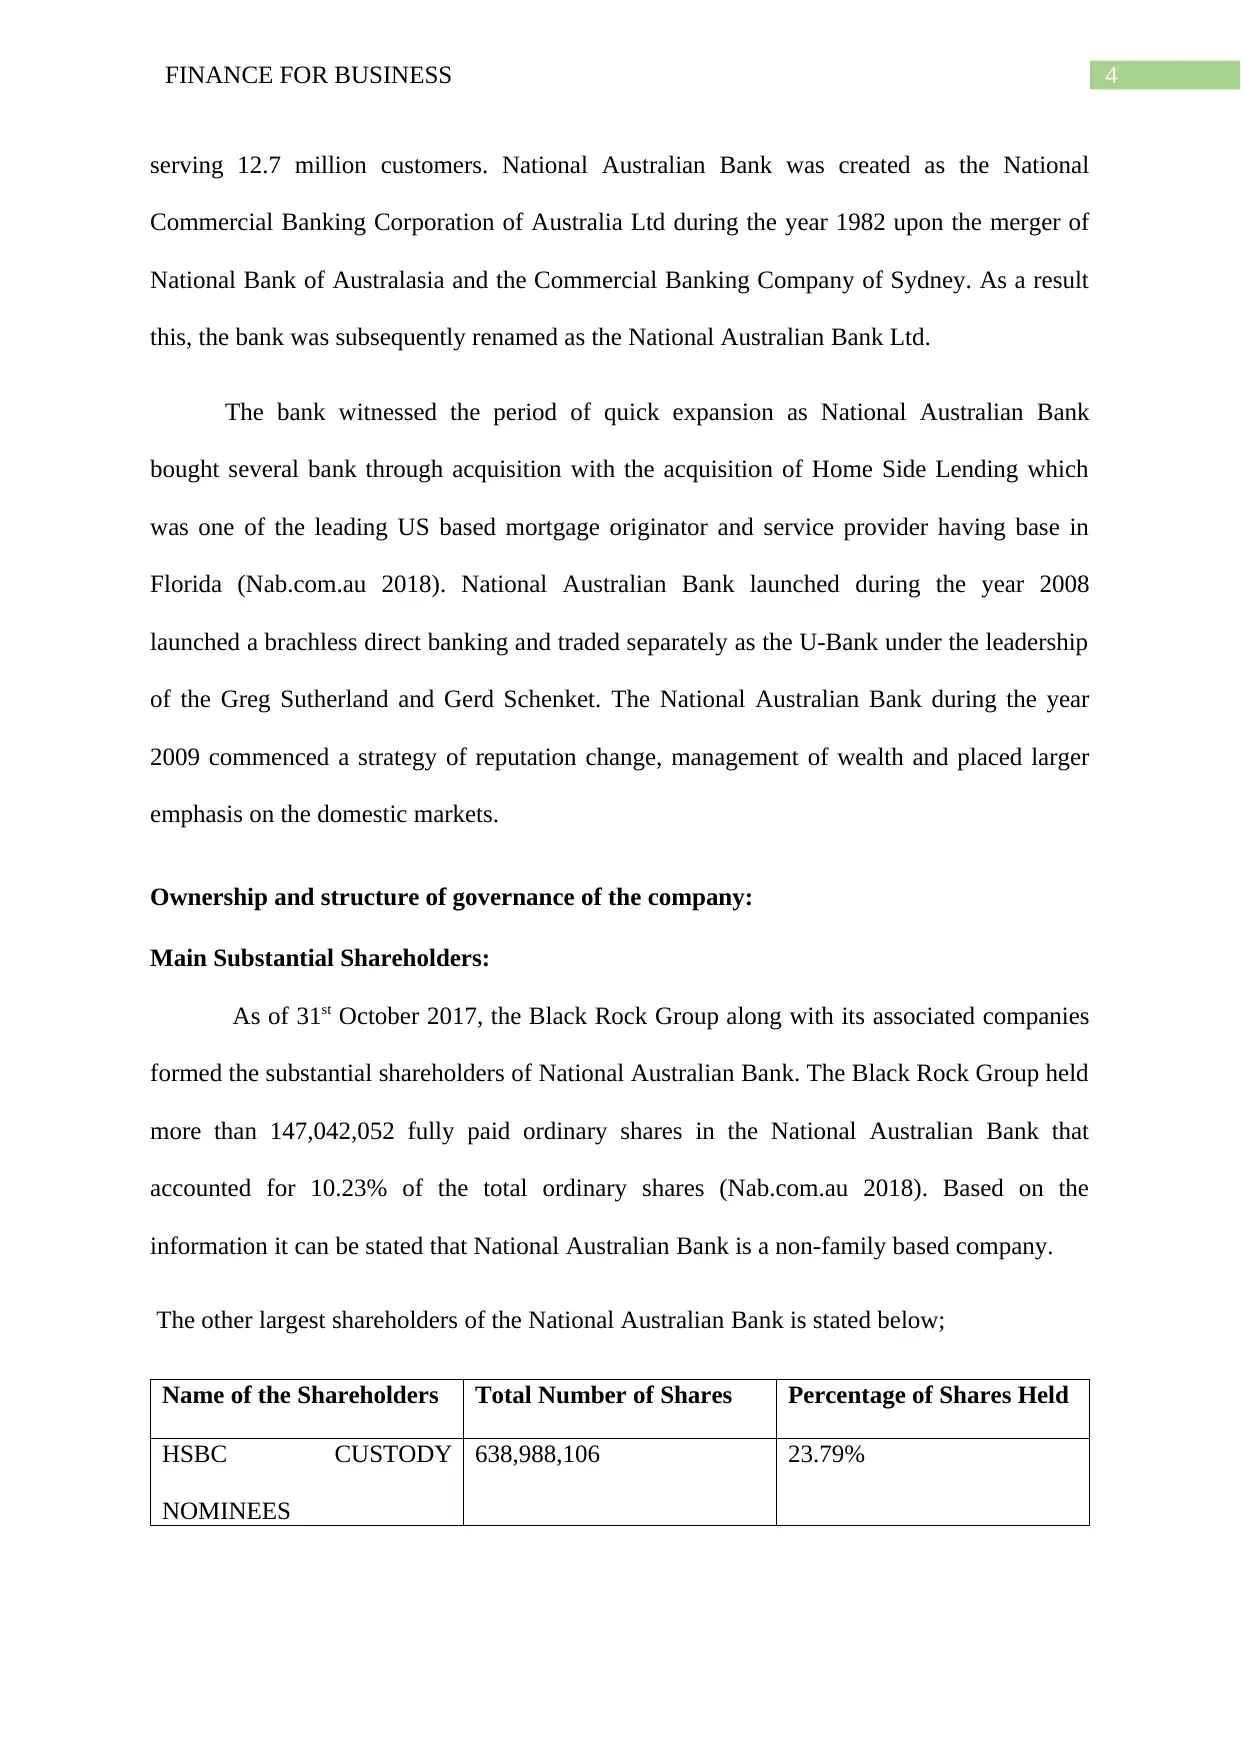
The other largest shareholders of the National Australian Bank is stated below;
Name of the Shareholders Total Number of Shares Percentage of Shares Held
HSBC CUSTODY
NOMINEES
638,988,106 23.79%
serving 12.7 million customers. National Australian Bank was created as the National
Commercial Banking Corporation of Australia Ltd during the year 1982 upon the merger of
National Bank of Australasia and the Commercial Banking Company of Sydney. As a result
this, the bank was subsequently renamed as the National Australian Bank Ltd.
The bank witnessed the period of quick expansion as National Australian Bank
bought several bank through acquisition with the acquisition of Home Side Lending which
was one of the leading US based mortgage originator and service provider having base in
Florida (Nab.com.au 2018). National Australian Bank launched during the year 2008
launched a brachless direct banking and traded separately as the U-Bank under the leadership
of the Greg Sutherland and Gerd Schenket. The National Australian Bank during the year
2009 commenced a strategy of reputation change, management of wealth and placed larger
emphasis on the domestic markets.
Ownership and structure of governance of the company:
Main Substantial Shareholders:
As of 31st October 2017, the Black Rock Group along with its associated companies
formed the substantial shareholders of National Australian Bank. The Black Rock Group held
more than 147,042,052 fully paid ordinary shares in the National Australian Bank that
accounted for 10.23% of the total ordinary shares (Nab.com.au 2018). Based on the
information it can be stated that National Australian Bank is a non-family based company.
The other largest shareholders of the National Australian Bank is stated below;
Name of the Shareholders Total Number of Shares Percentage of Shares Held
HSBC CUSTODY
NOMINEES
638,988,106 23.79%
5FINANCE FOR BUSINESS
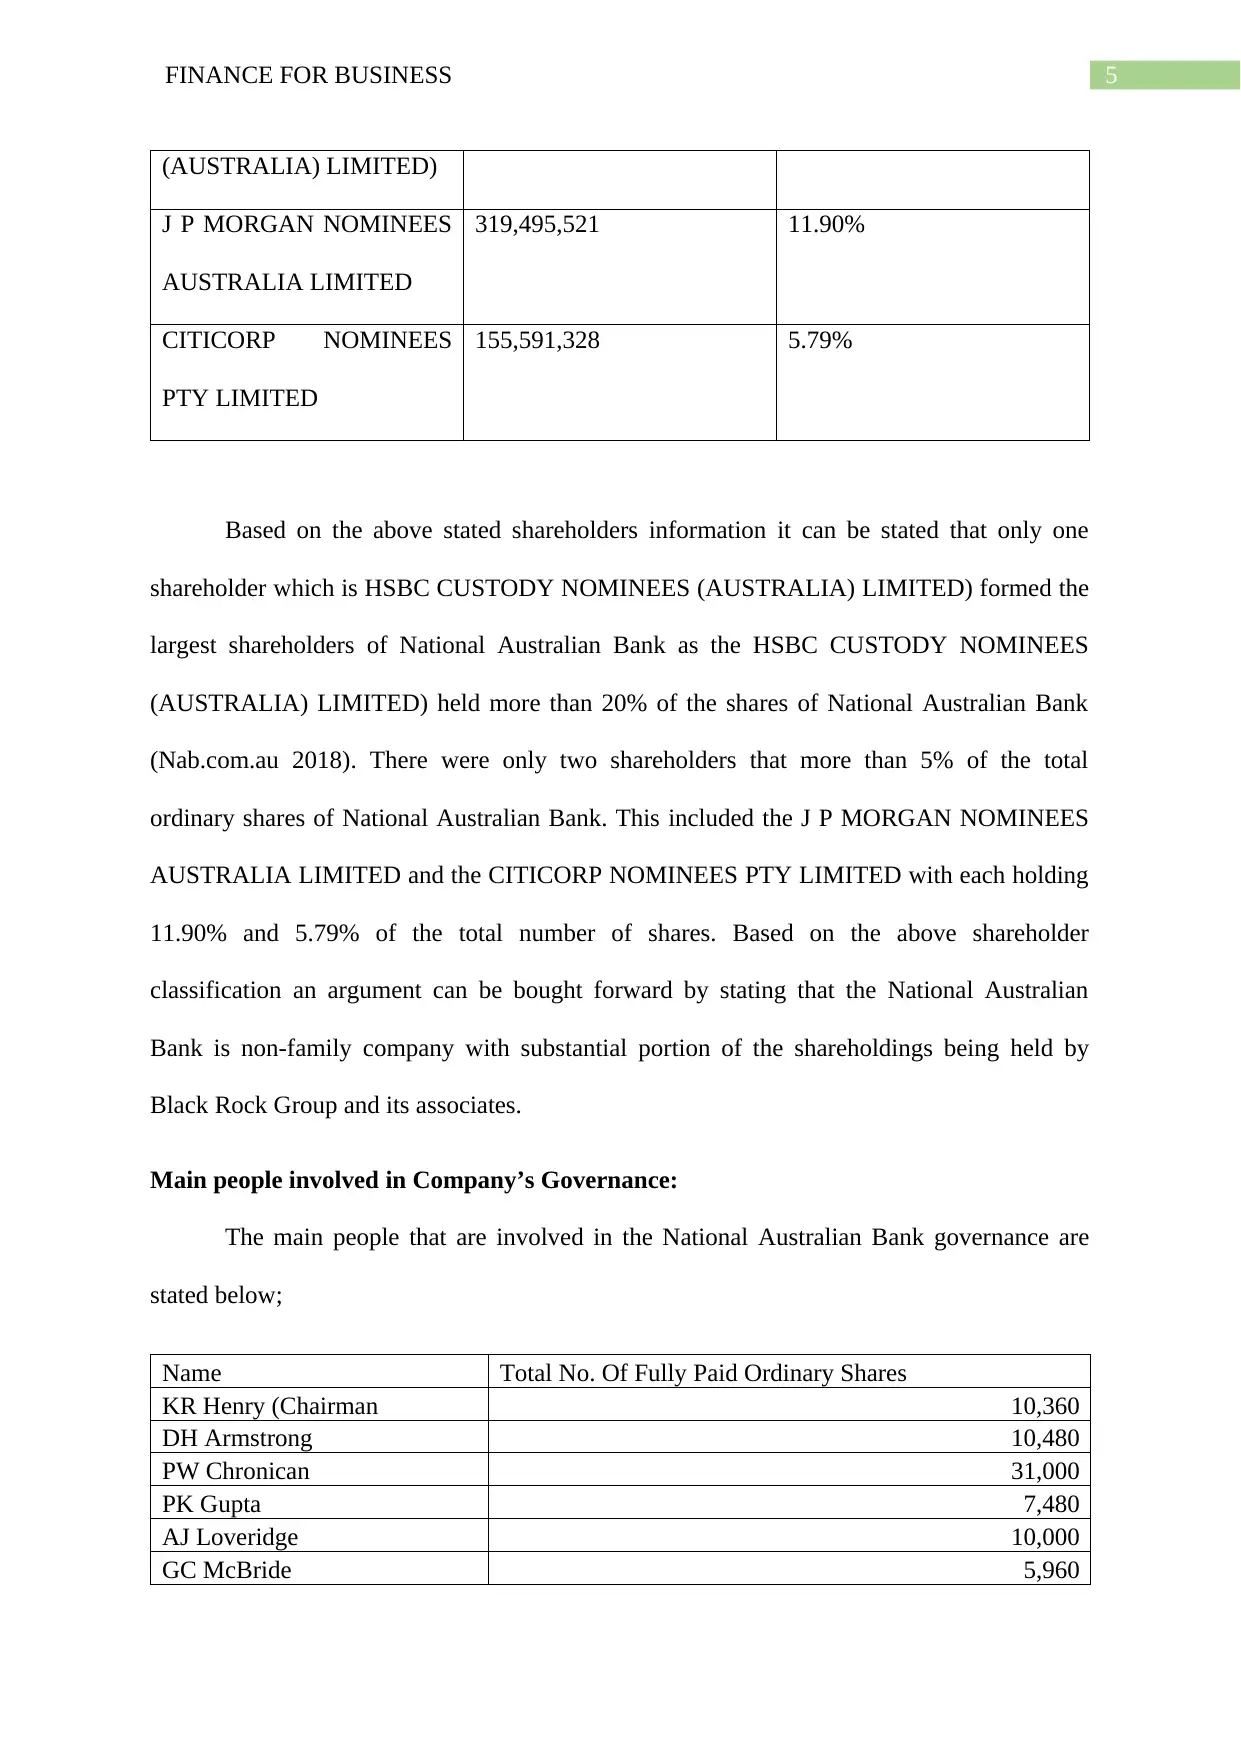
(AUSTRALIA) LIMITED)
J P MORGAN NOMINEES
AUSTRALIA LIMITED
319,495,521 11.90%
CITICORP NOMINEES
PTY LIMITED
155,591,328 5.79%
Based on the above stated shareholders information it can be stated that only one
shareholder which is HSBC CUSTODY NOMINEES (AUSTRALIA) LIMITED) formed the
largest shareholders of National Australian Bank as the HSBC CUSTODY NOMINEES
(AUSTRALIA) LIMITED) held more than 20% of the shares of National Australian Bank
(Nab.com.au 2018). There were only two shareholders that more than 5% of the total
ordinary shares of National Australian Bank. This included the J P MORGAN NOMINEES
AUSTRALIA LIMITED and the CITICORP NOMINEES PTY LIMITED with each holding
11.90% and 5.79% of the total number of shares. Based on the above shareholder
classification an argument can be bought forward by stating that the National Australian
Bank is non-family company with substantial portion of the shareholdings being held by
Black Rock Group and its associates.
Main people involved in Company’s Governance:
The main people that are involved in the National Australian Bank governance are
stated below;
Name Total No. Of Fully Paid Ordinary Shares
KR Henry (Chairman 10,360
DH Armstrong 10,480
PW Chronican 31,000
PK Gupta 7,480
AJ Loveridge 10,000
GC McBride 5,960
⊘ This is a preview!⊘
Do you want full access?
Subscribe today to unlock all pages.
Trusted by 1+ million students worldwide
6FINANCE FOR BUSINESS
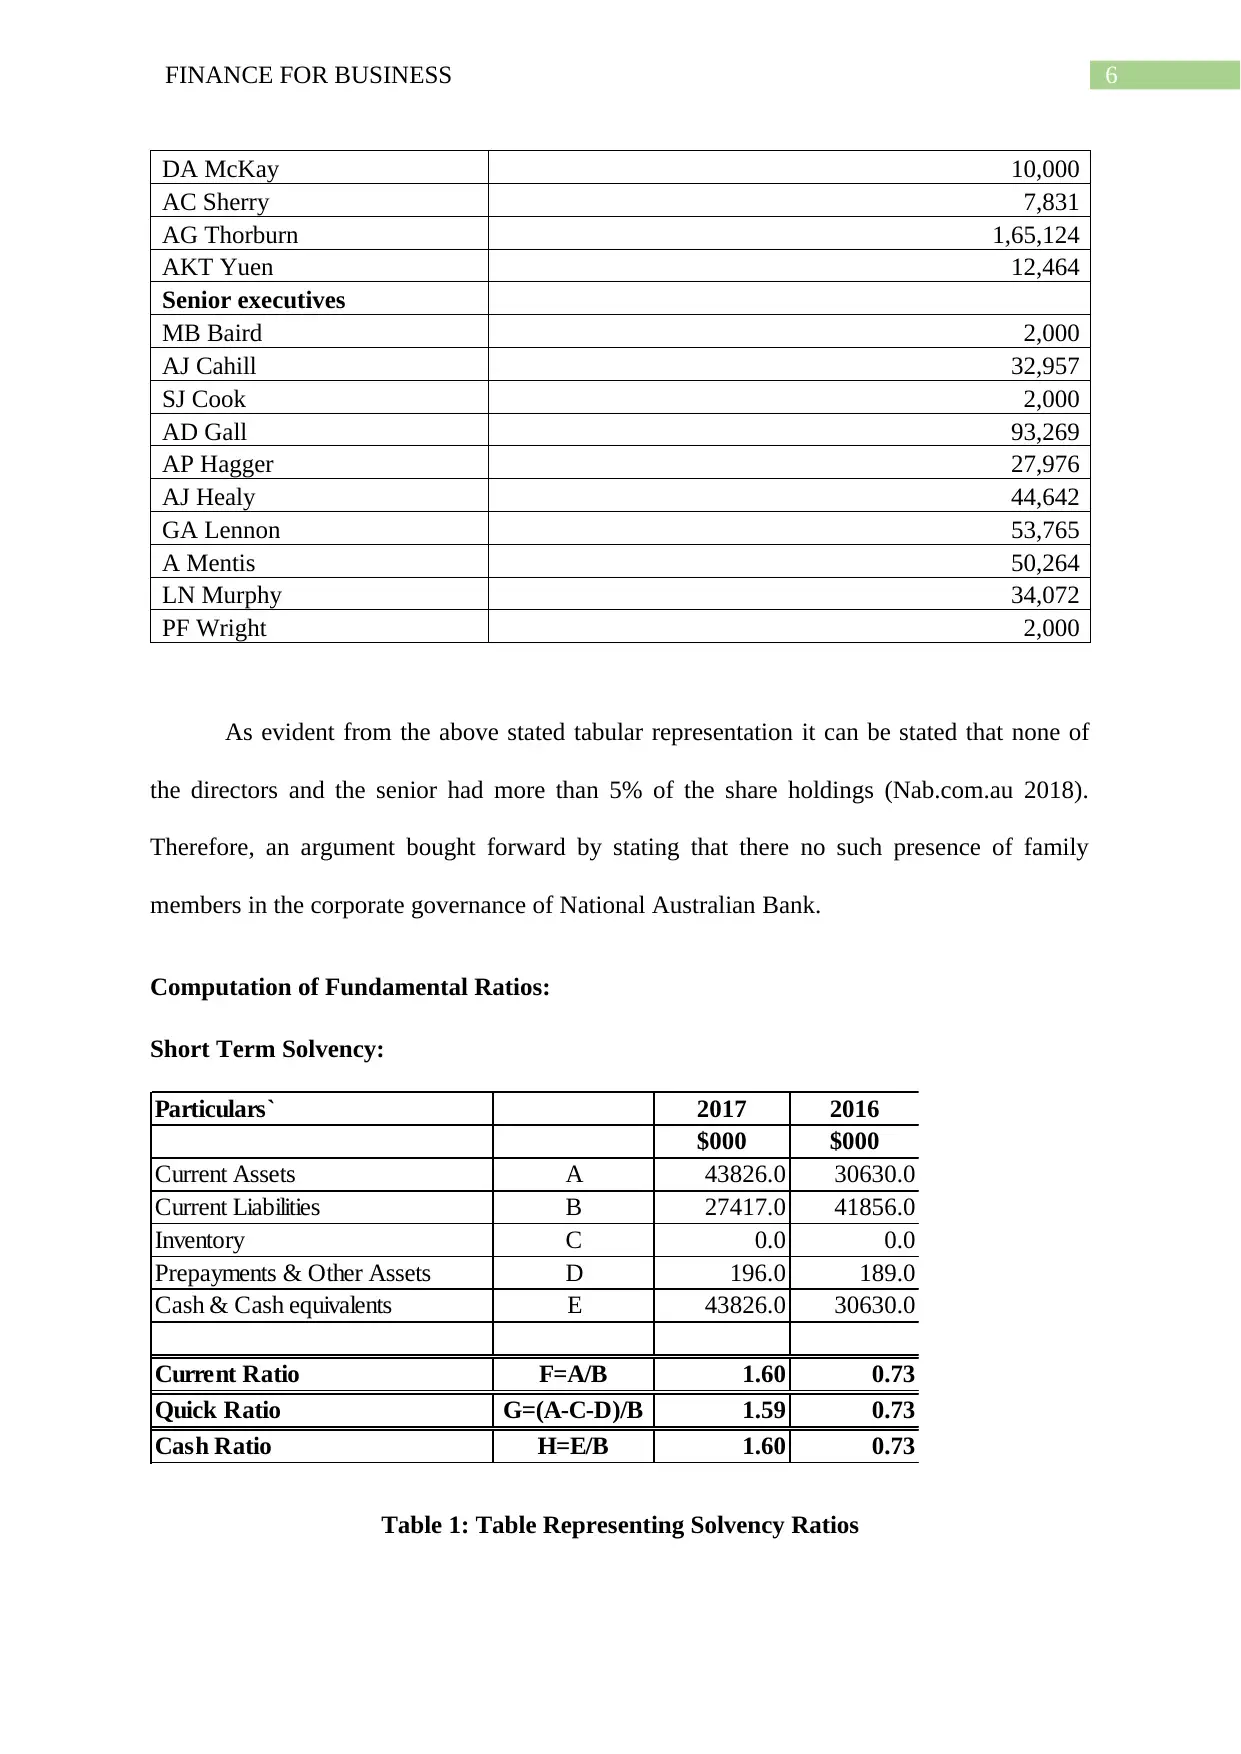
DA McKay 10,000
AC Sherry 7,831
AG Thorburn 1,65,124
AKT Yuen 12,464
Senior executives
MB Baird 2,000
AJ Cahill 32,957
SJ Cook 2,000
AD Gall 93,269
AP Hagger 27,976
AJ Healy 44,642
GA Lennon 53,765
A Mentis 50,264
LN Murphy 34,072
PF Wright 2,000
As evident from the above stated tabular representation it can be stated that none of
the directors and the senior had more than 5% of the share holdings (Nab.com.au 2018).
Therefore, an argument bought forward by stating that there no such presence of family
members in the corporate governance of National Australian Bank.
Computation of Fundamental Ratios:
Short Term Solvency:
Particulars` 2017 2016
$000 $000
Current Assets A 43826.0 30630.0
Current Liabilities B 27417.0 41856.0
Inventory C 0.0 0.0
Prepayments & Other Assets D 196.0 189.0
Cash & Cash equivalents E 43826.0 30630.0
Current Ratio F=A/B 1.60 0.73
Quick Ratio G=(A-C-D)/B 1.59 0.73
Cash Ratio H=E/B 1.60 0.73
Table 1: Table Representing Solvency Ratios
Paraphrase This Document
Need a fresh take? Get an instant paraphrase of this document with our AI Paraphraser
7FINANCE FOR BUSINESS
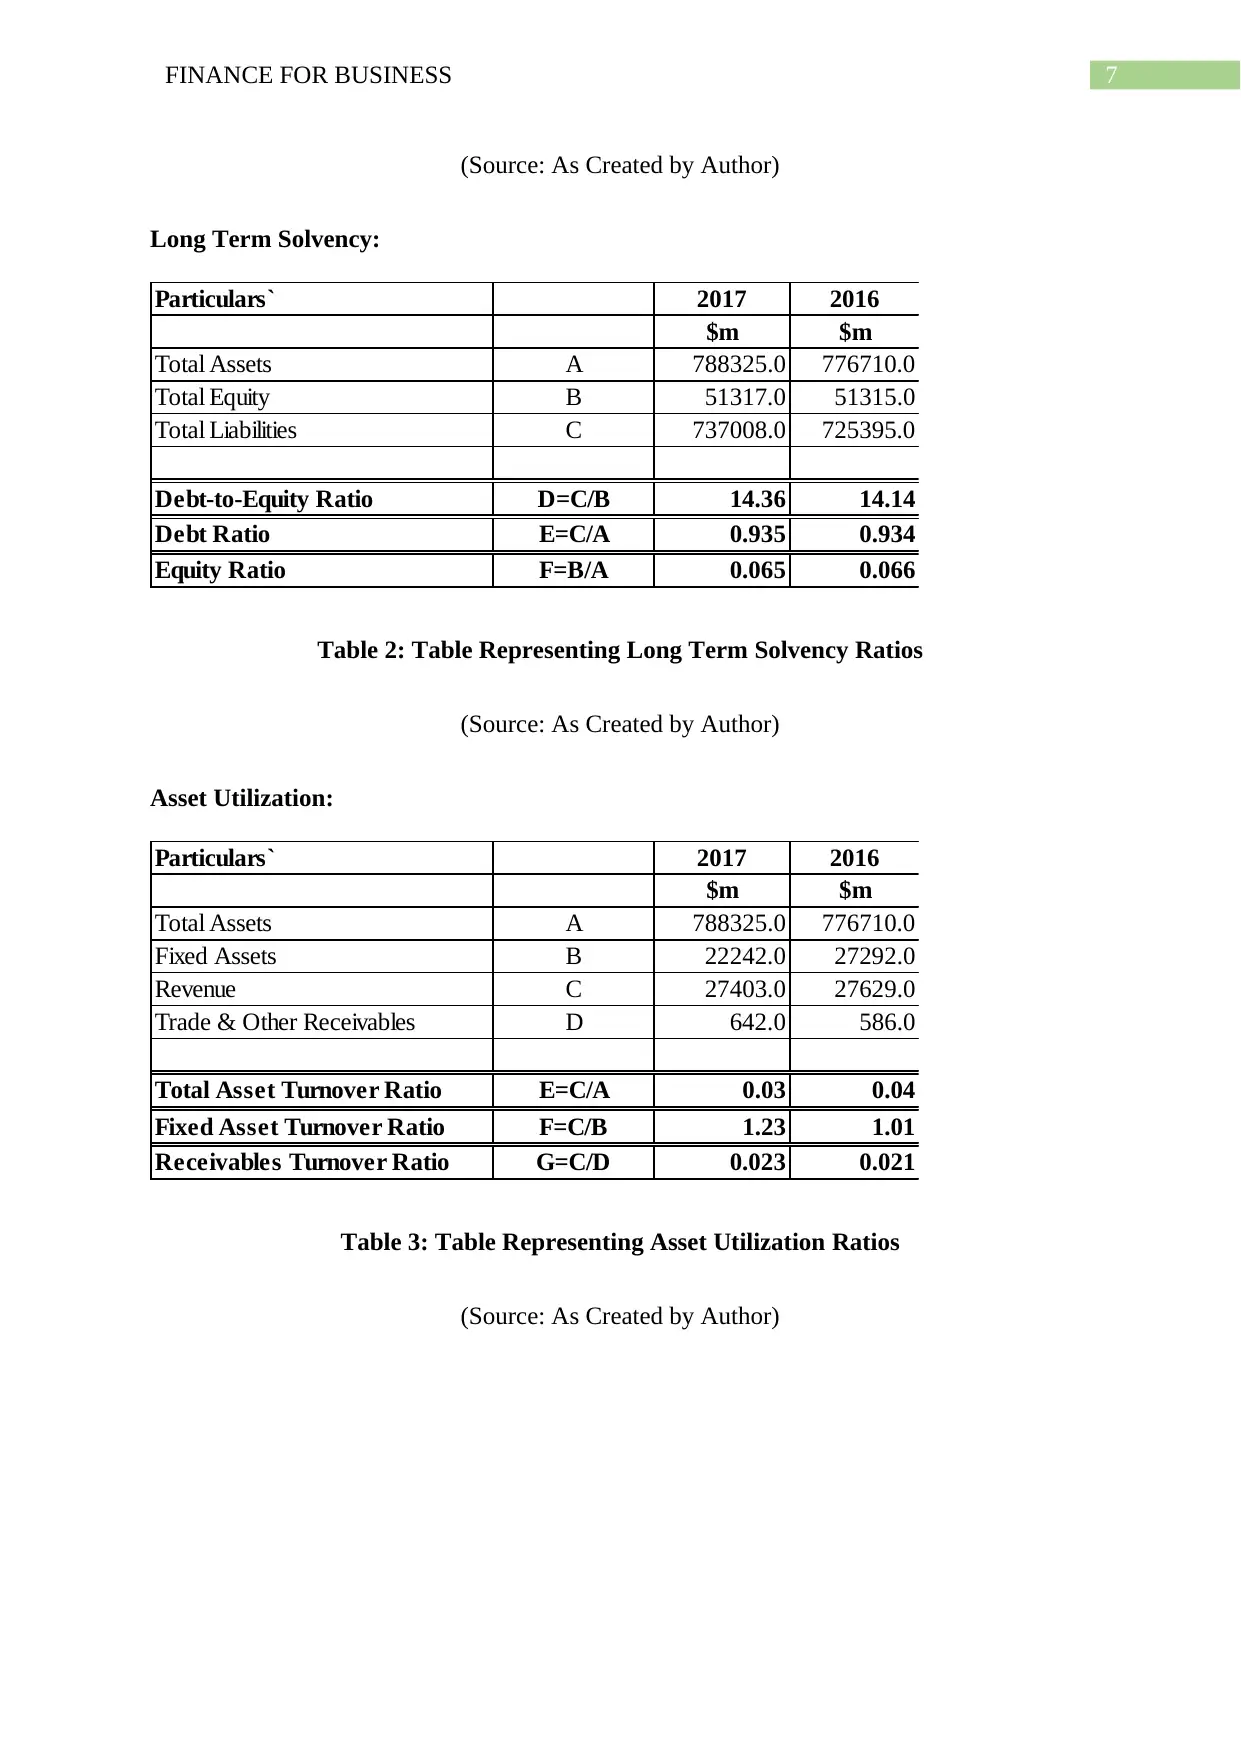
(Source: As Created by Author)
Long Term Solvency:
Particulars` 2017 2016
$m $m
Total Assets A 788325.0 776710.0
Total Equity B 51317.0 51315.0
Total Liabilities C 737008.0 725395.0
Debt-to-Equity Ratio D=C/B 14.36 14.14
Debt Ratio E=C/A 0.935 0.934
Equity Ratio F=B/A 0.065 0.066
Table 2: Table Representing Long Term Solvency Ratios
(Source: As Created by Author)
Asset Utilization:
Particulars` 2017 2016
$m $m
Total Assets A 788325.0 776710.0
Fixed Assets B 22242.0 27292.0
Revenue C 27403.0 27629.0
Trade & Other Receivables D 642.0 586.0
Total Asset Turnover Ratio E=C/A 0.03 0.04
Fixed Asset Turnover Ratio F=C/B 1.23 1.01
Receivables Turnover Ratio G=C/D 0.023 0.021
Table 3: Table Representing Asset Utilization Ratios
(Source: As Created by Author)
(Source: As Created by Author)
Long Term Solvency:
Particulars` 2017 2016
$m $m
Total Assets A 788325.0 776710.0
Total Equity B 51317.0 51315.0
Total Liabilities C 737008.0 725395.0
Debt-to-Equity Ratio D=C/B 14.36 14.14
Debt Ratio E=C/A 0.935 0.934
Equity Ratio F=B/A 0.065 0.066
Table 2: Table Representing Long Term Solvency Ratios
(Source: As Created by Author)
Asset Utilization:
Particulars` 2017 2016
$m $m
Total Assets A 788325.0 776710.0
Fixed Assets B 22242.0 27292.0
Revenue C 27403.0 27629.0
Trade & Other Receivables D 642.0 586.0
Total Asset Turnover Ratio E=C/A 0.03 0.04
Fixed Asset Turnover Ratio F=C/B 1.23 1.01
Receivables Turnover Ratio G=C/D 0.023 0.021
Table 3: Table Representing Asset Utilization Ratios
(Source: As Created by Author)
8FINANCE FOR BUSINESS
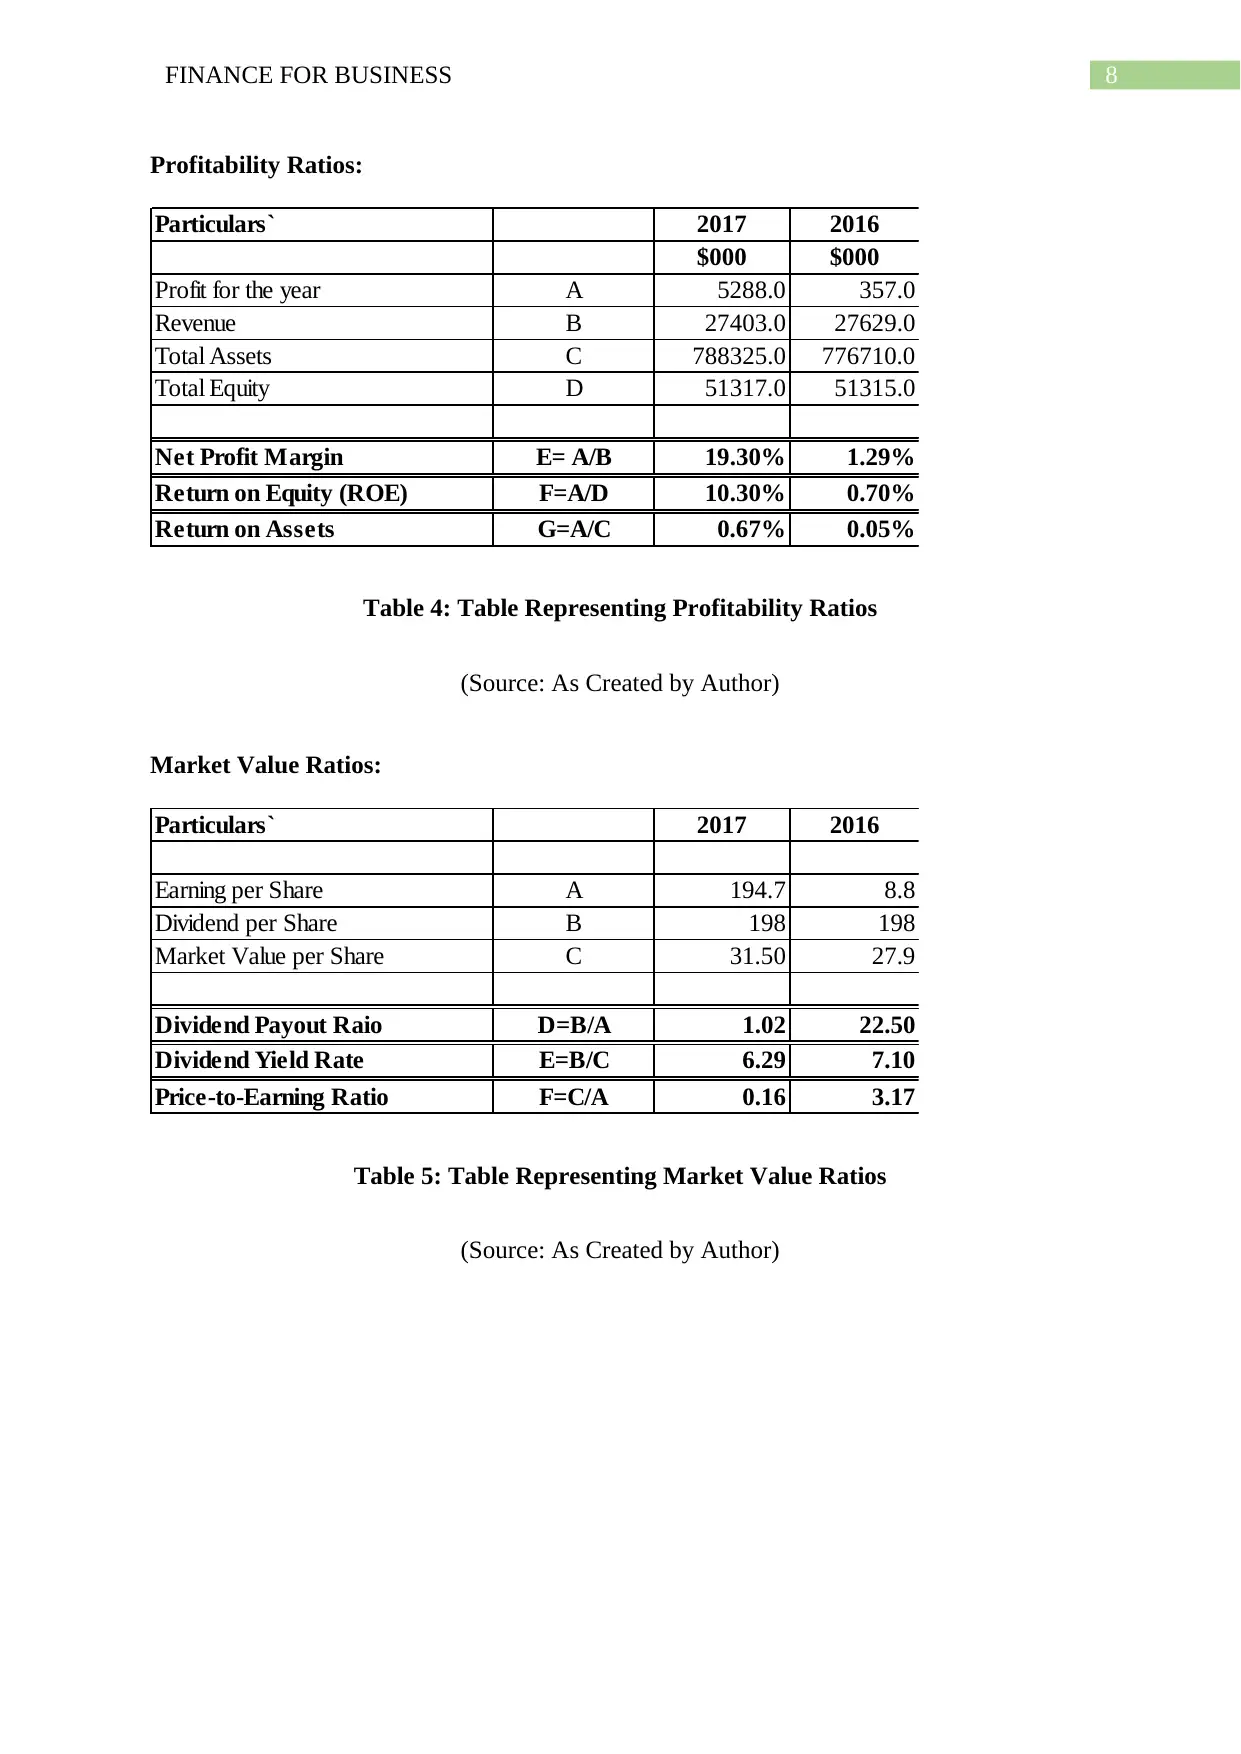
Profitability Ratios:
Particulars` 2017 2016
$000 $000
Profit for the year A 5288.0 357.0
Revenue B 27403.0 27629.0
Total Assets C 788325.0 776710.0
Total Equity D 51317.0 51315.0
Net Profit Margin E= A/B 19.30% 1.29%
Return on Equity (ROE) F=A/D 10.30% 0.70%
Return on Assets G=A/C 0.67% 0.05%
Table 4: Table Representing Profitability Ratios
(Source: As Created by Author)
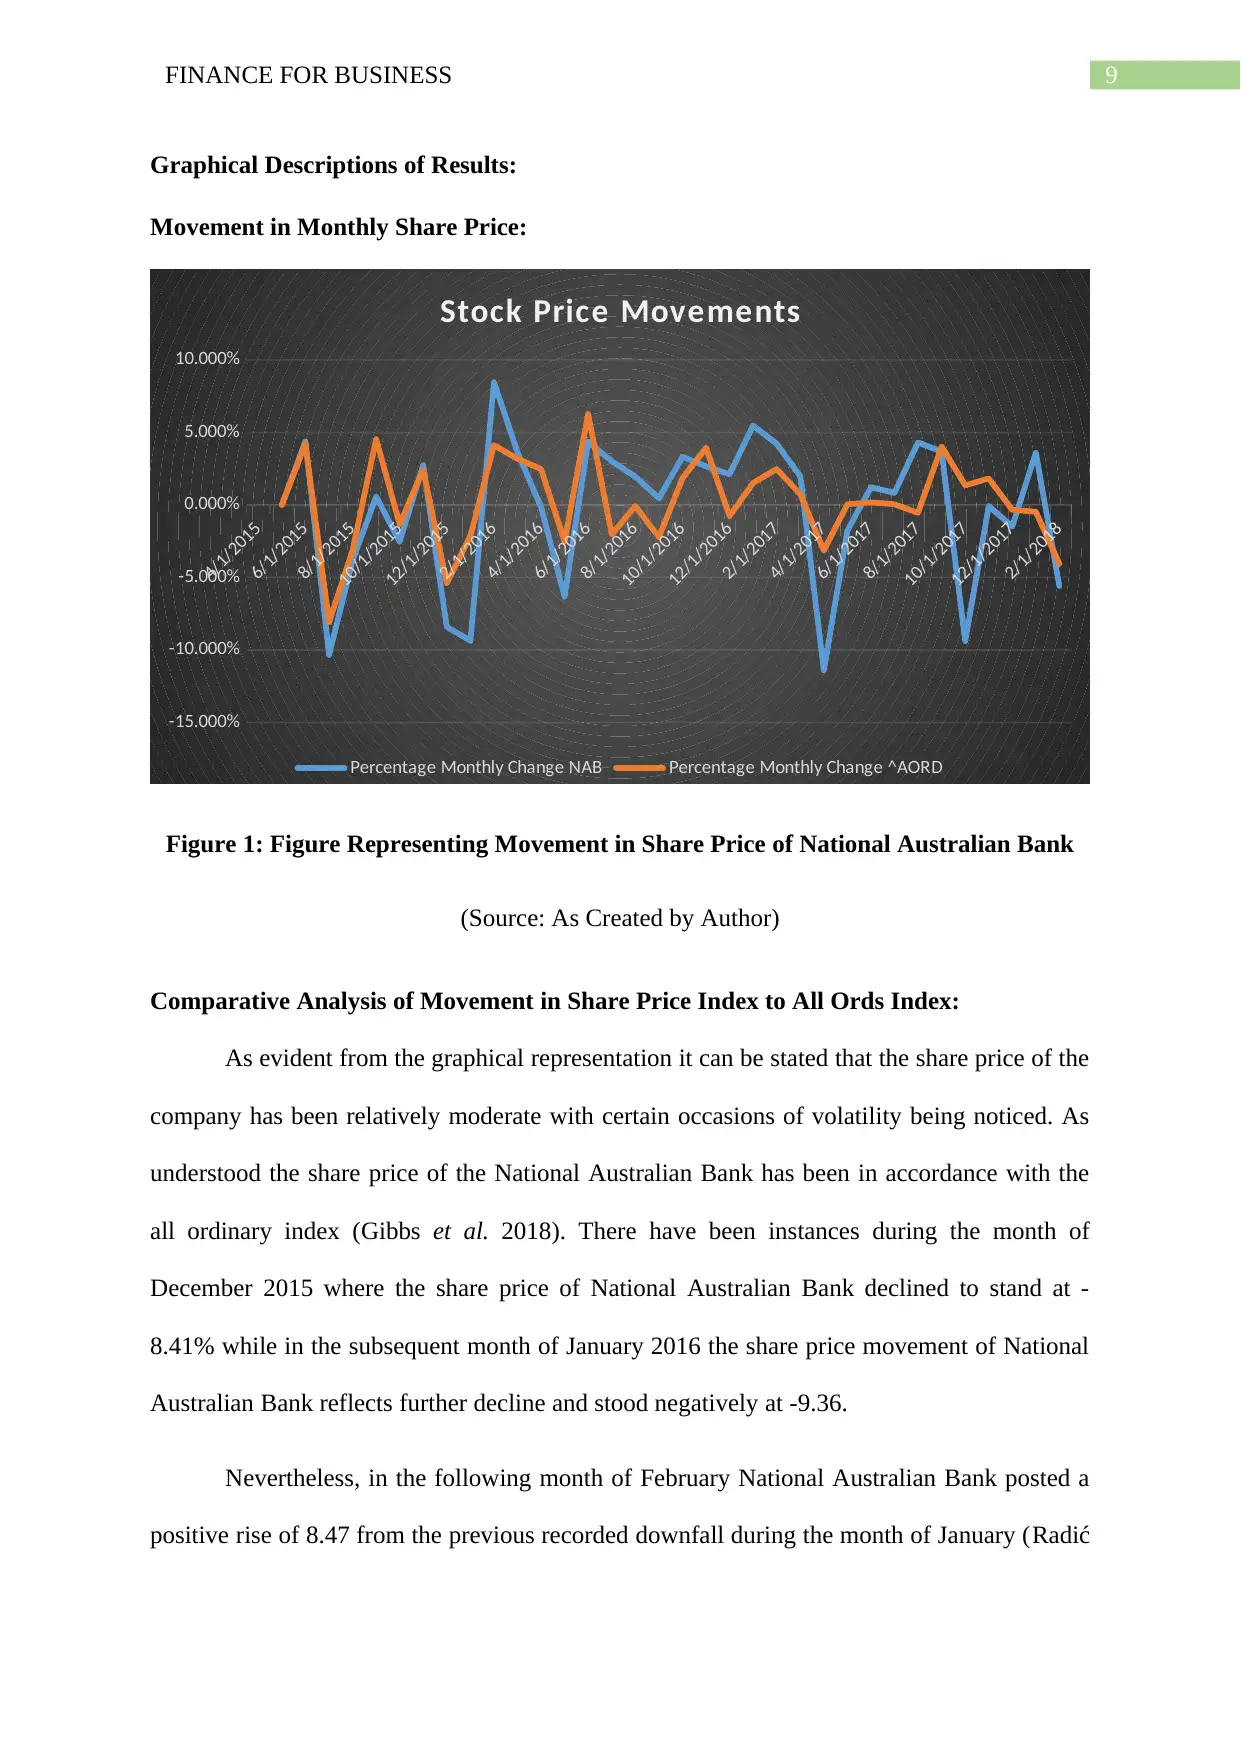
Market Value Ratios:
Particulars` 2017 2016
Earning per Share A 194.7 8.8
Dividend per Share B 198 198
Market Value per Share C 31.50 27.9
Dividend Payout Raio D=B/A 1.02 22.50
Dividend Yield Rate E=B/C 6.29 7.10
Price-to-Earning Ratio F=C/A 0.16 3.17
Table 5: Table Representing Market Value Ratios
(Source: As Created by Author)
Profitability Ratios:
Particulars` 2017 2016
$000 $000
Profit for the year A 5288.0 357.0
Revenue B 27403.0 27629.0
Total Assets C 788325.0 776710.0
Total Equity D 51317.0 51315.0
Net Profit Margin E= A/B 19.30% 1.29%
Return on Equity (ROE) F=A/D 10.30% 0.70%
Return on Assets G=A/C 0.67% 0.05%
Table 4: Table Representing Profitability Ratios
(Source: As Created by Author)
Market Value Ratios:
Particulars` 2017 2016
Earning per Share A 194.7 8.8
Dividend per Share B 198 198
Market Value per Share C 31.50 27.9
Dividend Payout Raio D=B/A 1.02 22.50
Dividend Yield Rate E=B/C 6.29 7.10
Price-to-Earning Ratio F=C/A 0.16 3.17
Table 5: Table Representing Market Value Ratios
(Source: As Created by Author)
⊘ This is a preview!⊘
Do you want full access?
Subscribe today to unlock all pages.
Trusted by 1+ million students worldwide
9FINANCE FOR BUSINESS
Graphical Descriptions of Results:
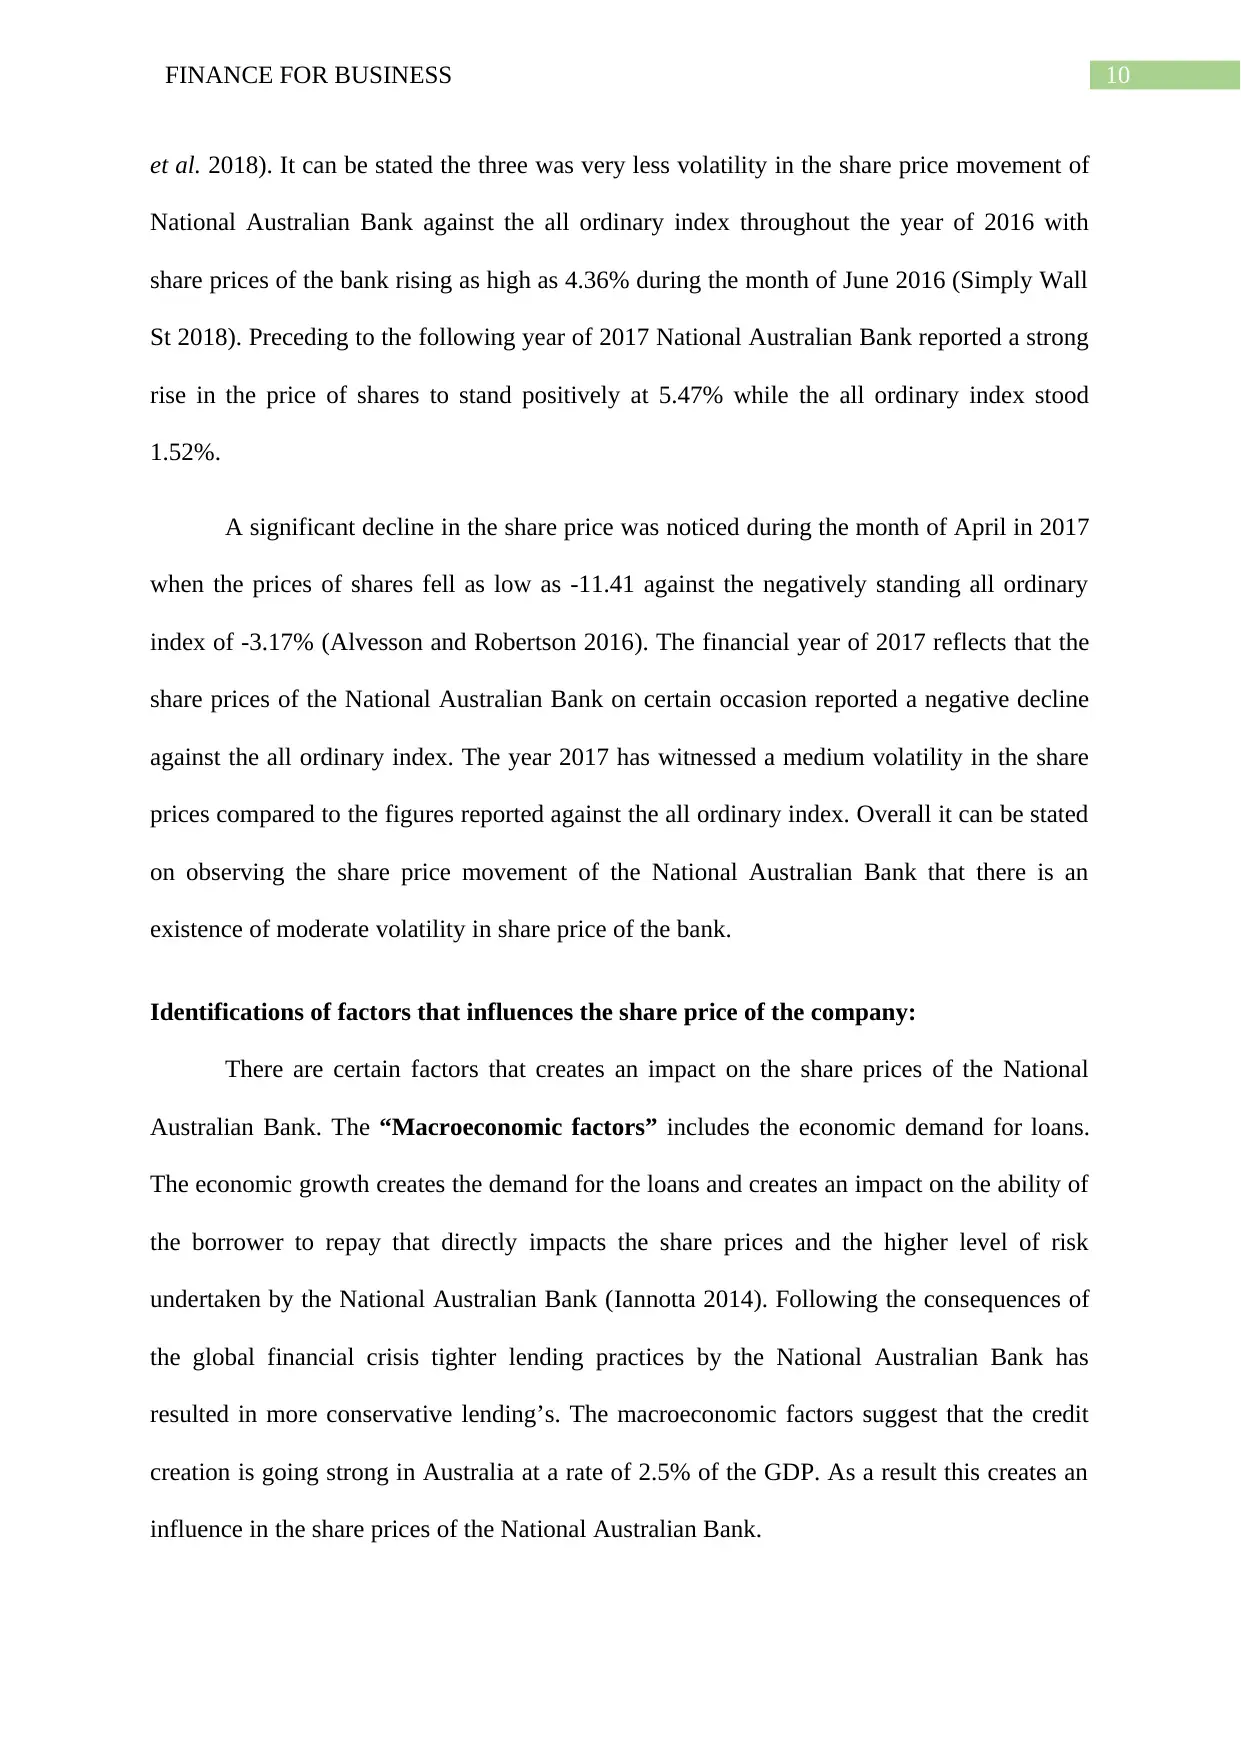
Movement in Monthly Share Price:
4/1/2015
6/1/2015
8/1/2015
10/1/2015
12/1/2015
2/1/2016
4/1/2016
6/1/2016
8/1/2016
10/1/2016
12/1/2016
2/1/2017
4/1/2017
6/1/2017
8/1/2017
10/1/2017
12/1/2017
2/1/2018
-15.000%
-10.000%
-5.000%
0.000%
5.000%
10.000%
Stock Price Movements
Percentage Monthly Change NAB Percentage Monthly Change ^AORD
Figure 1: Figure Representing Movement in Share Price of National Australian Bank
(Source: As Created by Author)
Comparative Analysis of Movement in Share Price Index to All Ords Index:
As evident from the graphical representation it can be stated that the share price of the
company has been relatively moderate with certain occasions of volatility being noticed. As
understood the share price of the National Australian Bank has been in accordance with the
all ordinary index (Gibbs et al. 2018). There have been instances during the month of
December 2015 where the share price of National Australian Bank declined to stand at -
8.41% while in the subsequent month of January 2016 the share price movement of National
Australian Bank reflects further decline and stood negatively at -9.36.
Nevertheless, in the following month of February National Australian Bank posted a
positive rise of 8.47 from the previous recorded downfall during the month of January (Radić
Graphical Descriptions of Results:
Movement in Monthly Share Price:
4/1/2015
6/1/2015
8/1/2015
10/1/2015
12/1/2015
2/1/2016
4/1/2016
6/1/2016
8/1/2016
10/1/2016
12/1/2016
2/1/2017
4/1/2017
6/1/2017
8/1/2017
10/1/2017
12/1/2017
2/1/2018
-15.000%
-10.000%
-5.000%
0.000%
5.000%
10.000%
Stock Price Movements
Percentage Monthly Change NAB Percentage Monthly Change ^AORD
Figure 1: Figure Representing Movement in Share Price of National Australian Bank
(Source: As Created by Author)
Comparative Analysis of Movement in Share Price Index to All Ords Index:
As evident from the graphical representation it can be stated that the share price of the
company has been relatively moderate with certain occasions of volatility being noticed. As
understood the share price of the National Australian Bank has been in accordance with the
all ordinary index (Gibbs et al. 2018). There have been instances during the month of
December 2015 where the share price of National Australian Bank declined to stand at -
8.41% while in the subsequent month of January 2016 the share price movement of National
Australian Bank reflects further decline and stood negatively at -9.36.
Nevertheless, in the following month of February National Australian Bank posted a
positive rise of 8.47 from the previous recorded downfall during the month of January (Radić
Paraphrase This Document
Need a fresh take? Get an instant paraphrase of this document with our AI Paraphraser
10FINANCE FOR BUSINESS
et al. 2018). It can be stated the three was very less volatility in the share price movement of
National Australian Bank against the all ordinary index throughout the year of 2016 with
share prices of the bank rising as high as 4.36% during the month of June 2016 (Simply Wall
St 2018). Preceding to the following year of 2017 National Australian Bank reported a strong
rise in the price of shares to stand positively at 5.47% while the all ordinary index stood
1.52%.
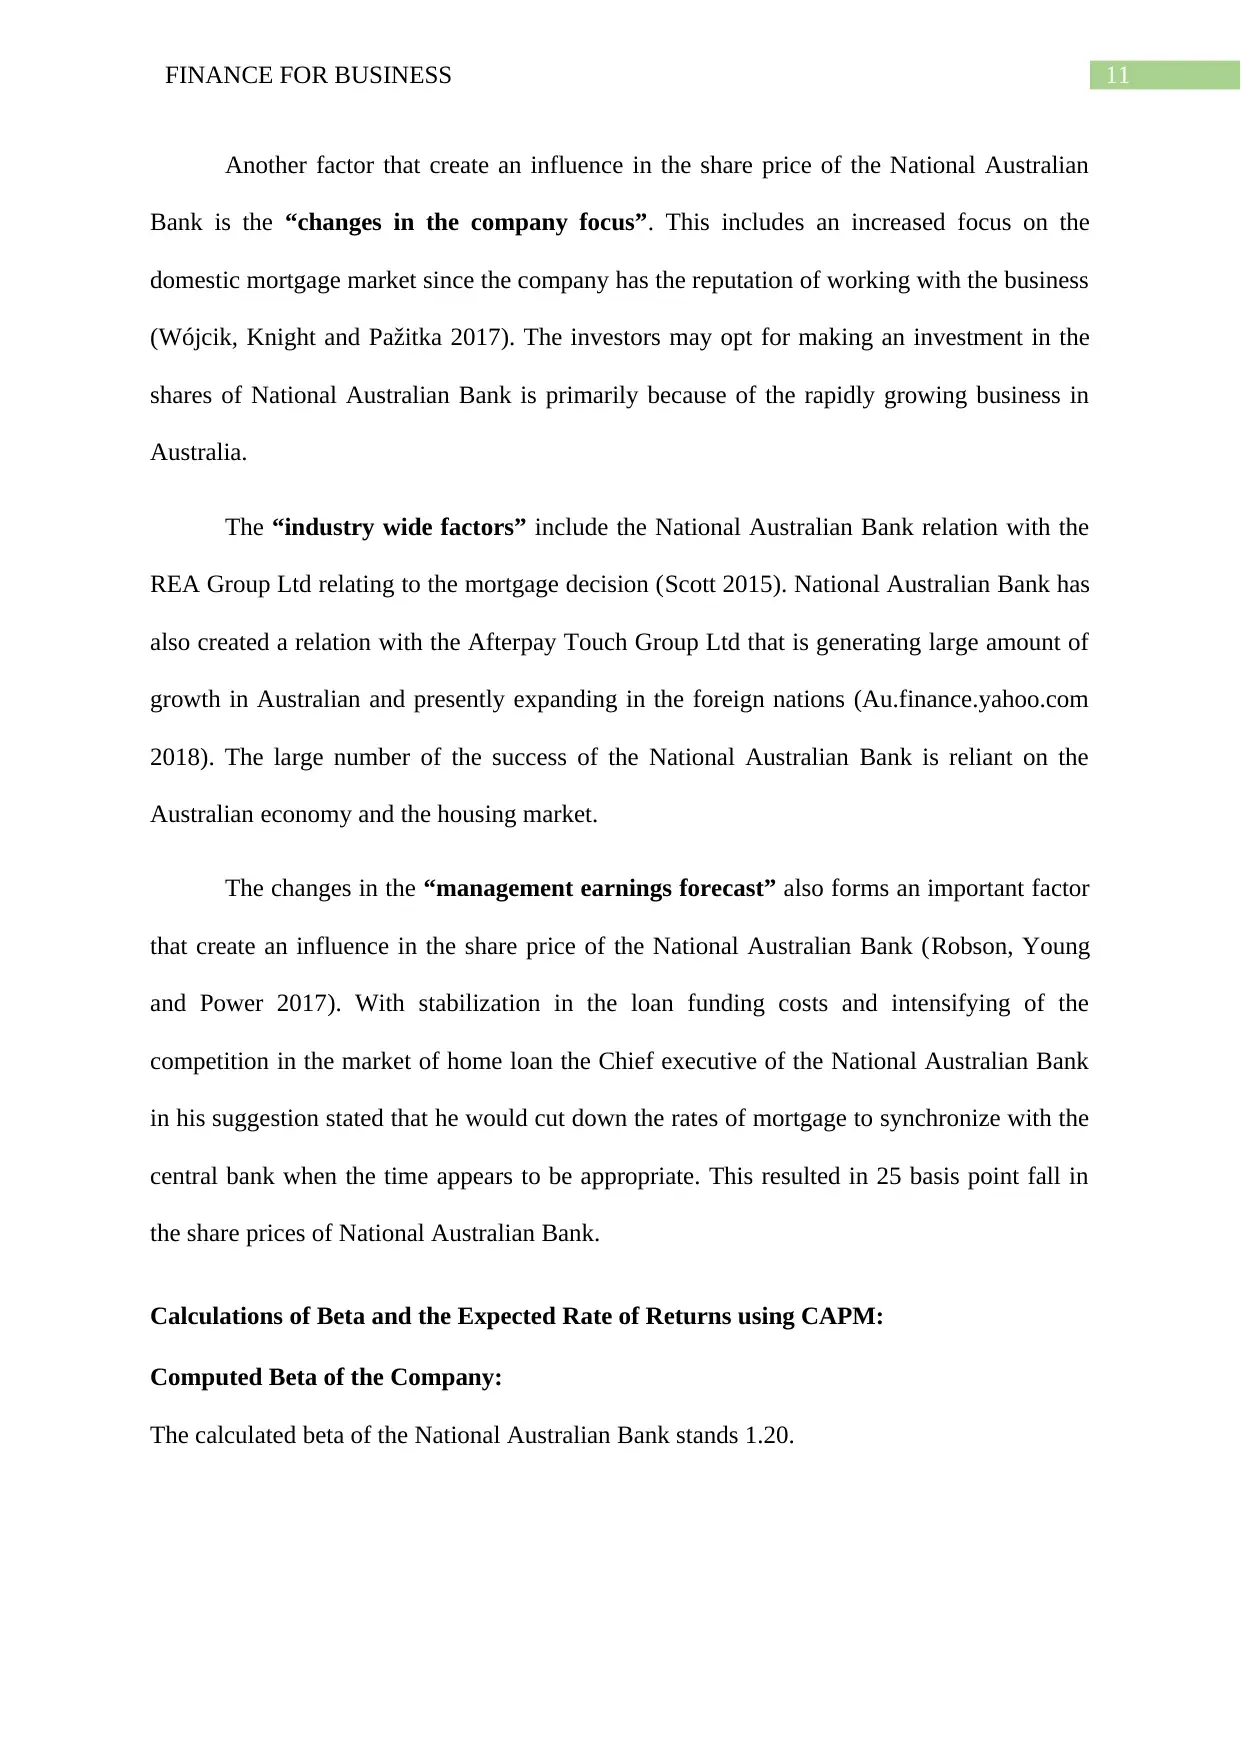
A significant decline in the share price was noticed during the month of April in 2017
when the prices of shares fell as low as -11.41 against the negatively standing all ordinary
index of -3.17% (Alvesson and Robertson 2016). The financial year of 2017 reflects that the
share prices of the National Australian Bank on certain occasion reported a negative decline
against the all ordinary index. The year 2017 has witnessed a medium volatility in the share
prices compared to the figures reported against the all ordinary index. Overall it can be stated
on observing the share price movement of the National Australian Bank that there is an
existence of moderate volatility in share price of the bank.
Identifications of factors that influences the share price of the company:
There are certain factors that creates an impact on the share prices of the National
Australian Bank. The “Macroeconomic factors” includes the economic demand for loans.
The economic growth creates the demand for the loans and creates an impact on the ability of
the borrower to repay that directly impacts the share prices and the higher level of risk
undertaken by the National Australian Bank (Iannotta 2014). Following the consequences of
the global financial crisis tighter lending practices by the National Australian Bank has
resulted in more conservative lending’s. The macroeconomic factors suggest that the credit
creation is going strong in Australia at a rate of 2.5% of the GDP. As a result this creates an
influence in the share prices of the National Australian Bank.
et al. 2018). It can be stated the three was very less volatility in the share price movement of
National Australian Bank against the all ordinary index throughout the year of 2016 with
share prices of the bank rising as high as 4.36% during the month of June 2016 (Simply Wall
St 2018). Preceding to the following year of 2017 National Australian Bank reported a strong
rise in the price of shares to stand positively at 5.47% while the all ordinary index stood
1.52%.
A significant decline in the share price was noticed during the month of April in 2017
when the prices of shares fell as low as -11.41 against the negatively standing all ordinary
index of -3.17% (Alvesson and Robertson 2016). The financial year of 2017 reflects that the
share prices of the National Australian Bank on certain occasion reported a negative decline
against the all ordinary index. The year 2017 has witnessed a medium volatility in the share
prices compared to the figures reported against the all ordinary index. Overall it can be stated
on observing the share price movement of the National Australian Bank that there is an
existence of moderate volatility in share price of the bank.
Identifications of factors that influences the share price of the company:
There are certain factors that creates an impact on the share prices of the National
Australian Bank. The “Macroeconomic factors” includes the economic demand for loans.
The economic growth creates the demand for the loans and creates an impact on the ability of
the borrower to repay that directly impacts the share prices and the higher level of risk
undertaken by the National Australian Bank (Iannotta 2014). Following the consequences of
the global financial crisis tighter lending practices by the National Australian Bank has
resulted in more conservative lending’s. The macroeconomic factors suggest that the credit
creation is going strong in Australia at a rate of 2.5% of the GDP. As a result this creates an
influence in the share prices of the National Australian Bank.
11FINANCE FOR BUSINESS
Another factor that create an influence in the share price of the National Australian
Bank is the “changes in the company focus”. This includes an increased focus on the
domestic mortgage market since the company has the reputation of working with the business
(Wójcik, Knight and Pažitka 2017). The investors may opt for making an investment in the
shares of National Australian Bank is primarily because of the rapidly growing business in
Australia.
The “industry wide factors” include the National Australian Bank relation with the
REA Group Ltd relating to the mortgage decision (Scott 2015). National Australian Bank has
also created a relation with the Afterpay Touch Group Ltd that is generating large amount of
growth in Australian and presently expanding in the foreign nations (Au.finance.yahoo.com
2018). The large number of the success of the National Australian Bank is reliant on the
Australian economy and the housing market.
The changes in the “management earnings forecast” also forms an important factor
that create an influence in the share price of the National Australian Bank (Robson, Young
and Power 2017). With stabilization in the loan funding costs and intensifying of the
competition in the market of home loan the Chief executive of the National Australian Bank
in his suggestion stated that he would cut down the rates of mortgage to synchronize with the
central bank when the time appears to be appropriate. This resulted in 25 basis point fall in
the share prices of National Australian Bank.
Calculations of Beta and the Expected Rate of Returns using CAPM:
Computed Beta of the Company:
The calculated beta of the National Australian Bank stands 1.20.
⊘ This is a preview!⊘
Do you want full access?
Subscribe today to unlock all pages.
Trusted by 1+ million students worldwide
1 out of 20
Related Documents


Your All-in-One AI-Powered Toolkit for Academic Success.
+13062052269
info@desklib.com
Available 24*7 on WhatsApp / Email
![[object Object]](/_next/static/media/star-bottom.7253800d.svg)
Unlock your academic potential
Copyright © 2020–2026 A2Z Services. All Rights Reserved. Developed and managed by ZUCOL.