Financial Performance Analysis of National Australian Bank (NAB)
VerifiedAdded on  2021/06/14
|27
|4314
|35
Report
AI Summary
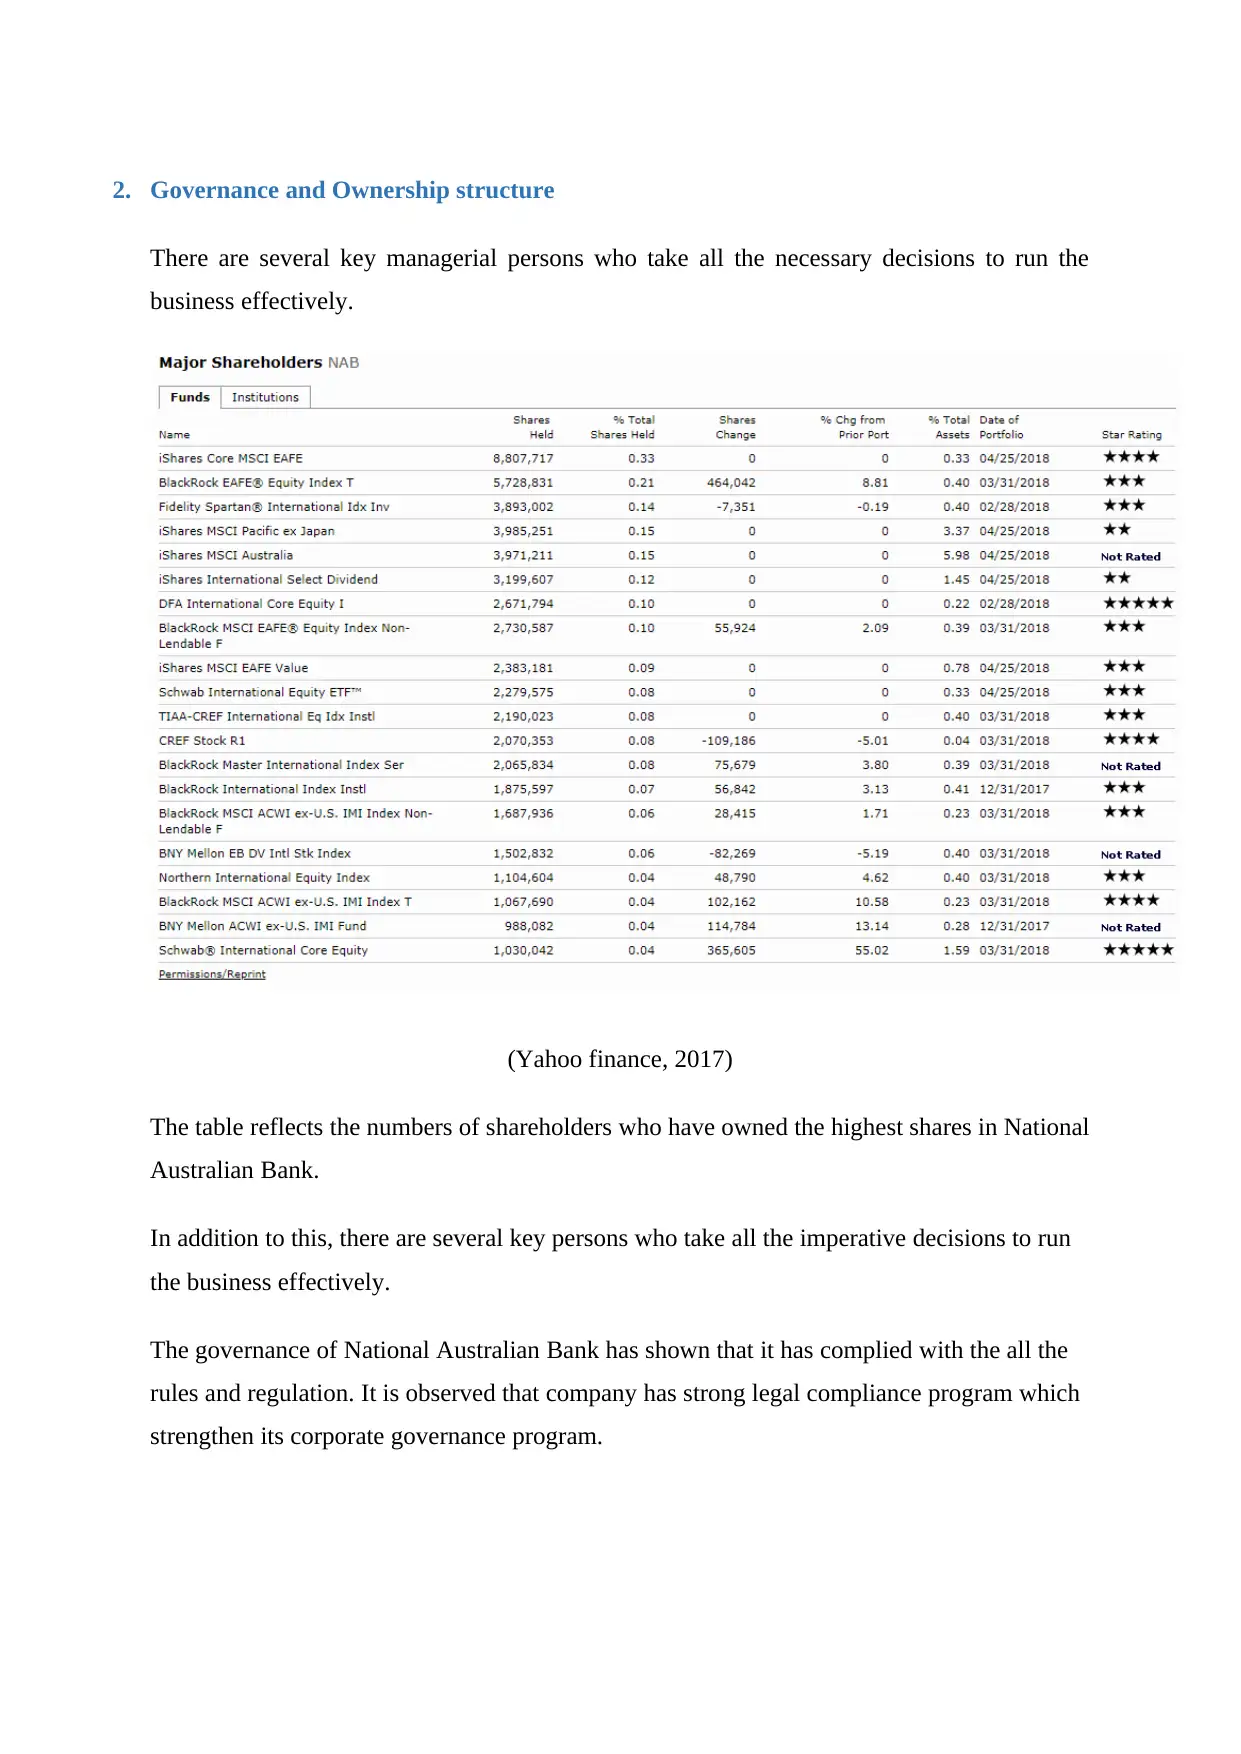
This report presents a comprehensive financial analysis of the National Australian Bank (NAB). It begins with an overview of NAB, its governance, and ownership structure. The core of the report focuses on performance ratio analysis, including liquidity, solvency, and profitability ratios, utilizing data from 2016 and 2017. The report also examines the company's share price movements, comparing them to the broader market and discussing factors impacting the share price. Furthermore, it delves into announcements affecting NAB's performance, beta calculation, and the application of the Capital Asset Pricing Model (CAPM) to determine the required rate of return. The investment method employed by NAB is discussed, along with the calculation of the Weighted Average Cost of Capital (WACC) and its implications. The report also analyzes the company's debt and dividend policies, culminating in a letter of recommendation and concluding remarks. The analysis provides insights into NAB's financial health, investment strategies, and overall performance.

Name of the student
Topic- Financial Management analysis of NAB
University name
Topic- Financial Management analysis of NAB
University name
Paraphrase This Document
Need a fresh take? Get an instant paraphrase of this document with our AI Paraphraser

Business Financial analysis of National Australian Bank
2
Table of Contents
Introduction...........................................................................................................................................3
1.Description of National Australian Bank.........................................................................................3
2.Governance and Ownership structure................................................................................................4
3.Performance ratio analysis of National Australian Bank.....................................................................4
4.The share price graph reflecting movement in the share price of National Australian Bank..............7
4.1 Graph reflecting the movement in the share price of National Australian Bank.............................7
4.2 Comparison between movement in the share price of National Australian Bank and share price
return of the all ordinary stock exchange..............................................................................................7
5.Announcements.................................................................................................................................7
6.Research via internet..........................................................................................................................8
6.2 Computation of required rate of return by using CAPM method................................................8
6.3 Determining the investment method (Conservative investment)...............................................9
7.Weighted average Cost of Capital.......................................................................................................9
7.1Computing cost of Equity using CAPM method............................................................................9
7.2 Implications that a higher WACC on investment decision.........................................................10
8.Debt ratio consideration of National Australian Bank......................................................................10
8.1 Stable Debt to equity ratio of the company...................................................................................10
8.2 Gearing ratio discussion.............................................................................................................10
9.Divided policies of the company.......................................................................................................11
10.Letter of recommendation..............................................................................................................11
11.Conclusion......................................................................................................................................12
12.References......................................................................................................................................13
13.Appendix.........................................................................................................................................14

Business Financial analysis of National Australian Bank
3
Introduction
In this report, financial management analysis tools have been used to analysis the
business. It is observed that there are several financial tools such as ratio analysis, capital
structure analysis, and capital budgeting analysis top down analysis. In this report, National
Australian Bank Company has been taken to prepare this report. This report emphasises
upon the financial performance, weighted average cost of capital, share price analysis,
dividend policy and letter of recommendation which could be used by investors to make the
effective financial decisions.
1. Description of National Australian Bank
National Australian Bank is Australian Bank which is one of the four biggest financial banks
in Australia. This Bank is the four largest Banks in terms of the capitalization, revenue and
profitability. This company has gained momentum in market by providing effective banking
service in Australian Market.
The Current CEO of Company is Andrew who takes all the necessary steps to run the
business effectively (National Australian Bank).
⊘ This is a preview!⊘
Do you want full access?
Subscribe today to unlock all pages.

Trusted by 1+ million students worldwide

2. Governance and Ownership structure
There are several key managerial persons who take all the necessary decisions to run the
business effectively.
(Yahoo finance, 2017)
The table reflects the numbers of shareholders who have owned the highest shares in National
Australian Bank.
In addition to this, there are several key persons who take all the imperative decisions to run
the business effectively.
The governance of National Australian Bank has shown that it has complied with the all the
rules and regulation. It is observed that company has strong legal compliance program which
strengthen its corporate governance program.
Paraphrase This Document
Need a fresh take? Get an instant paraphrase of this document with our AI Paraphraser

Business Financial analysis of National Australian Bank
5
(Yahoo finance, 2017)
3. Performance ratio analysis of National Australian Bank
This ratio analysis is used to analysis the relation between two financial factors which
divulges the profitability and capital structure of company.
Details of the imperative information of National Australian Bank
National Australian Bank
Particulars (Amount in Million 2016 2017
AUD$
EBIT 27,629 27,403
Interest 14,699 14,221
Net profit 21,666 17,730
Total Assets 7,77,622 7,88,325

Total Liabilities 7,26,307 7,37,008
Shareholders' Equity 51,292 51,306
This above given details reflects the key financial items which National Australian
Bank has reflected in the financial statement. The shareholder equity of company has been changed
with the slight %.
Short term solvency ratio
1. Current ratio
The current ratio of National Australian Bank has increased to 1.2 points in 2017 which
shows that it has increased its investment in current assets to increase the productivity.
Liquidity ratio Years
2017 2016
Current ratio 1.2 .89
Quick ratio .92 .57
. Quick ratio has also shown the slight changes as National Australian Bank does not
have any capital investment in inventories
Note- current ratio has been considered on the basis of deposits otherwise it will be kept
zero (National Australian Bank. 2015).
⊘ This is a preview!⊘
Do you want full access?
Subscribe today to unlock all pages.

Trusted by 1+ million students worldwide

Business Financial analysis of National Australian Bank
7
Proving the equation
Providing equation 2014 2015 2016 2017
Net profit After tax/OE 0.55154
0.47597938
5 0.42241 0.34557
EBIT/TA*NPAT/EBIT*TA/OE 0.55154
0.47597938
5 0.42241 0.34557
Long term Solvency ratios
Debt to equity of the company
3. Debt Ratio
2016 2017
A. Total
Liabilities 7,26,307 737008
B.
Total
assets
7,77,622 7,88,325.00
(A/B) 93% 93%
Interpretation
The Debt to equity of the company has shown the relation between the total debts and equity
of company. It divulges partition of the debt and equity in the capital of company.
The debt portion in the National Australian Bank is very high which shows the high financial
leverage. This will also reduce the overall cost of capital of company. It is evaluated that
company has reduced its debt to equity ratio to 93% which is 2% lower as compared to last
Paraphrase This Document
Need a fresh take? Get an instant paraphrase of this document with our AI Paraphraser

four year data (National Australian Bank. 2015). Company needs to lower down its financial
leverage if it wants to create value on its investment (Collier, 2015).
The share price graph reflecting movement
Gearing ratio discussion
The gearing ratio of company is too high as it has been earning good amount of
investment in its business.
Gearing Ratio
2016 2017
Gearin
g Ratio 53% 52%
Asset utilization
1. Inventory turnover ratio
National Australian Bank does not have inventory in its operations so kept zero.
Efficiency ratio Years
2017 2016
Inventory turnover ratio 0 0
Asset turnover ratio .82 .86
Receivable turnover ratio 16.5 17.1
Days' sales in inventory 2.1 2.2
Days' sales in receivables 24 23
Asset turnover ratio
It has asset turnover ratio of .86 which shows good amount of increment in its business.
2. Debtor turnover ratio
It shows that company has good amount of efficiency to deploy its funds in its business.

Business Financial analysis of National Australian Bank
9
9
⊘ This is a preview!⊘
Do you want full access?
Subscribe today to unlock all pages.

Trusted by 1+ million students worldwide

Profitability ratios
Paraphrase This Document
Need a fresh take? Get an instant paraphrase of this document with our AI Paraphraser

Business Financial analysis of National Australian Bank
11
Return on Equity of Company
1. The rate of Return on
Assets
2016 2017
A.
Net
income
(AUD $
in
Million)
21,666 17,730
B.
Total
assets
(AUD $
in
Million)
7,77,622 7,88,325
(A
/B) 3% 2%
Interpretation of the data
The above given data has been fetched from the annual report of company. It has been
analyzed that the net return on assets of company has gone down to 2% in 2017 which is .99
lower as compared to last two year data shown. It is considered that company has lower down
its profitability which has eventually resulted to the reduction in its overall return on capital
employed.

Return on equity of the company
2. The rate of Return on
Equity
2016 2017
A. Net
income
available to
equity
shareholders.
21,666 17,730
B.
Shareholder’
s Equity
51,292 51,306.00
(A/B) 42.24% 34.56%
Interpretation
The return on equity of company has shown that dividend or earning available to equity
shareholders. It is observed that return on equity of company has increased to 34.56% As
compared to last year
Market value ratios
1. Earnings per share
Company has good amount of earning in its business.
Market Value ratios Years
2017 2016
Earnings per share - 2.80 - 7.40
P/E ratio - -
Dividend pay-out
ratio - -
.
Price to earnings ratio
⊘ This is a preview!⊘
Do you want full access?
Subscribe today to unlock all pages.

Trusted by 1+ million students worldwide
1 out of 27
Related Documents
Your All-in-One AI-Powered Toolkit for Academic Success.
 +13062052269
info@desklib.com
Available 24*7 on WhatsApp / Email
Unlock your academic potential
Copyright © 2020–2025 A2Z Services. All Rights Reserved. Developed and managed by ZUCOL.


