Comprehensive Financial Report: NCTH's Performance and Stock Analysis
VerifiedAdded on 2021/06/14
|17
|2686
|42
Report
AI Summary
This report presents a financial analysis of the National Corporation for Tourism & Hotels (NCTH), an Abu Dhabi-listed company. The analysis begins with a company profile, detailing its operations in the hospitality sector, including its investments in hotels and leisure complexes, and its key competitors. The report then delves into the financial performance of NCTH, examining key ratios such as Earnings Per Share (EPS), Price-Earnings (P/E) ratio, Dividend Yield, Return on Assets (ROA), and Return on Equity (ROE) over a three-year period. A comparative analysis with competitors like Abu Dhabi National Hotels and Hyatt Hotels Corp is included. The report highlights a decrease in EPS and ROA/ROE for NCTH, coupled with an increase in P/E ratio. The report also provides recommendations based on the financial performance and stock analysis, concluding with an overall assessment of NCTH's profitability and stock performance, including a recommendation against buying the stock due to negative beta and declining financial metrics.
RUNNING HEAD: FINANCE
financial analysis
financial analysis
Paraphrase This Document
Need a fresh take? Get an instant paraphrase of this document with our AI Paraphraser
Finance 1
Contents
Brief Summary............................................................................................................................................2
Company Profile..........................................................................................................................................2
Opinions and Recommendations.................................................................................................................6
Financial performance of NCTH.............................................................................................................6
NCTH’s Profitability position.................................................................................................................8
Stock performance of NCTH...................................................................................................................8
References.................................................................................................................................................11
Bibliography..............................................................................................................................................13
Appendix...................................................................................................................................................14
Finance 2
Brief Summary
The report contains a brief analysis of the Abu Dhabi listed company National Corporation for
Tourism & Hotels. The first part of the report includes company profile which provides detail
about NCTH such as its headquarter location, size of the firm, key competitors and many more.
The second part of the report deals with the recommendations given on the financial performance
and stock analysis of NCTH, illustrated with the help of graphs and calculated ratios.
Company Profile
1. The headquarters of National Corporation for Tourism & Hotels are situated in Abu
Dhabi, United Arab Emirates (Ncth.com. 2018).
2. Chief Executive Officer - Mohamed Ahmed Arafah Mounib
Chief Financial Officer - Mr. Hany Farag
3. The company was founded in 1996 and is a UAE based corporation (Ncth.com. 2018).
4. It is listed on Abu Dhabi Securities Exchange and is traded with a ticker symbol of
XADS: NCTH.
5. NCTH basically deals with making investment in hotels and leisure complexes. The
company operates in Abu Dhabi and provides many services such as retail, catering
services and holding segments. It also has fully owned five-star hotels which include
Danat Jebel Dhanna Resort and many others. The company also serves many hotel
management companies by offering them asset management services, catering facilities
and owner representation services. However, the primary business line of the
corporation relates to travel and tourism only (Ncth.com. 2018).
6. The size of the firm includes its total assets, total sales and number of employees
working in the organization. According to the annual report of 2017, NCTH’s total
⊘ This is a preview!⊘
Do you want full access?
Subscribe today to unlock all pages.
Trusted by 1+ million students worldwide
Finance 3
assets are AED 2,116,220,871 million which was way more than the assets reported in
2016. The sales reported for the same year AED 727,899,294 million though reduced as
compare to 2016. The number of employees working are 50 in the organization
(Zawya.com. 2018).
7. Other companies operating in hospitality sector of Abu Dhabi are Abu Dhabi National
Hotels (ADNH) and Hyatt Capital Gate, part of Hyatt Hotels Corporation give tough
competition to National Corporation for Tourism & Hotels.
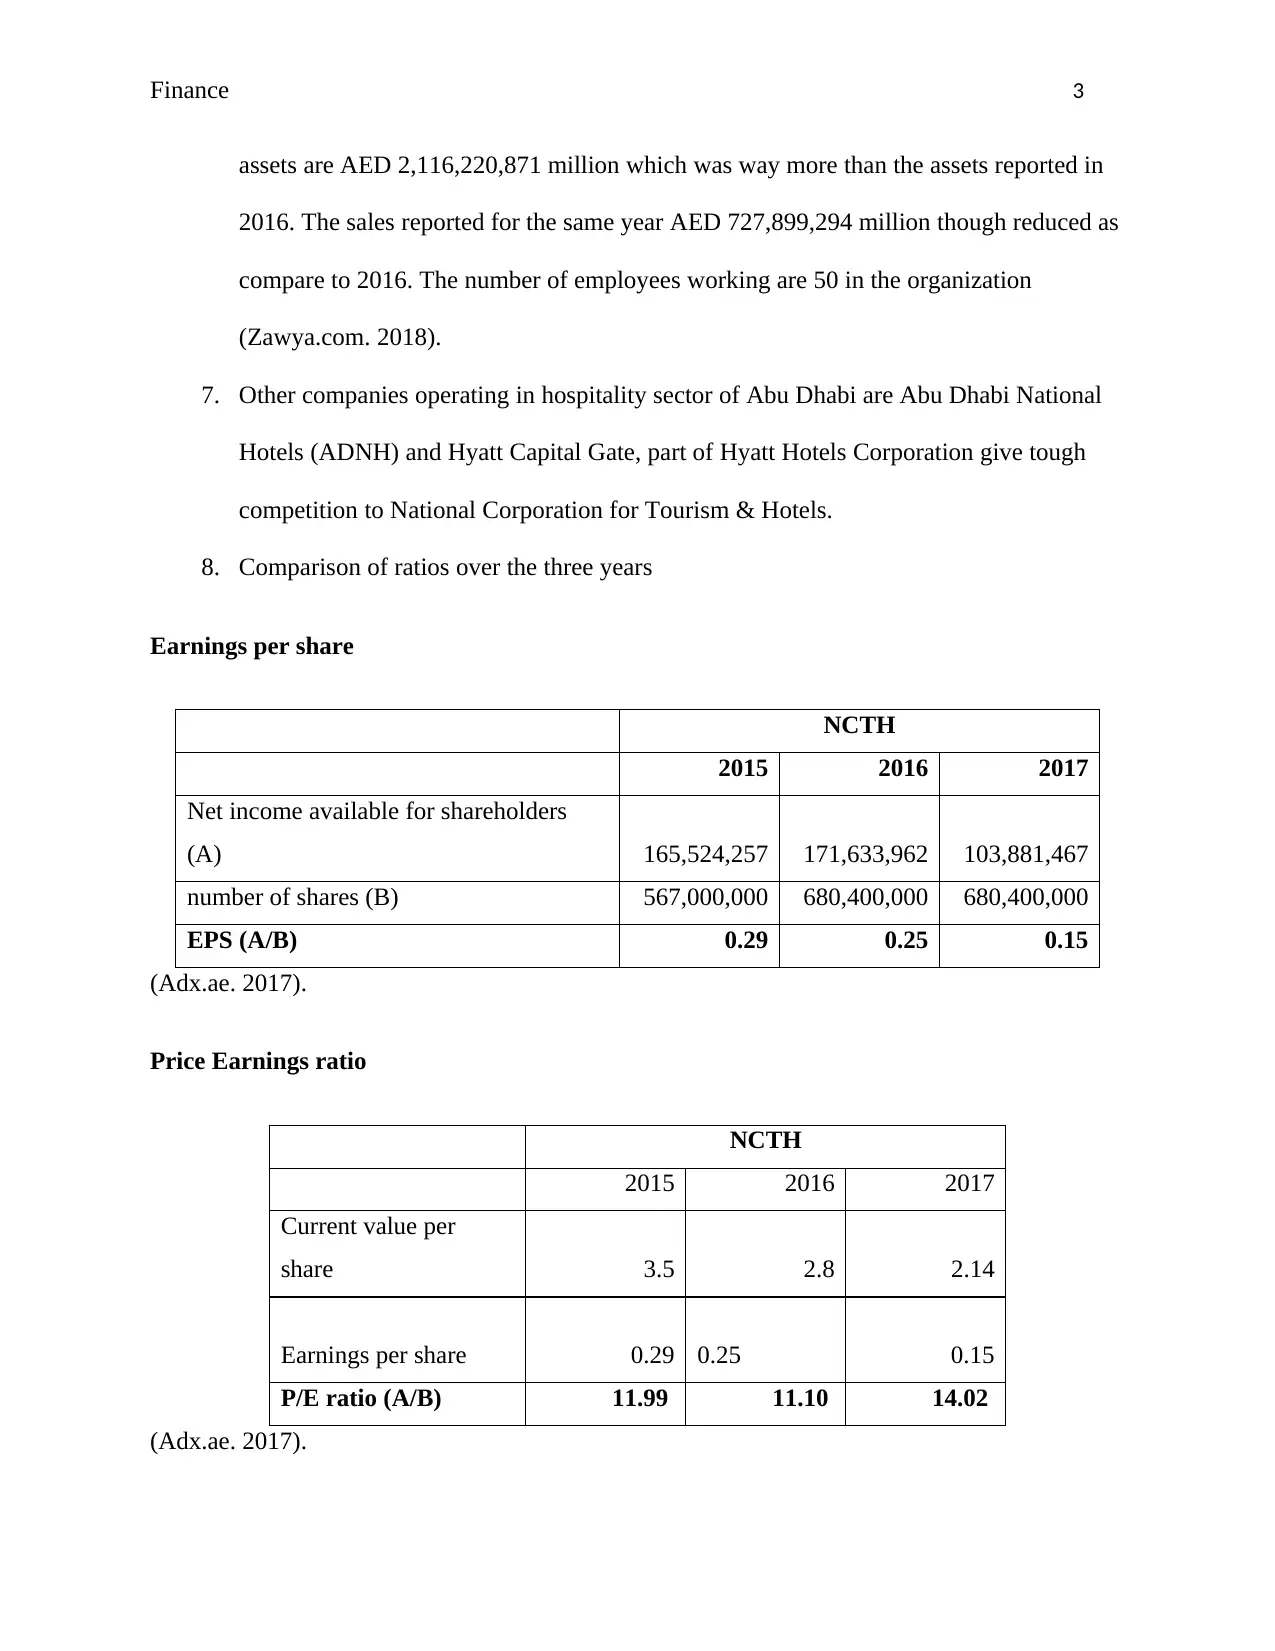
8. Comparison of ratios over the three years
Earnings per share
NCTH
2015 2016 2017
Net income available for shareholders
(A) 165,524,257 171,633,962 103,881,467
number of shares (B) 567,000,000 680,400,000 680,400,000
EPS (A/B) 0.29 0.25 0.15
(Adx.ae. 2017).
Price Earnings ratio
NCTH
2015 2016 2017
Current value per
share 3.5 2.8 2.14
Earnings per share 0.29 0.25 0.15
P/E ratio (A/B) 11.99 11.10 14.02
(Adx.ae. 2017).
assets are AED 2,116,220,871 million which was way more than the assets reported in
2016. The sales reported for the same year AED 727,899,294 million though reduced as
compare to 2016. The number of employees working are 50 in the organization
(Zawya.com. 2018).
7. Other companies operating in hospitality sector of Abu Dhabi are Abu Dhabi National
Hotels (ADNH) and Hyatt Capital Gate, part of Hyatt Hotels Corporation give tough
competition to National Corporation for Tourism & Hotels.
8. Comparison of ratios over the three years
Earnings per share
NCTH
2015 2016 2017
Net income available for shareholders
(A) 165,524,257 171,633,962 103,881,467
number of shares (B) 567,000,000 680,400,000 680,400,000
EPS (A/B) 0.29 0.25 0.15
(Adx.ae. 2017).
Price Earnings ratio
NCTH
2015 2016 2017
Current value per
share 3.5 2.8 2.14
Earnings per share 0.29 0.25 0.15
P/E ratio (A/B) 11.99 11.10 14.02
(Adx.ae. 2017).
Paraphrase This Document
Need a fresh take? Get an instant paraphrase of this document with our AI Paraphraser
Finance 4
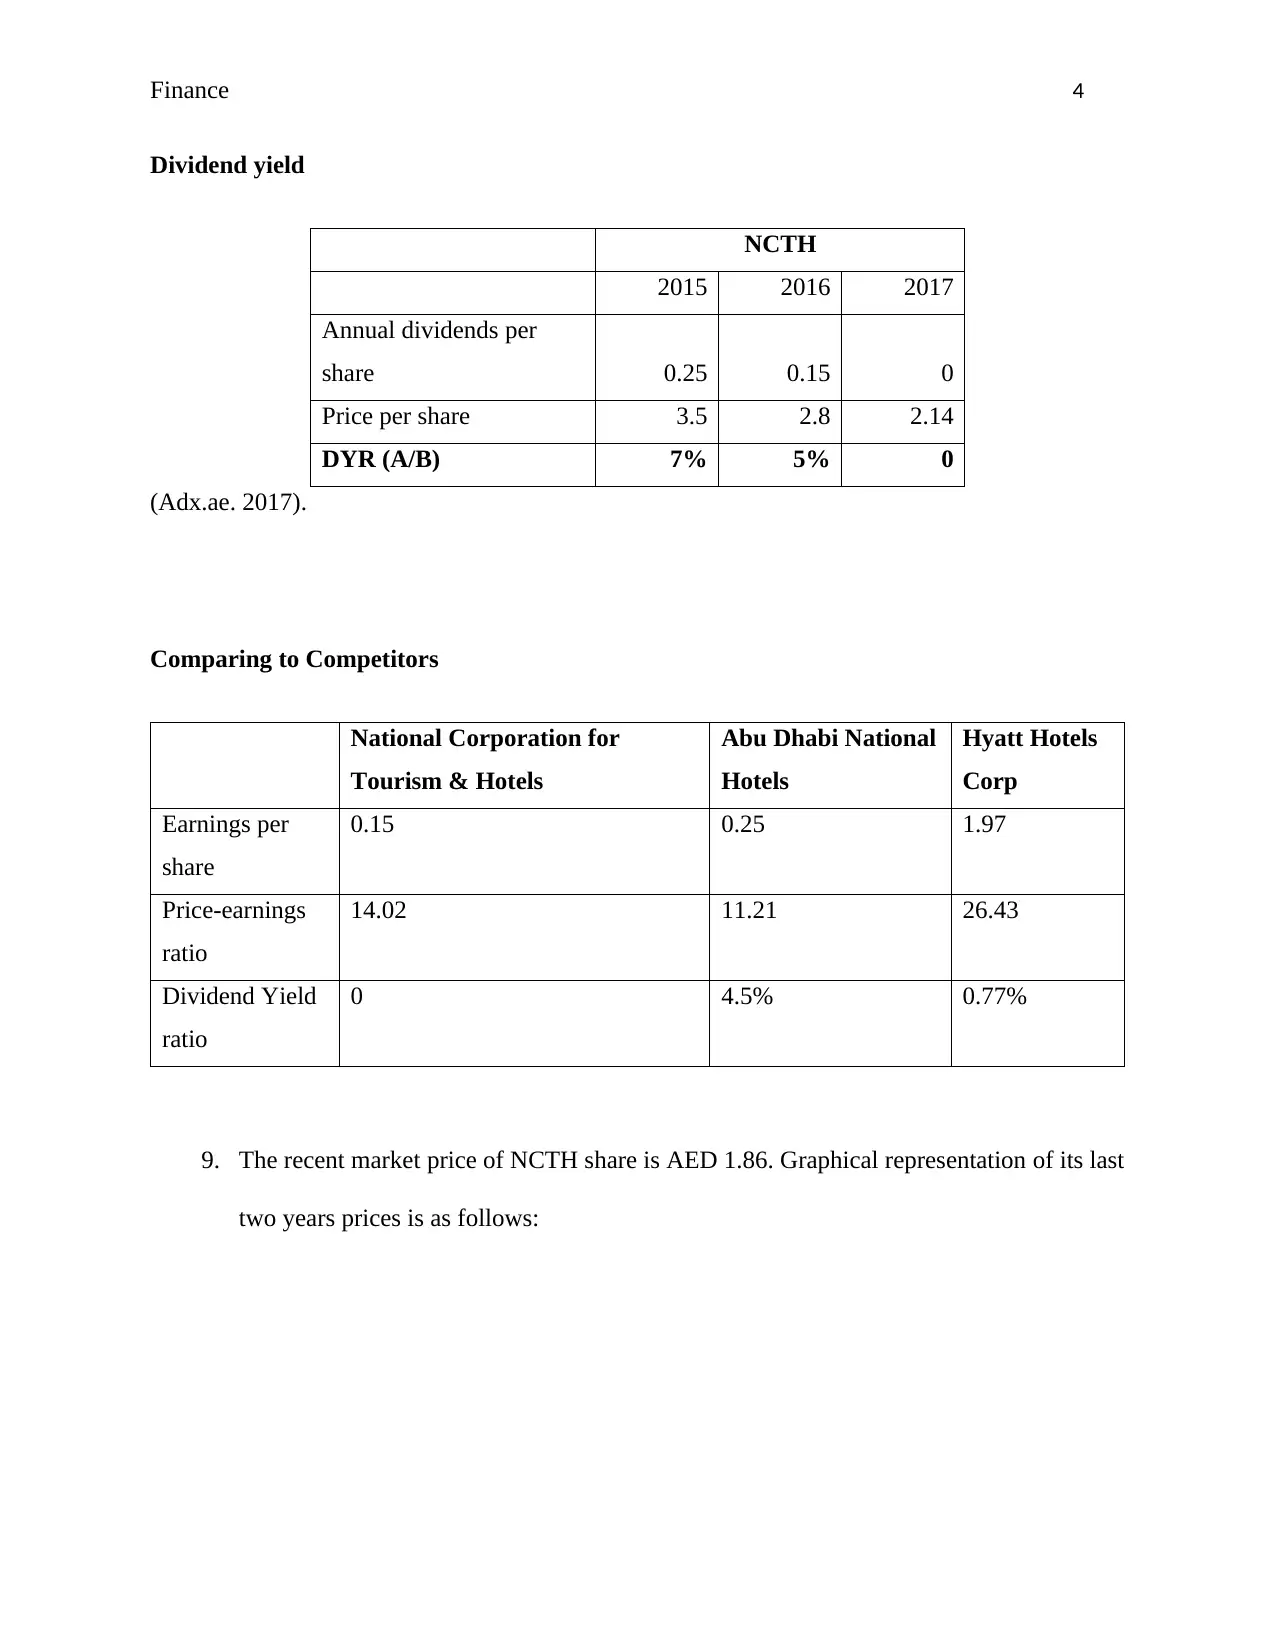
Dividend yield
NCTH
2015 2016 2017
Annual dividends per
share 0.25 0.15 0
Price per share 3.5 2.8 2.14
DYR (A/B) 7% 5% 0
(Adx.ae. 2017).
Comparing to Competitors
National Corporation for
Tourism & Hotels
Abu Dhabi National
Hotels
Hyatt Hotels
Corp
Earnings per
share
0.15 0.25 1.97
Price-earnings
ratio
14.02 11.21 26.43
Dividend Yield
ratio
0 4.5% 0.77%
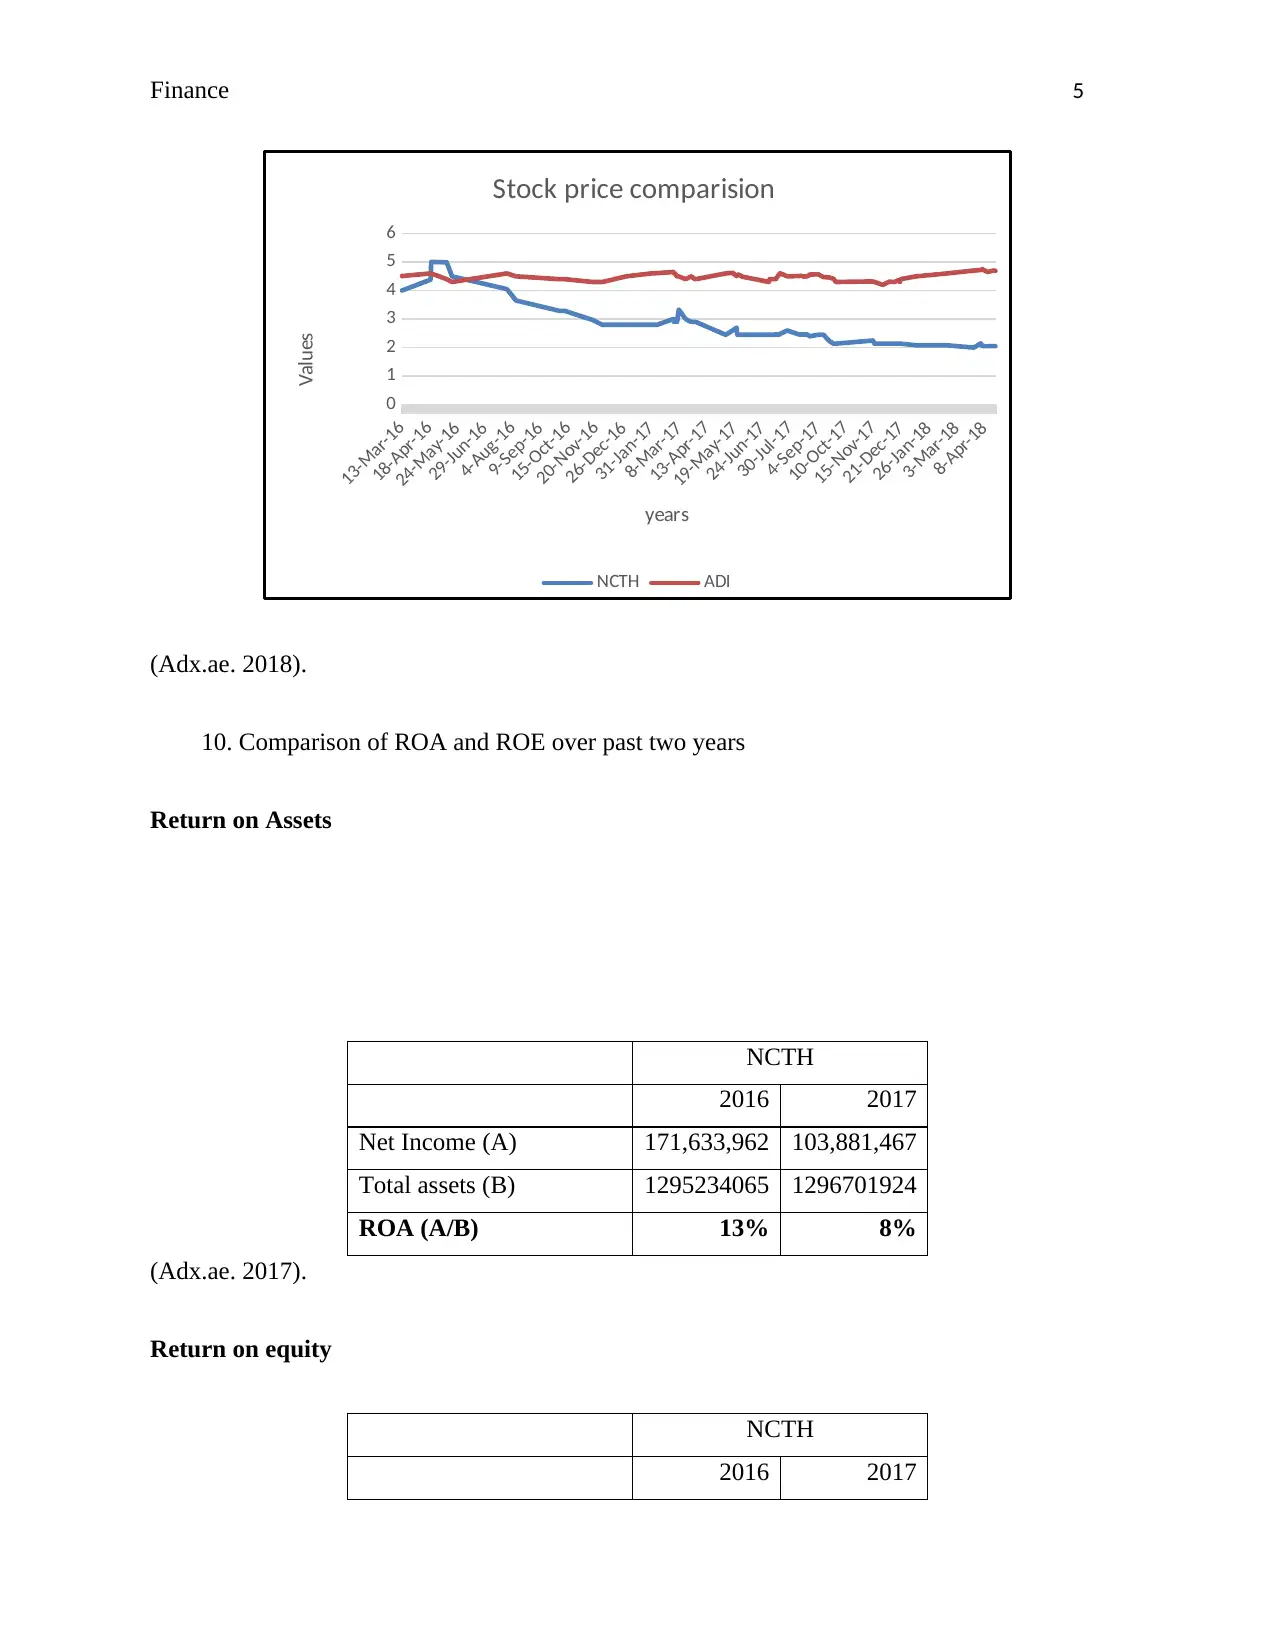
9. The recent market price of NCTH share is AED 1.86. Graphical representation of its last
two years prices is as follows:
Dividend yield
NCTH
2015 2016 2017
Annual dividends per
share 0.25 0.15 0
Price per share 3.5 2.8 2.14
DYR (A/B) 7% 5% 0
(Adx.ae. 2017).
Comparing to Competitors
National Corporation for
Tourism & Hotels
Abu Dhabi National
Hotels
Hyatt Hotels
Corp
Earnings per
share
0.15 0.25 1.97
Price-earnings
ratio
14.02 11.21 26.43
Dividend Yield
ratio
0 4.5% 0.77%
9. The recent market price of NCTH share is AED 1.86. Graphical representation of its last
two years prices is as follows:
Finance 5
13-Mar-16
18-Apr-16
24-May-16
29-Jun-16
4-Aug-16
9-Sep-16
15-Oct-16
20-Nov-16
26-Dec-16
31-Jan-17
8-Mar-17
13-Apr-17
19-May-17
24-Jun-17
30-Jul-17
4-Sep-17
10-Oct-17
15-Nov-17
21-Dec-17
26-Jan-18
3-Mar-18
8-Apr-18
0
1
2
3
4
5
6
Stock price comparision
NCTH ADI
years
Values
(Adx.ae. 2018).
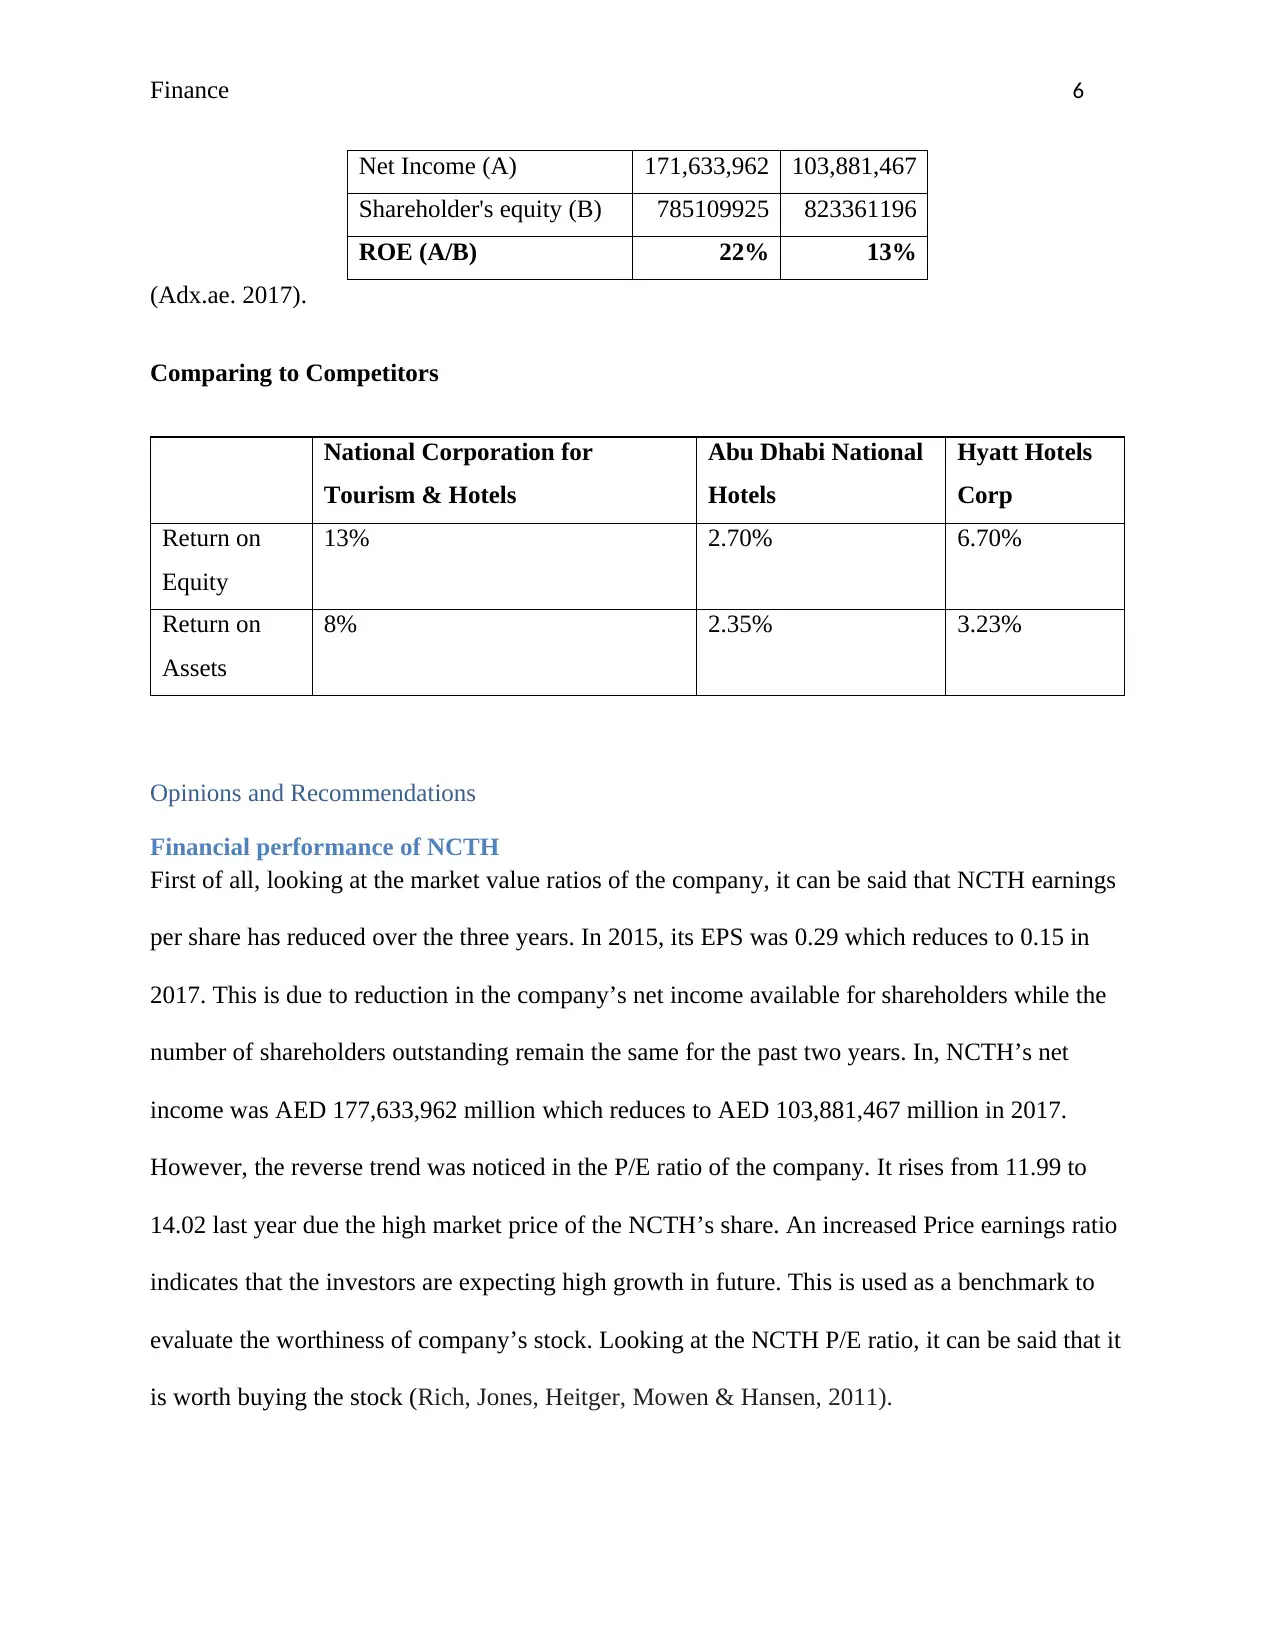
10. Comparison of ROA and ROE over past two years
Return on Assets
NCTH
2016 2017
Net Income (A) 171,633,962 103,881,467
Total assets (B) 1295234065 1296701924
ROA (A/B) 13% 8%
(Adx.ae. 2017).
Return on equity
NCTH
2016 2017
13-Mar-16
18-Apr-16
24-May-16
29-Jun-16
4-Aug-16
9-Sep-16
15-Oct-16
20-Nov-16
26-Dec-16
31-Jan-17
8-Mar-17
13-Apr-17
19-May-17
24-Jun-17
30-Jul-17
4-Sep-17
10-Oct-17
15-Nov-17
21-Dec-17
26-Jan-18
3-Mar-18
8-Apr-18
0
1
2
3
4
5
6
Stock price comparision
NCTH ADI
years
Values
(Adx.ae. 2018).
10. Comparison of ROA and ROE over past two years
Return on Assets
NCTH
2016 2017
Net Income (A) 171,633,962 103,881,467
Total assets (B) 1295234065 1296701924
ROA (A/B) 13% 8%
(Adx.ae. 2017).
Return on equity
NCTH
2016 2017
⊘ This is a preview!⊘
Do you want full access?
Subscribe today to unlock all pages.
Trusted by 1+ million students worldwide
Finance 6
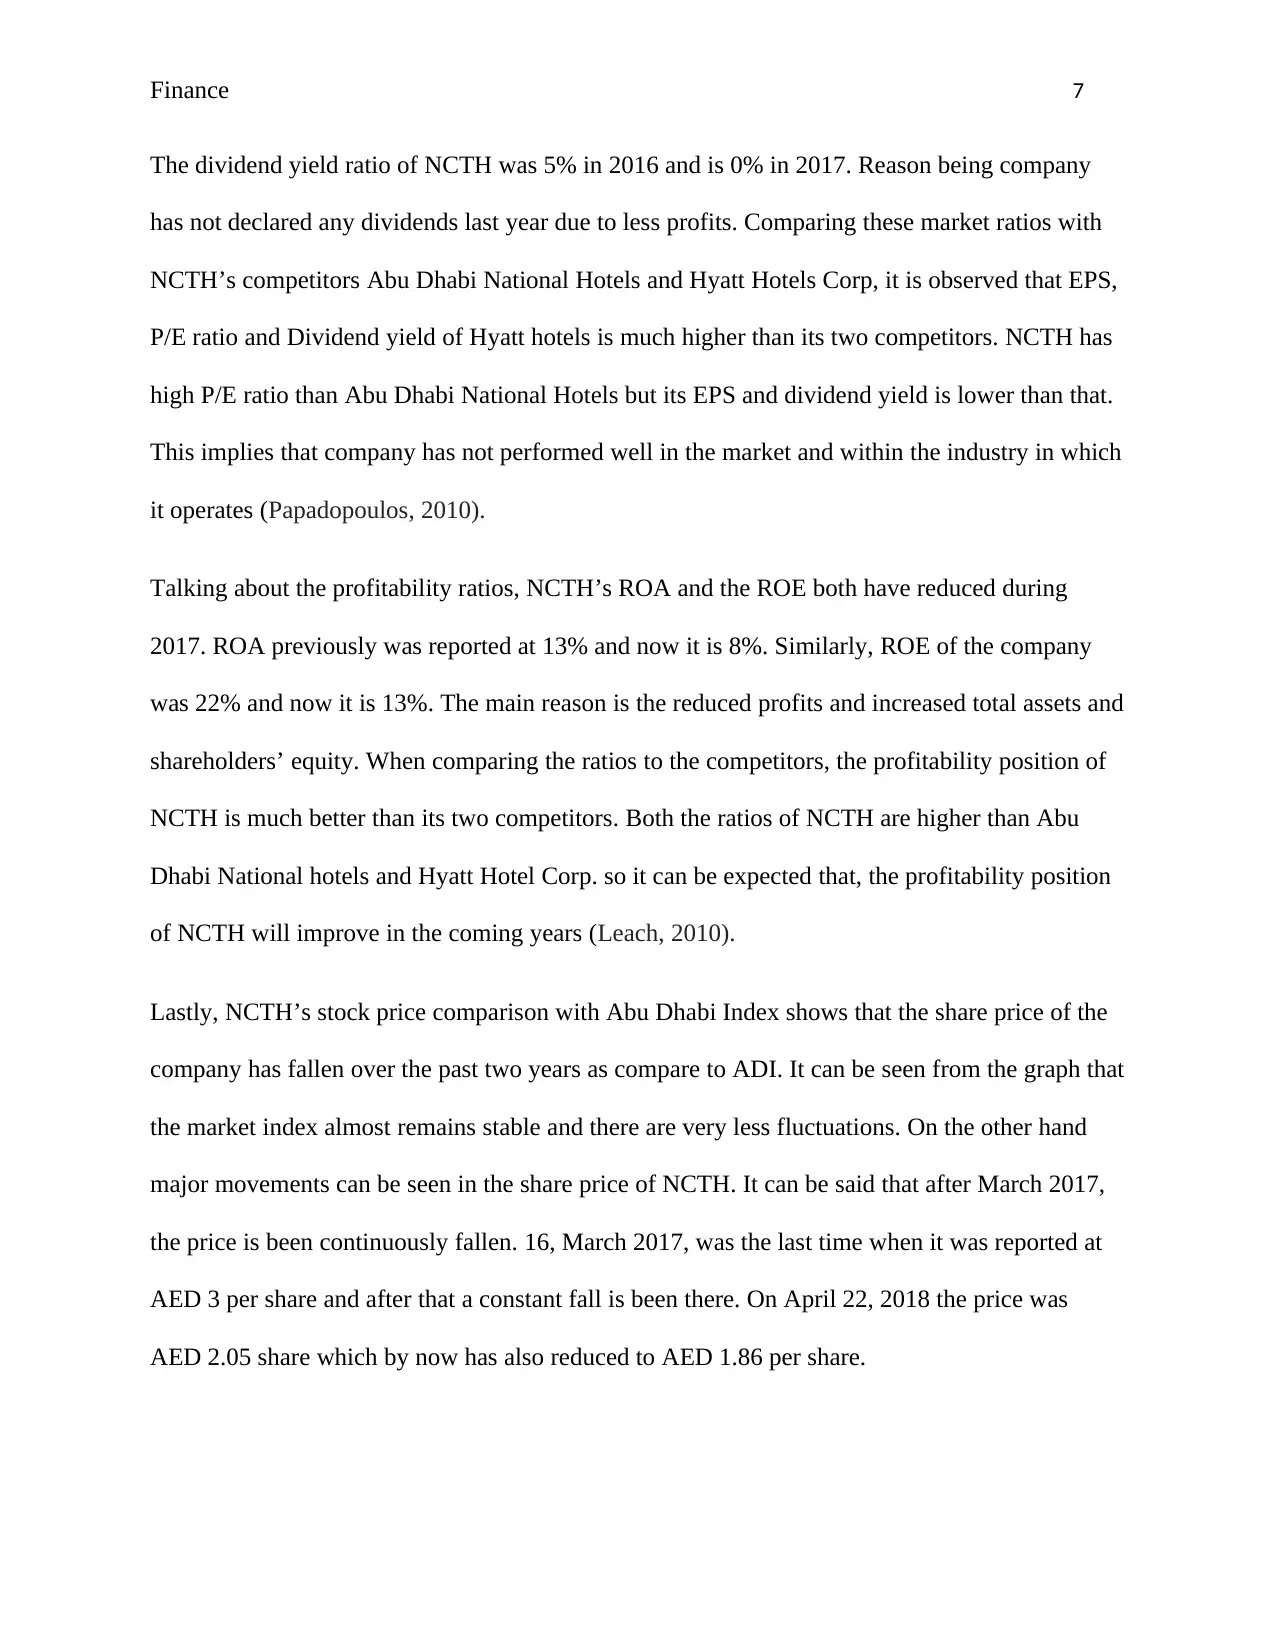
Net Income (A) 171,633,962 103,881,467
Shareholder's equity (B) 785109925 823361196
ROE (A/B) 22% 13%
(Adx.ae. 2017).
Comparing to Competitors
National Corporation for
Tourism & Hotels
Abu Dhabi National
Hotels
Hyatt Hotels
Corp
Return on
Equity
13% 2.70% 6.70%
Return on
Assets
8% 2.35% 3.23%
Opinions and Recommendations
Financial performance of NCTH
First of all, looking at the market value ratios of the company, it can be said that NCTH earnings
per share has reduced over the three years. In 2015, its EPS was 0.29 which reduces to 0.15 in
2017. This is due to reduction in the company’s net income available for shareholders while the
number of shareholders outstanding remain the same for the past two years. In, NCTH’s net
income was AED 177,633,962 million which reduces to AED 103,881,467 million in 2017.
However, the reverse trend was noticed in the P/E ratio of the company. It rises from 11.99 to
14.02 last year due the high market price of the NCTH’s share. An increased Price earnings ratio
indicates that the investors are expecting high growth in future. This is used as a benchmark to
evaluate the worthiness of company’s stock. Looking at the NCTH P/E ratio, it can be said that it
is worth buying the stock (Rich, Jones, Heitger, Mowen & Hansen, 2011).
Paraphrase This Document
Need a fresh take? Get an instant paraphrase of this document with our AI Paraphraser
Finance 7
The dividend yield ratio of NCTH was 5% in 2016 and is 0% in 2017. Reason being company
has not declared any dividends last year due to less profits. Comparing these market ratios with
NCTH’s competitors Abu Dhabi National Hotels and Hyatt Hotels Corp, it is observed that EPS,
P/E ratio and Dividend yield of Hyatt hotels is much higher than its two competitors. NCTH has
high P/E ratio than Abu Dhabi National Hotels but its EPS and dividend yield is lower than that.
This implies that company has not performed well in the market and within the industry in which
it operates (Papadopoulos, 2010).
Talking about the profitability ratios, NCTH’s ROA and the ROE both have reduced during
2017. ROA previously was reported at 13% and now it is 8%. Similarly, ROE of the company
was 22% and now it is 13%. The main reason is the reduced profits and increased total assets and
shareholders’ equity. When comparing the ratios to the competitors, the profitability position of
NCTH is much better than its two competitors. Both the ratios of NCTH are higher than Abu
Dhabi National hotels and Hyatt Hotel Corp. so it can be expected that, the profitability position
of NCTH will improve in the coming years (Leach, 2010).
Lastly, NCTH’s stock price comparison with Abu Dhabi Index shows that the share price of the
company has fallen over the past two years as compare to ADI. It can be seen from the graph that
the market index almost remains stable and there are very less fluctuations. On the other hand
major movements can be seen in the share price of NCTH. It can be said that after March 2017,
the price is been continuously fallen. 16, March 2017, was the last time when it was reported at
AED 3 per share and after that a constant fall is been there. On April 22, 2018 the price was
AED 2.05 share which by now has also reduced to AED 1.86 per share.
Finance 8
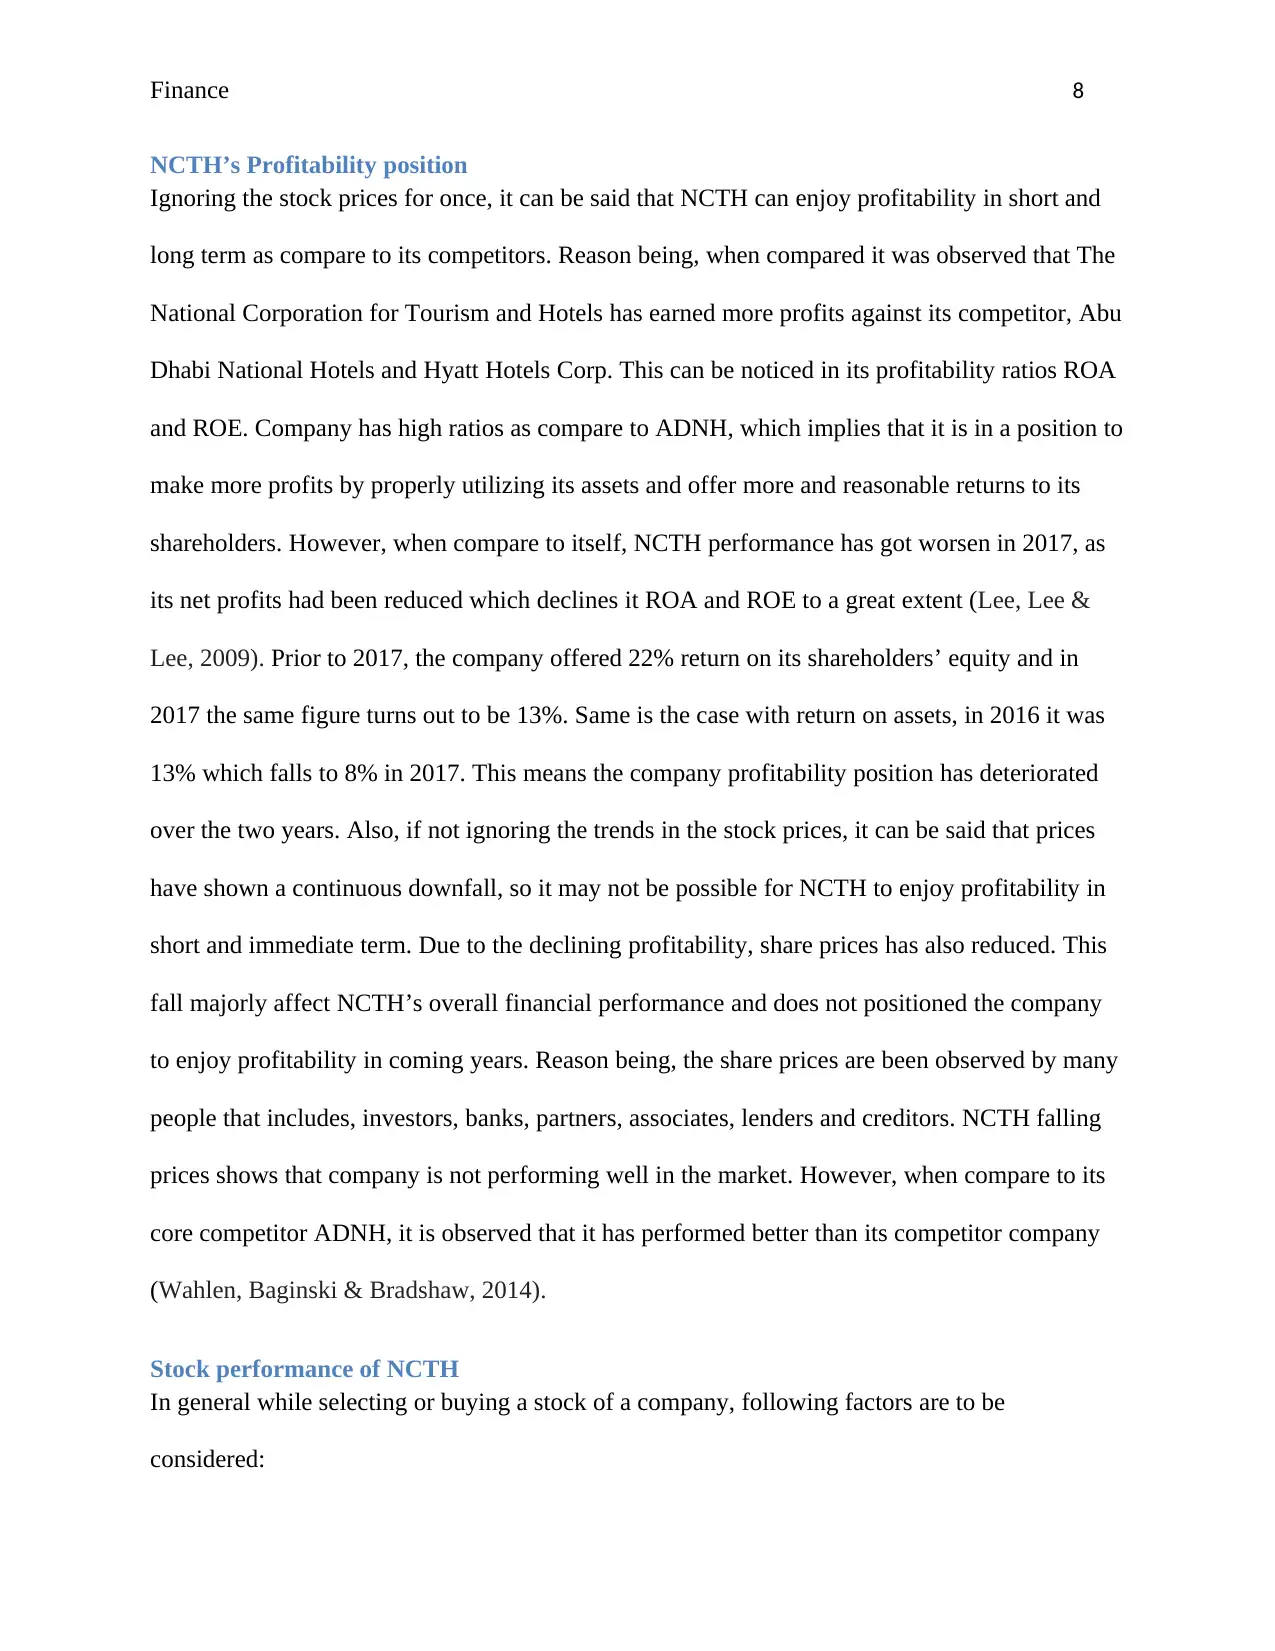
NCTH’s Profitability position
Ignoring the stock prices for once, it can be said that NCTH can enjoy profitability in short and
long term as compare to its competitors. Reason being, when compared it was observed that The
National Corporation for Tourism and Hotels has earned more profits against its competitor, Abu
Dhabi National Hotels and Hyatt Hotels Corp. This can be noticed in its profitability ratios ROA
and ROE. Company has high ratios as compare to ADNH, which implies that it is in a position to
make more profits by properly utilizing its assets and offer more and reasonable returns to its
shareholders. However, when compare to itself, NCTH performance has got worsen in 2017, as
its net profits had been reduced which declines it ROA and ROE to a great extent (Lee, Lee &
Lee, 2009). Prior to 2017, the company offered 22% return on its shareholders’ equity and in
2017 the same figure turns out to be 13%. Same is the case with return on assets, in 2016 it was
13% which falls to 8% in 2017. This means the company profitability position has deteriorated
over the two years. Also, if not ignoring the trends in the stock prices, it can be said that prices
have shown a continuous downfall, so it may not be possible for NCTH to enjoy profitability in
short and immediate term. Due to the declining profitability, share prices has also reduced. This
fall majorly affect NCTH’s overall financial performance and does not positioned the company
to enjoy profitability in coming years. Reason being, the share prices are been observed by many
people that includes, investors, banks, partners, associates, lenders and creditors. NCTH falling
prices shows that company is not performing well in the market. However, when compare to its
core competitor ADNH, it is observed that it has performed better than its competitor company
(Wahlen, Baginski & Bradshaw, 2014).
Stock performance of NCTH
In general while selecting or buying a stock of a company, following factors are to be
considered:
⊘ This is a preview!⊘
Do you want full access?
Subscribe today to unlock all pages.
Trusted by 1+ million students worldwide
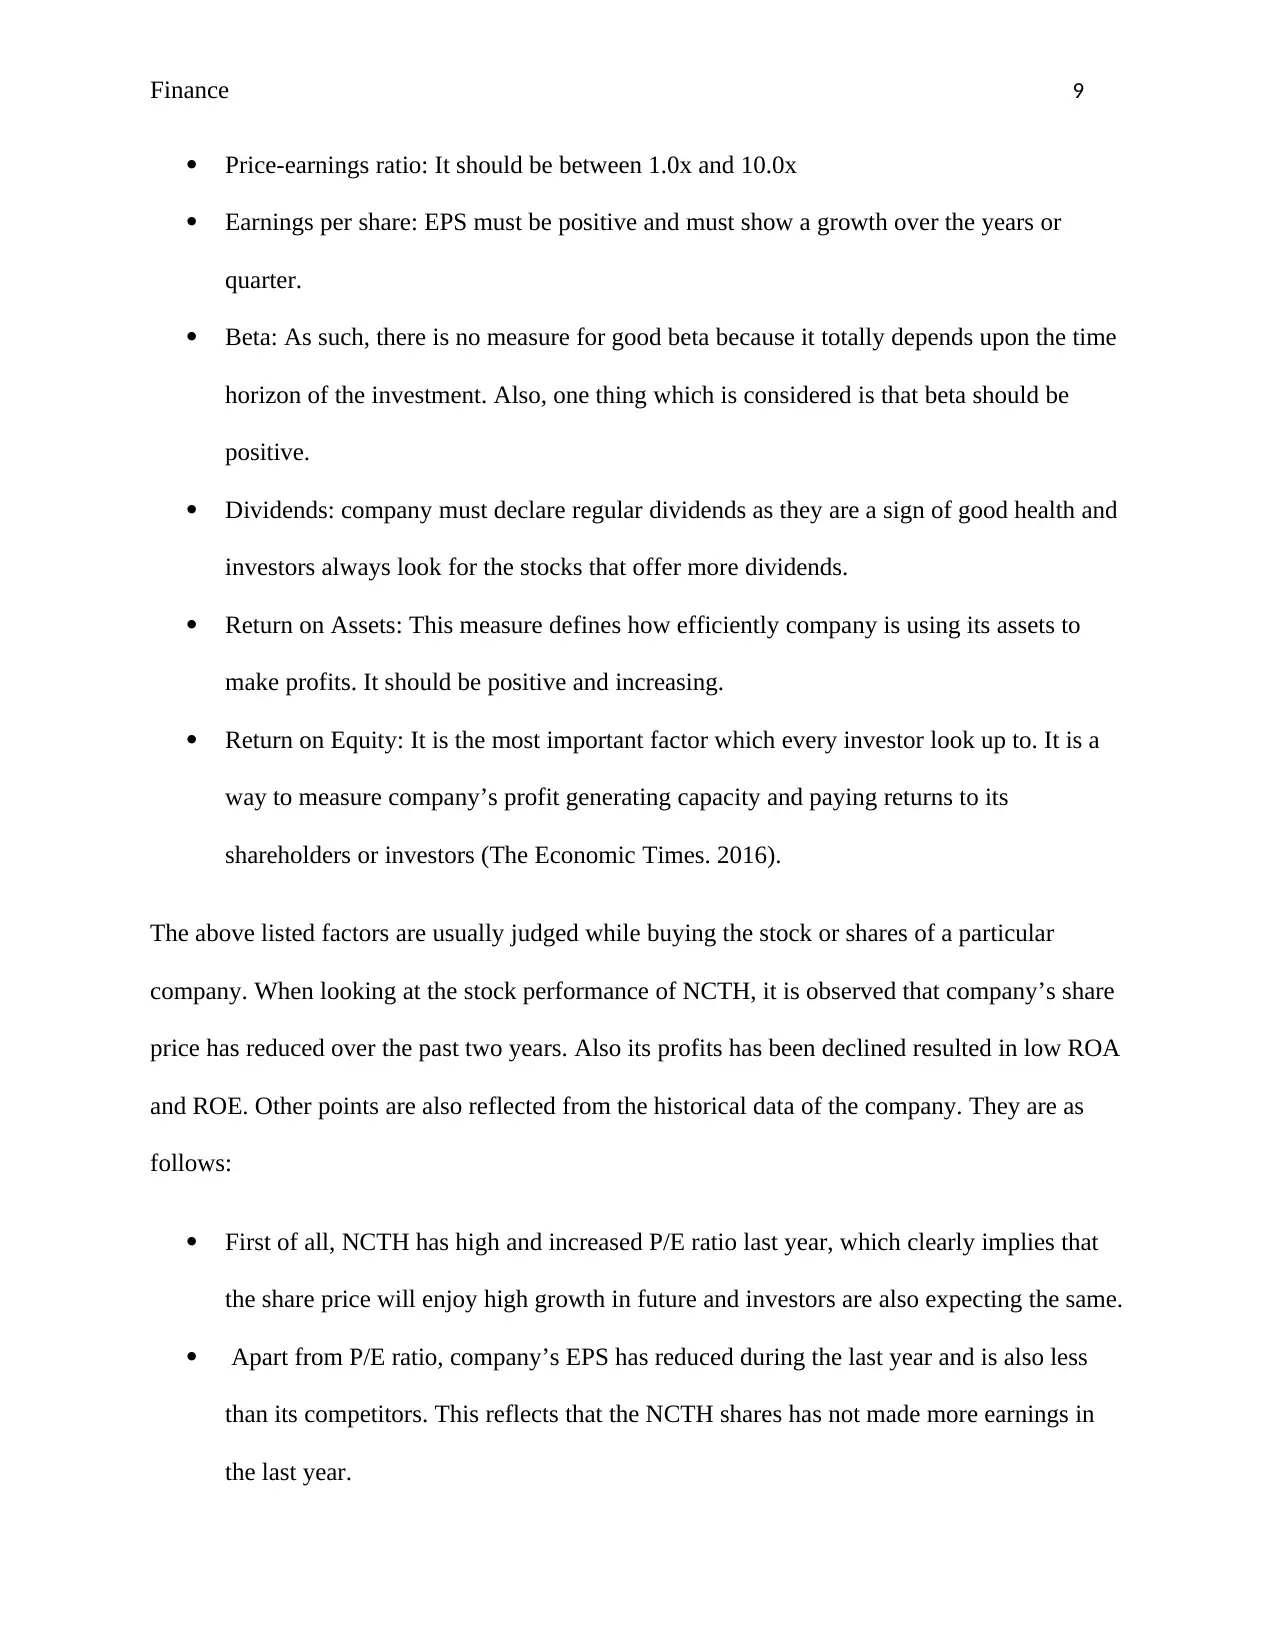
Finance 9
Price-earnings ratio: It should be between 1.0x and 10.0x
Earnings per share: EPS must be positive and must show a growth over the years or
quarter.
Beta: As such, there is no measure for good beta because it totally depends upon the time
horizon of the investment. Also, one thing which is considered is that beta should be
positive.
Dividends: company must declare regular dividends as they are a sign of good health and
investors always look for the stocks that offer more dividends.
Return on Assets: This measure defines how efficiently company is using its assets to
make profits. It should be positive and increasing.
Return on Equity: It is the most important factor which every investor look up to. It is a
way to measure company’s profit generating capacity and paying returns to its
shareholders or investors (The Economic Times. 2016).
The above listed factors are usually judged while buying the stock or shares of a particular
company. When looking at the stock performance of NCTH, it is observed that company’s share
price has reduced over the past two years. Also its profits has been declined resulted in low ROA
and ROE. Other points are also reflected from the historical data of the company. They are as
follows:
First of all, NCTH has high and increased P/E ratio last year, which clearly implies that
the share price will enjoy high growth in future and investors are also expecting the same.
Apart from P/E ratio, company’s EPS has reduced during the last year and is also less
than its competitors. This reflects that the NCTH shares has not made more earnings in
the last year.
Paraphrase This Document
Need a fresh take? Get an instant paraphrase of this document with our AI Paraphraser
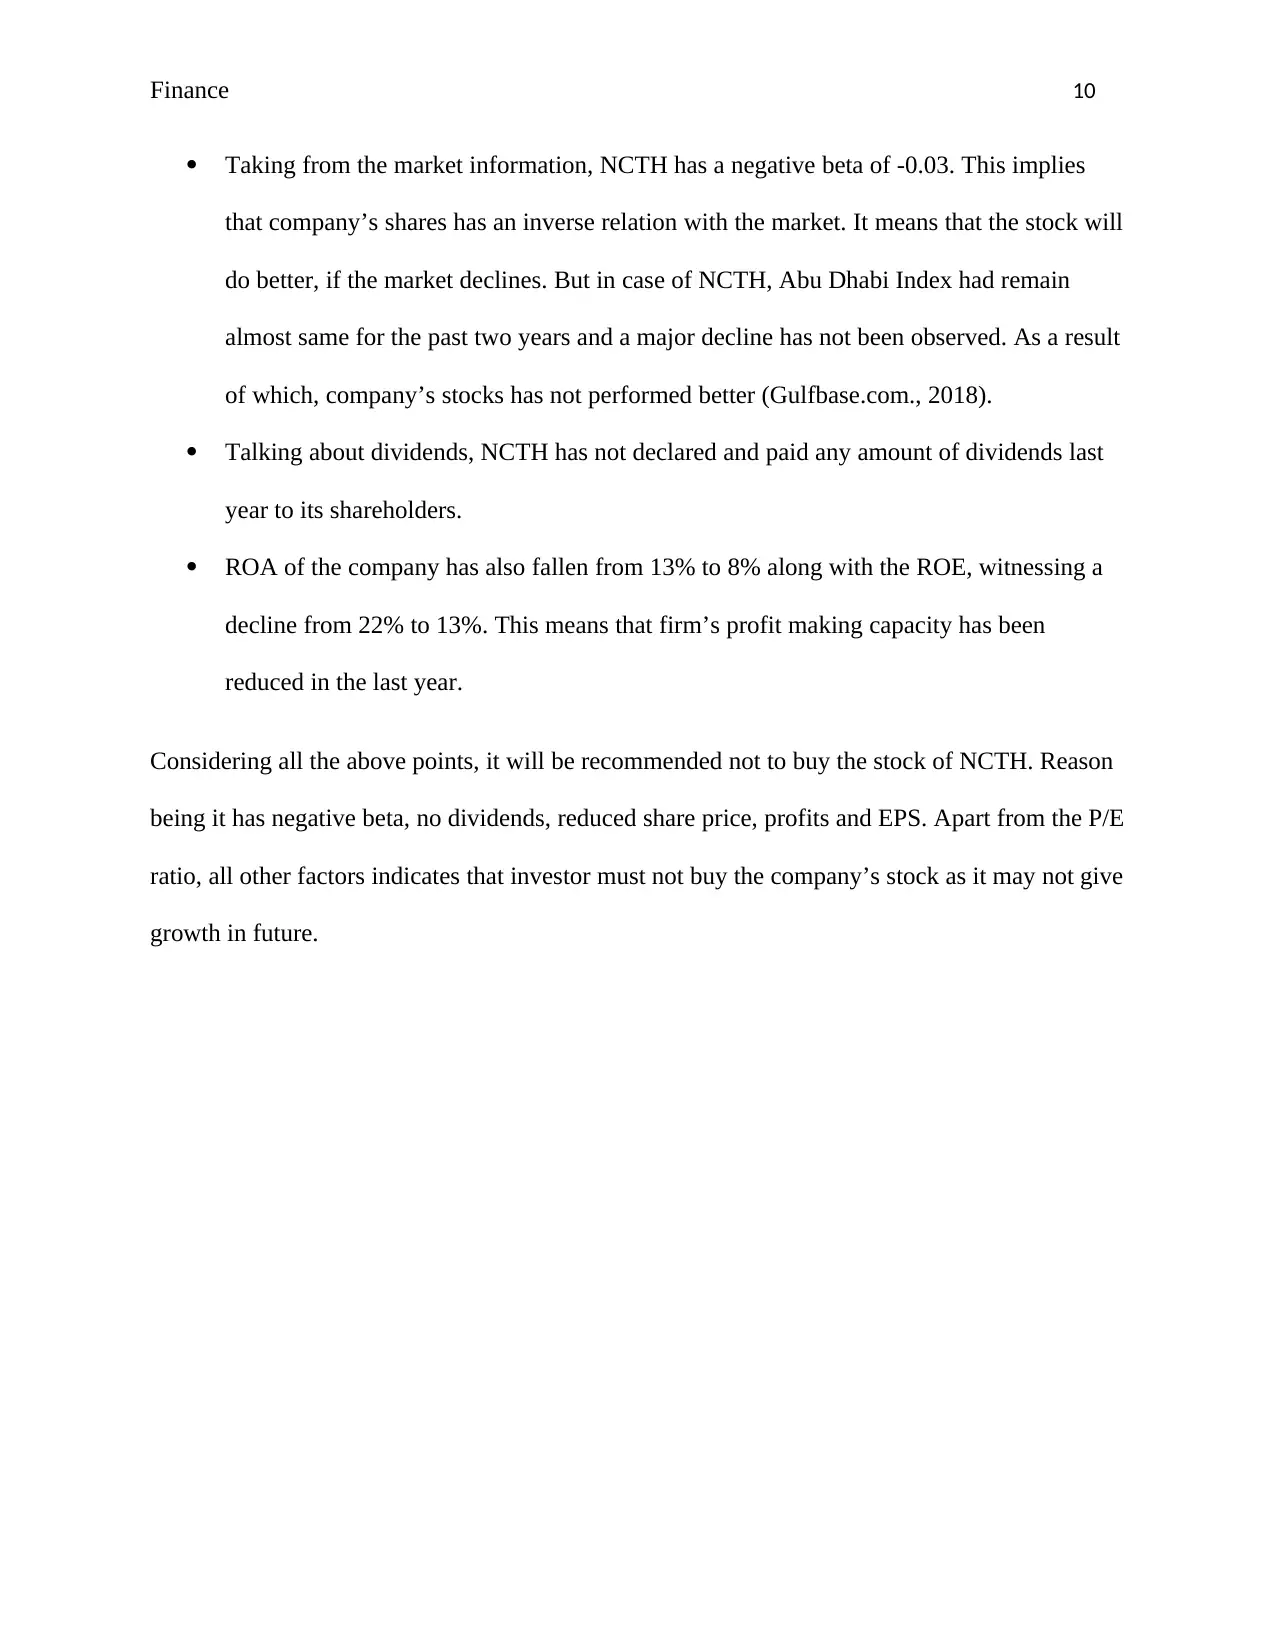
Finance 10
Taking from the market information, NCTH has a negative beta of -0.03. This implies
that company’s shares has an inverse relation with the market. It means that the stock will
do better, if the market declines. But in case of NCTH, Abu Dhabi Index had remain
almost same for the past two years and a major decline has not been observed. As a result
of which, company’s stocks has not performed better (Gulfbase.com., 2018).
Talking about dividends, NCTH has not declared and paid any amount of dividends last
year to its shareholders.
ROA of the company has also fallen from 13% to 8% along with the ROE, witnessing a
decline from 22% to 13%. This means that firm’s profit making capacity has been
reduced in the last year.
Considering all the above points, it will be recommended not to buy the stock of NCTH. Reason
being it has negative beta, no dividends, reduced share price, profits and EPS. Apart from the P/E
ratio, all other factors indicates that investor must not buy the company’s stock as it may not give
growth in future.
Finance 11
References
Adx.ae. (2017). Annual Report. Retrieved from
https://www.adx.ae/English/News/Pages/20180215085011-NCTH.aspx
Adx.ae. (2018). MARKET HISTORY. Retrieved from
https://www.adx.ae/English/Pages/Data/TradeHistory/MarketHistory.aspx
Gulfbase.com (2018). National Corp. For Tourism & Hotels - Company Overview. Retrieved
from https://www.gulfbase.com/profile-summary-national-corp-for-tourism-hotels-ncth-
391
Leach, R. (2010). Ratios made simple: a beginner's guide to the key financial ratios. Great
Britain: Harriman House Limited.
⊘ This is a preview!⊘
Do you want full access?
Subscribe today to unlock all pages.
Trusted by 1+ million students worldwide
1 out of 17

Your All-in-One AI-Powered Toolkit for Academic Success.
+13062052269
info@desklib.com
Available 24*7 on WhatsApp / Email
![[object Object]](/_next/static/media/star-bottom.7253800d.svg)
Unlock your academic potential
Copyright © 2020–2026 A2Z Services. All Rights Reserved. Developed and managed by ZUCOL.