Financial Analysis of Netflix: A Corporate Finance Project Report
VerifiedAdded on 2020/10/22
|23
|3184
|366
Project
AI Summary
This corporate finance project provides a detailed analysis of Netflix's financial performance. The project begins with an overview of Netflix and then delves into a corporate bond analysis, including credit ratings, outstanding debts, carrying costs, and yield to maturity calculations. Section 2 focuses on risk and return, calculating annualized returns and assessing risk through standard deviation and beta. Section 3 covers the cost of debt, cost of equity (CAPM), and the calculation of the Weighted Average Cost of Capital (WACC). The project also examines Netflix's cash flow statement and payout policy. The analysis compares Netflix's performance with the S&P 500 index, providing insights into the company's financial health and investment potential. The project uses financial data from 2015 to 2018 to conduct its analysis.

CORPORATE FINANCE
PROJECT
PROJECT
Paraphrase This Document
Need a fresh take? Get an instant paraphrase of this document with our AI Paraphraser
TABLE OF CONTENTS
TABLE OF CONTENTS..............................................................................................................2
INTRODUCTION...........................................................................................................................1
Overview of Netflix.........................................................................................................................1
SECTION 1: CORPORATE BOND ANALYSIS..........................................................................1
A. Company's Credit rating.........................................................................................................1
B Outstanding debts of company.................................................................................................3
C. Company’s carrying cost of outstanding debt.........................................................................3
D. Bond which is issued on recent aspect....................................................................................4
E. Yield to maturity and current price of outstanding bond........................................................5
SECTION 2: Risk and Return.........................................................................................................6
A. Calculation of return...............................................................................................................6
B. Calculating risk.......................................................................................................................8
SECTION 3...................................................................................................................................16
A. Cost of debt...........................................................................................................................16
B. Cost of Equity.......................................................................................................................17
C. Calculating WACC...............................................................................................................18
SECTION 4...................................................................................................................................18
Examining the cash flow statement of Netflix..........................................................................18
SECTION 5...................................................................................................................................18
A. Analysing payout Policy...........................................................................................................18
CONCLUSION..............................................................................................................................19
REFERENCES..............................................................................................................................20
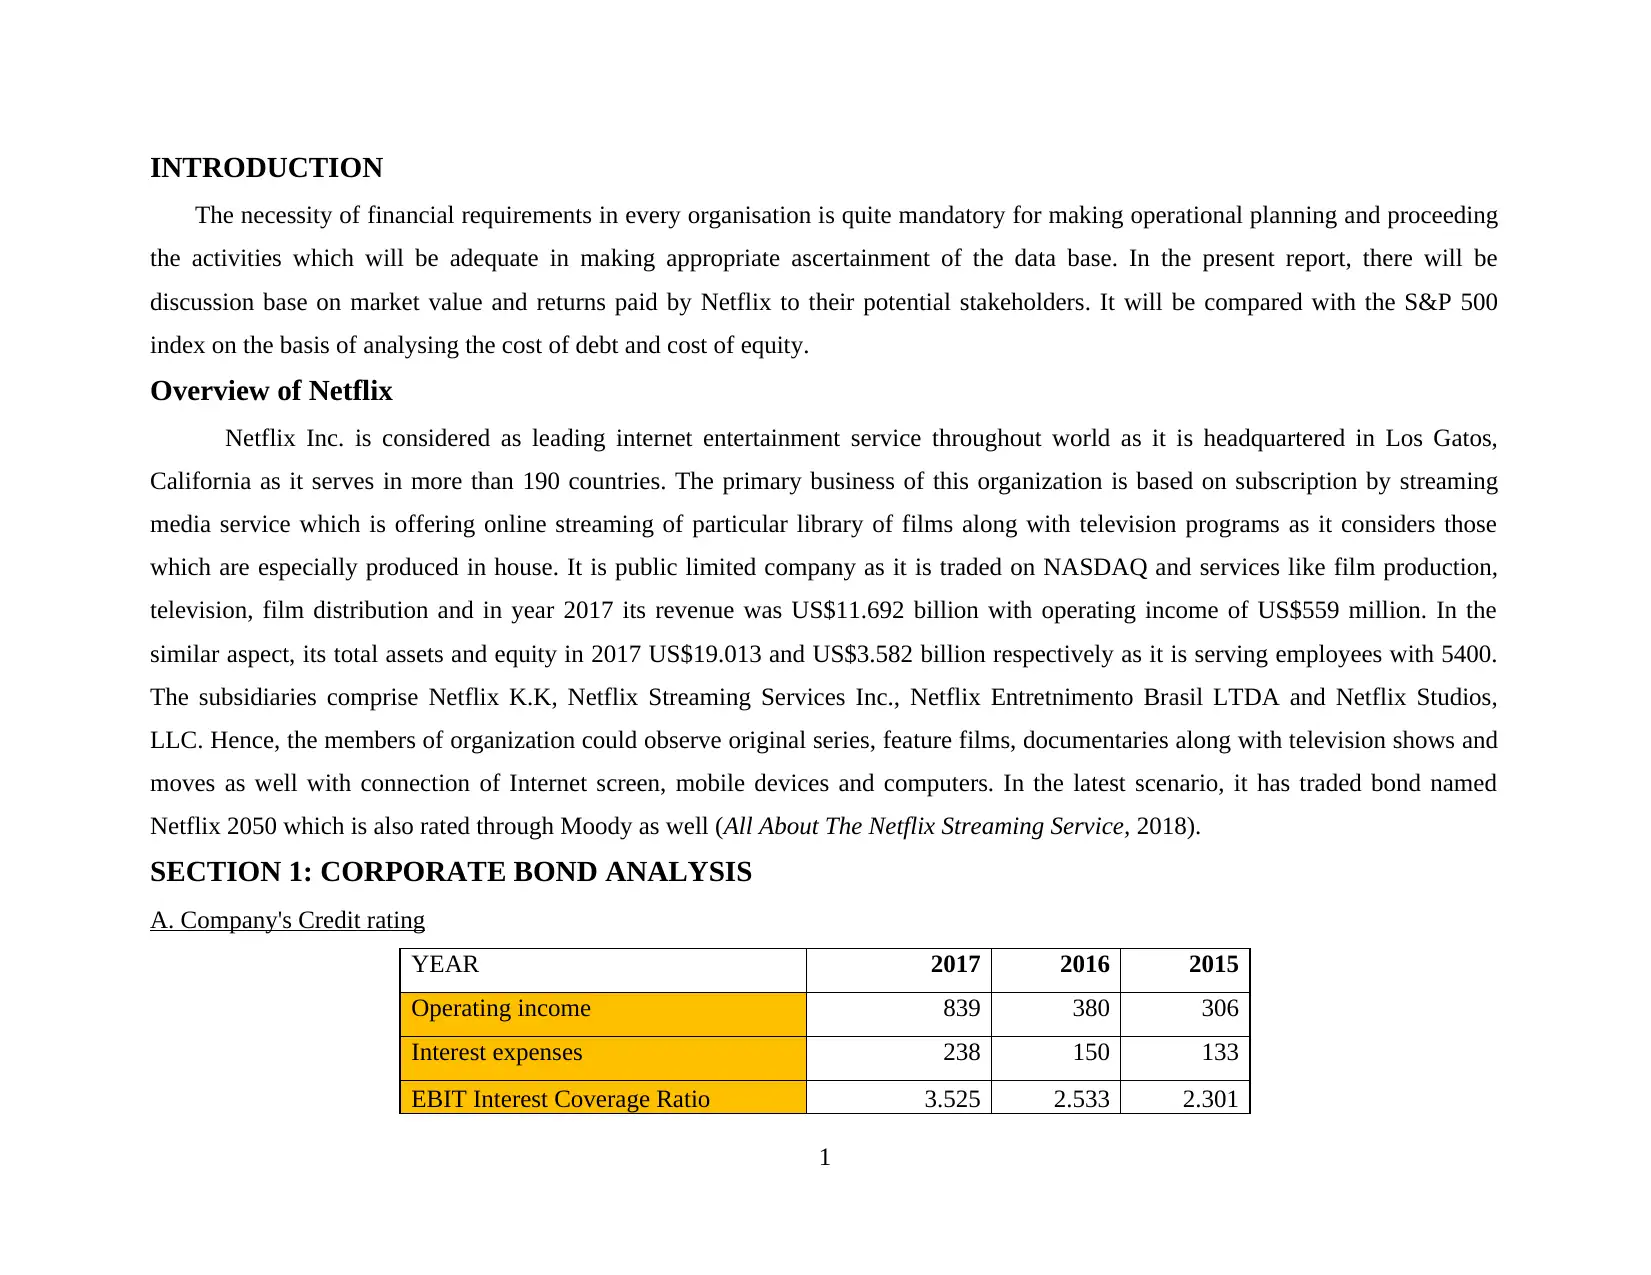
INTRODUCTION
The necessity of financial requirements in every organisation is quite mandatory for making operational planning and proceeding
the activities which will be adequate in making appropriate ascertainment of the data base. In the present report, there will be
discussion base on market value and returns paid by Netflix to their potential stakeholders. It will be compared with the S&P 500
index on the basis of analysing the cost of debt and cost of equity.
Overview of Netflix
Netflix Inc. is considered as leading internet entertainment service throughout world as it is headquartered in Los Gatos,
California as it serves in more than 190 countries. The primary business of this organization is based on subscription by streaming
media service which is offering online streaming of particular library of films along with television programs as it considers those
which are especially produced in house. It is public limited company as it is traded on NASDAQ and services like film production,
television, film distribution and in year 2017 its revenue was US$11.692 billion with operating income of US$559 million. In the
similar aspect, its total assets and equity in 2017 US$19.013 and US$3.582 billion respectively as it is serving employees with 5400.
The subsidiaries comprise Netflix K.K, Netflix Streaming Services Inc., Netflix Entretnimento Brasil LTDA and Netflix Studios,
LLC. Hence, the members of organization could observe original series, feature films, documentaries along with television shows and
moves as well with connection of Internet screen, mobile devices and computers. In the latest scenario, it has traded bond named
Netflix 2050 which is also rated through Moody as well (All About The Netflix Streaming Service, 2018).
SECTION 1: CORPORATE BOND ANALYSIS
A. Company's Credit rating
YEAR 2017 2016 2015
Operating income 839 380 306
Interest expenses 238 150 133
EBIT Interest Coverage Ratio 3.525 2.533 2.301
1
⊘ This is a preview!⊘
Do you want full access?
Subscribe today to unlock all pages.
Trusted by 1+ million students worldwide
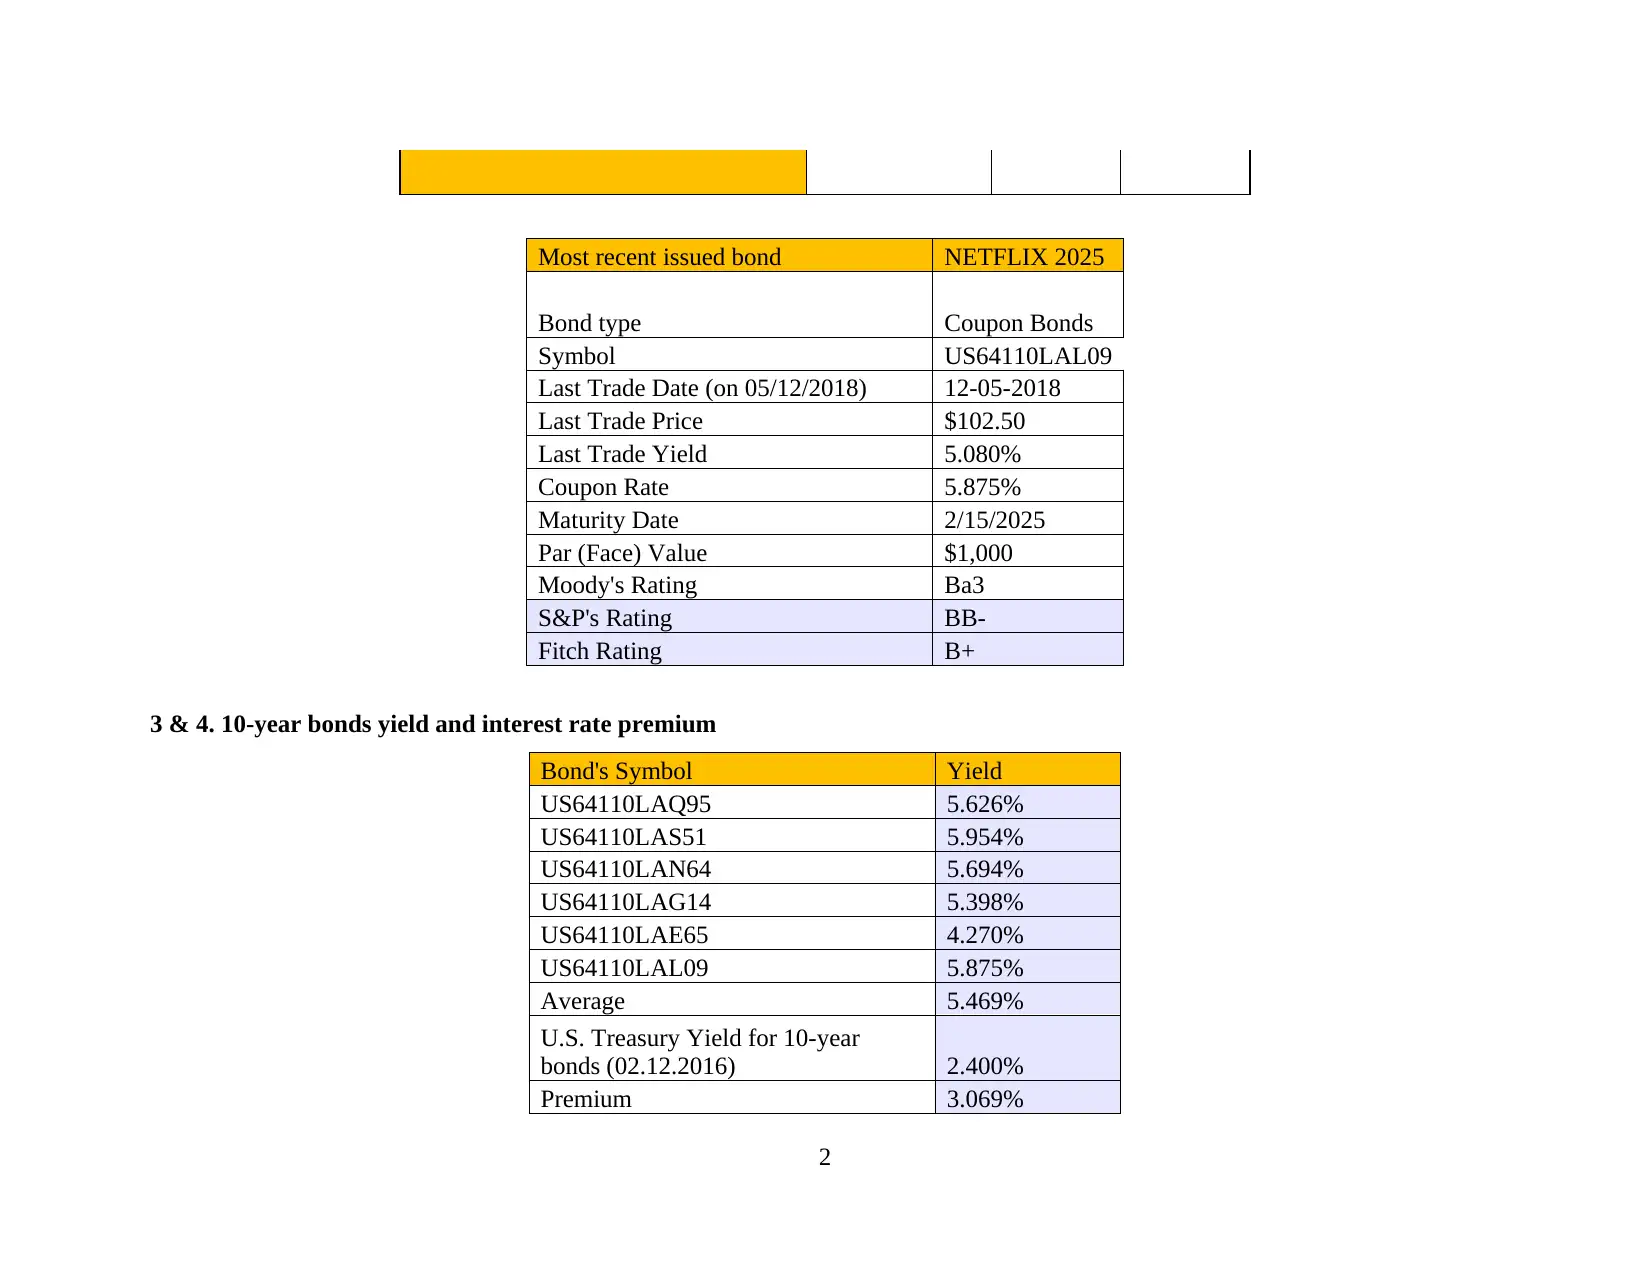
Most recent issued bond NETFLIX 2025
Bond type Coupon Bonds
Symbol US64110LAL09
Last Trade Date (on 05/12/2018) 12-05-2018
Last Trade Price $102.50
Last Trade Yield 5.080%
Coupon Rate 5.875%
Maturity Date 2/15/2025
Par (Face) Value $1,000
Moody's Rating Ba3
S&P's Rating BB-
Fitch Rating B+
3 & 4. 10-year bonds yield and interest rate premium
Bond's Symbol Yield
US64110LAQ95 5.626%
US64110LAS51 5.954%
US64110LAN64 5.694%
US64110LAG14 5.398%
US64110LAE65 4.270%
US64110LAL09 5.875%
Average 5.469%
U.S. Treasury Yield for 10-year
bonds (02.12.2016) 2.400%
Premium 3.069%
2
Paraphrase This Document
Need a fresh take? Get an instant paraphrase of this document with our AI Paraphraser
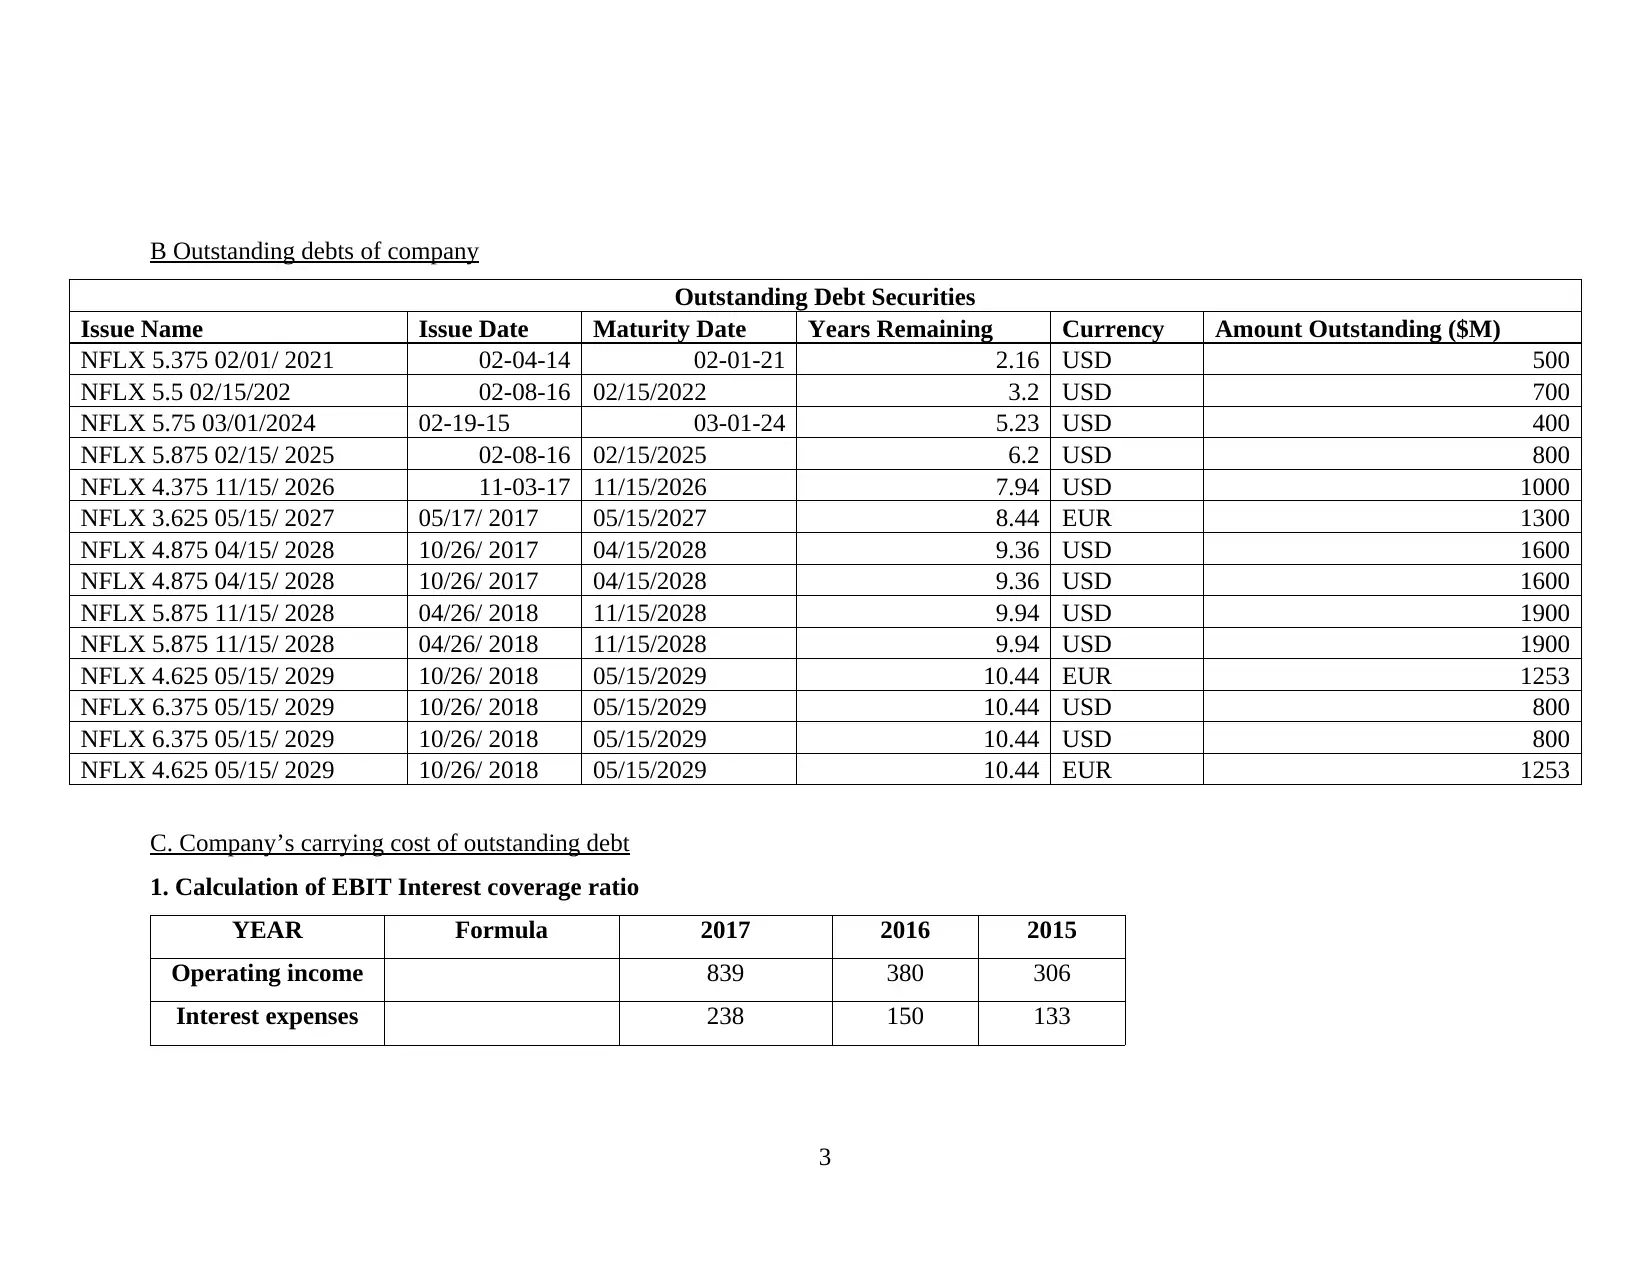
B Outstanding debts of company
Outstanding Debt Securities
Issue Name Issue Date Maturity Date Years Remaining Currency Amount Outstanding ($M)
NFLX 5.375 02/01/ 2021 02-04-14 02-01-21 2.16 USD 500
NFLX 5.5 02/15/202 02-08-16 02/15/2022 3.2 USD 700
NFLX 5.75 03/01/2024 02-19-15 03-01-24 5.23 USD 400
NFLX 5.875 02/15/ 2025 02-08-16 02/15/2025 6.2 USD 800
NFLX 4.375 11/15/ 2026 11-03-17 11/15/2026 7.94 USD 1000
NFLX 3.625 05/15/ 2027 05/17/ 2017 05/15/2027 8.44 EUR 1300
NFLX 4.875 04/15/ 2028 10/26/ 2017 04/15/2028 9.36 USD 1600
NFLX 4.875 04/15/ 2028 10/26/ 2017 04/15/2028 9.36 USD 1600
NFLX 5.875 11/15/ 2028 04/26/ 2018 11/15/2028 9.94 USD 1900
NFLX 5.875 11/15/ 2028 04/26/ 2018 11/15/2028 9.94 USD 1900
NFLX 4.625 05/15/ 2029 10/26/ 2018 05/15/2029 10.44 EUR 1253
NFLX 6.375 05/15/ 2029 10/26/ 2018 05/15/2029 10.44 USD 800
NFLX 6.375 05/15/ 2029 10/26/ 2018 05/15/2029 10.44 USD 800
NFLX 4.625 05/15/ 2029 10/26/ 2018 05/15/2029 10.44 EUR 1253
C. Company’s carrying cost of outstanding debt
1. Calculation of EBIT Interest coverage ratio
YEAR Formula 2017 2016 2015
Operating income 839 380 306
Interest expenses 238 150 133
3
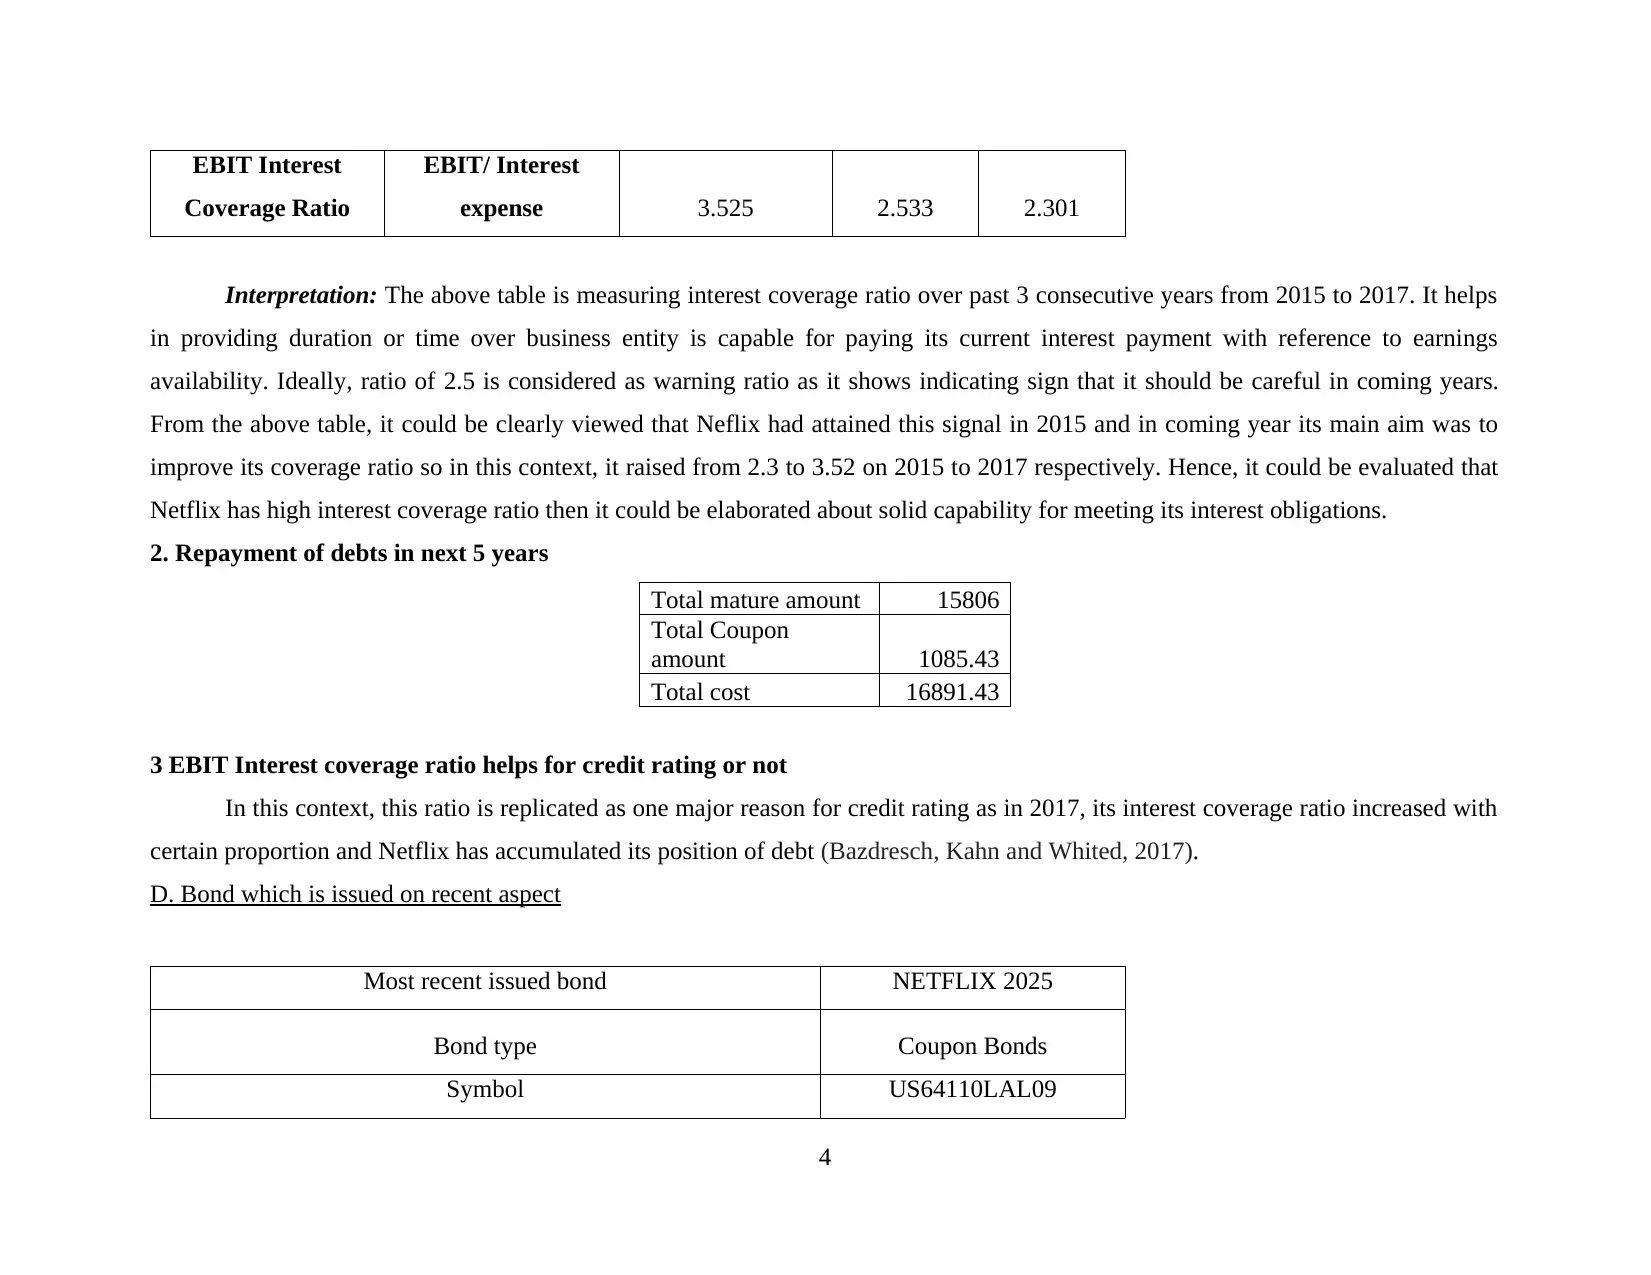
EBIT Interest
Coverage Ratio
EBIT/ Interest
expense 3.525 2.533 2.301
Interpretation: The above table is measuring interest coverage ratio over past 3 consecutive years from 2015 to 2017. It helps
in providing duration or time over business entity is capable for paying its current interest payment with reference to earnings
availability. Ideally, ratio of 2.5 is considered as warning ratio as it shows indicating sign that it should be careful in coming years.
From the above table, it could be clearly viewed that Neflix had attained this signal in 2015 and in coming year its main aim was to
improve its coverage ratio so in this context, it raised from 2.3 to 3.52 on 2015 to 2017 respectively. Hence, it could be evaluated that
Netflix has high interest coverage ratio then it could be elaborated about solid capability for meeting its interest obligations.
2. Repayment of debts in next 5 years
Total mature amount 15806
Total Coupon
amount 1085.43
Total cost 16891.43
3 EBIT Interest coverage ratio helps for credit rating or not
In this context, this ratio is replicated as one major reason for credit rating as in 2017, its interest coverage ratio increased with
certain proportion and Netflix has accumulated its position of debt (Bazdresch, Kahn and Whited, 2017).
D. Bond which is issued on recent aspect
Most recent issued bond NETFLIX 2025
Bond type Coupon Bonds
Symbol US64110LAL09
4
⊘ This is a preview!⊘
Do you want full access?
Subscribe today to unlock all pages.
Trusted by 1+ million students worldwide
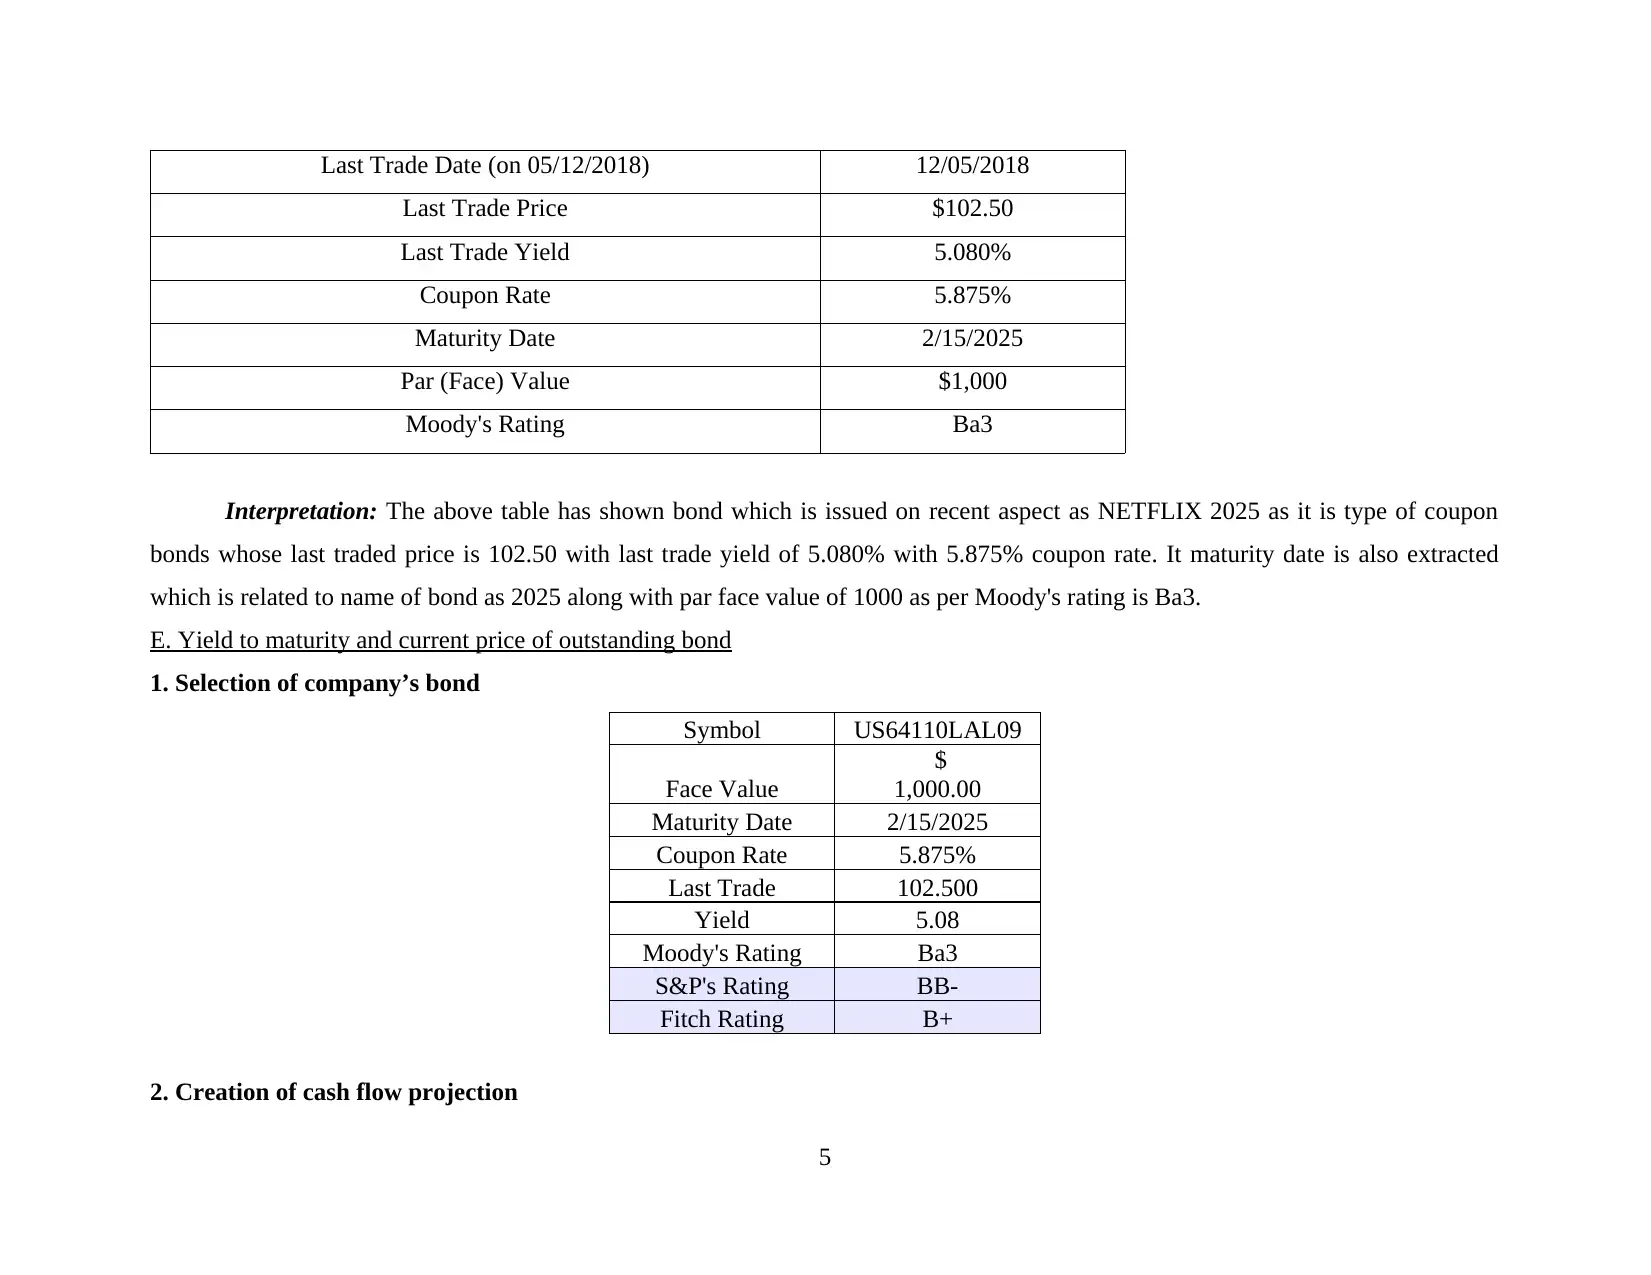
Last Trade Date (on 05/12/2018) 12/05/2018
Last Trade Price $102.50
Last Trade Yield 5.080%
Coupon Rate 5.875%
Maturity Date 2/15/2025
Par (Face) Value $1,000
Moody's Rating Ba3
Interpretation: The above table has shown bond which is issued on recent aspect as NETFLIX 2025 as it is type of coupon
bonds whose last traded price is 102.50 with last trade yield of 5.080% with 5.875% coupon rate. It maturity date is also extracted
which is related to name of bond as 2025 along with par face value of 1000 as per Moody's rating is Ba3.
E. Yield to maturity and current price of outstanding bond
1. Selection of company’s bond
Symbol US64110LAL09
Face Value
$
1,000.00
Maturity Date 2/15/2025
Coupon Rate 5.875%
Last Trade 102.500
Yield 5.08
Moody's Rating Ba3
S&P's Rating BB-
Fitch Rating B+
2. Creation of cash flow projection
5
Paraphrase This Document
Need a fresh take? Get an instant paraphrase of this document with our AI Paraphraser
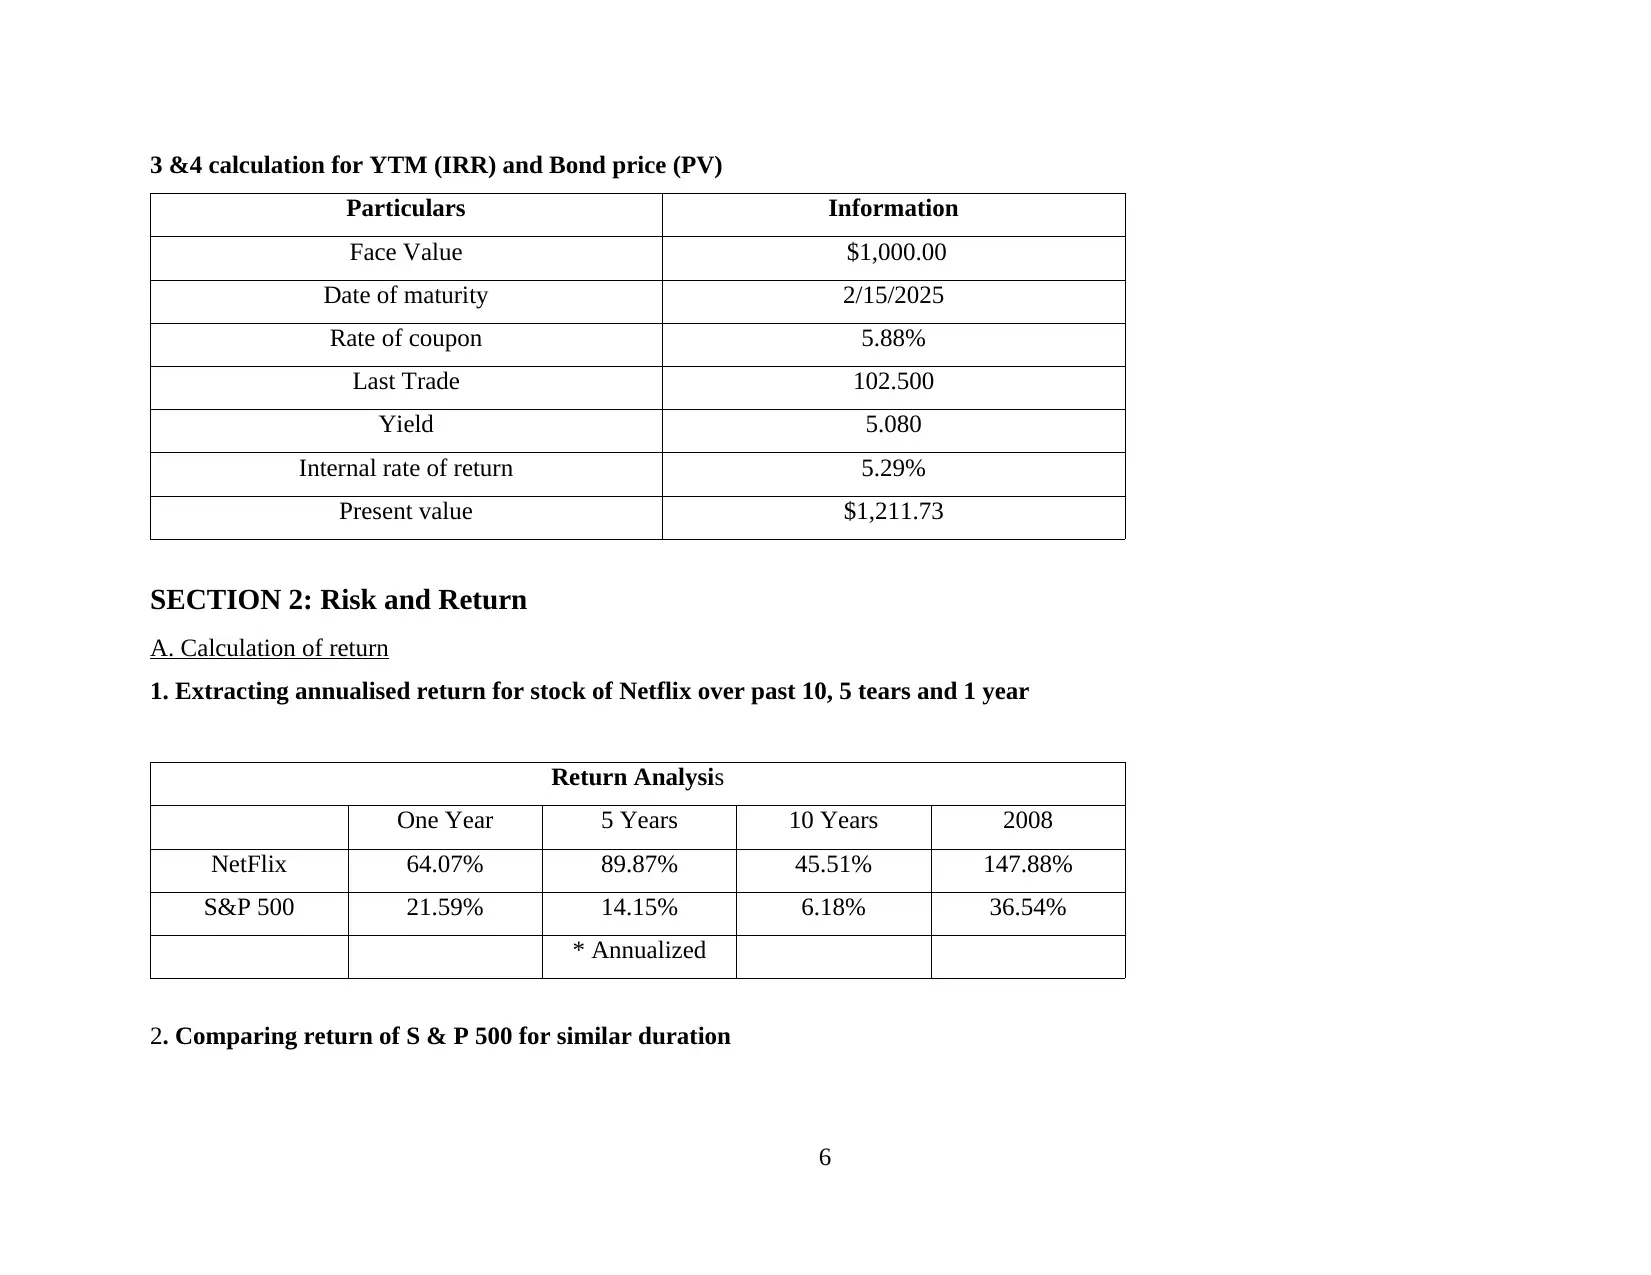
3 &4 calculation for YTM (IRR) and Bond price (PV)
Particulars Information
Face Value $1,000.00
Date of maturity 2/15/2025
Rate of coupon 5.88%
Last Trade 102.500
Yield 5.080
Internal rate of return 5.29%
Present value $1,211.73
SECTION 2: Risk and Return
A. Calculation of return
1. Extracting annualised return for stock of Netflix over past 10, 5 tears and 1 year
Return Analysis
One Year 5 Years 10 Years 2008
NetFlix 64.07% 89.87% 45.51% 147.88%
S&P 500 21.59% 14.15% 6.18% 36.54%
* Annualized
2. Comparing return of S & P 500 for similar duration
6
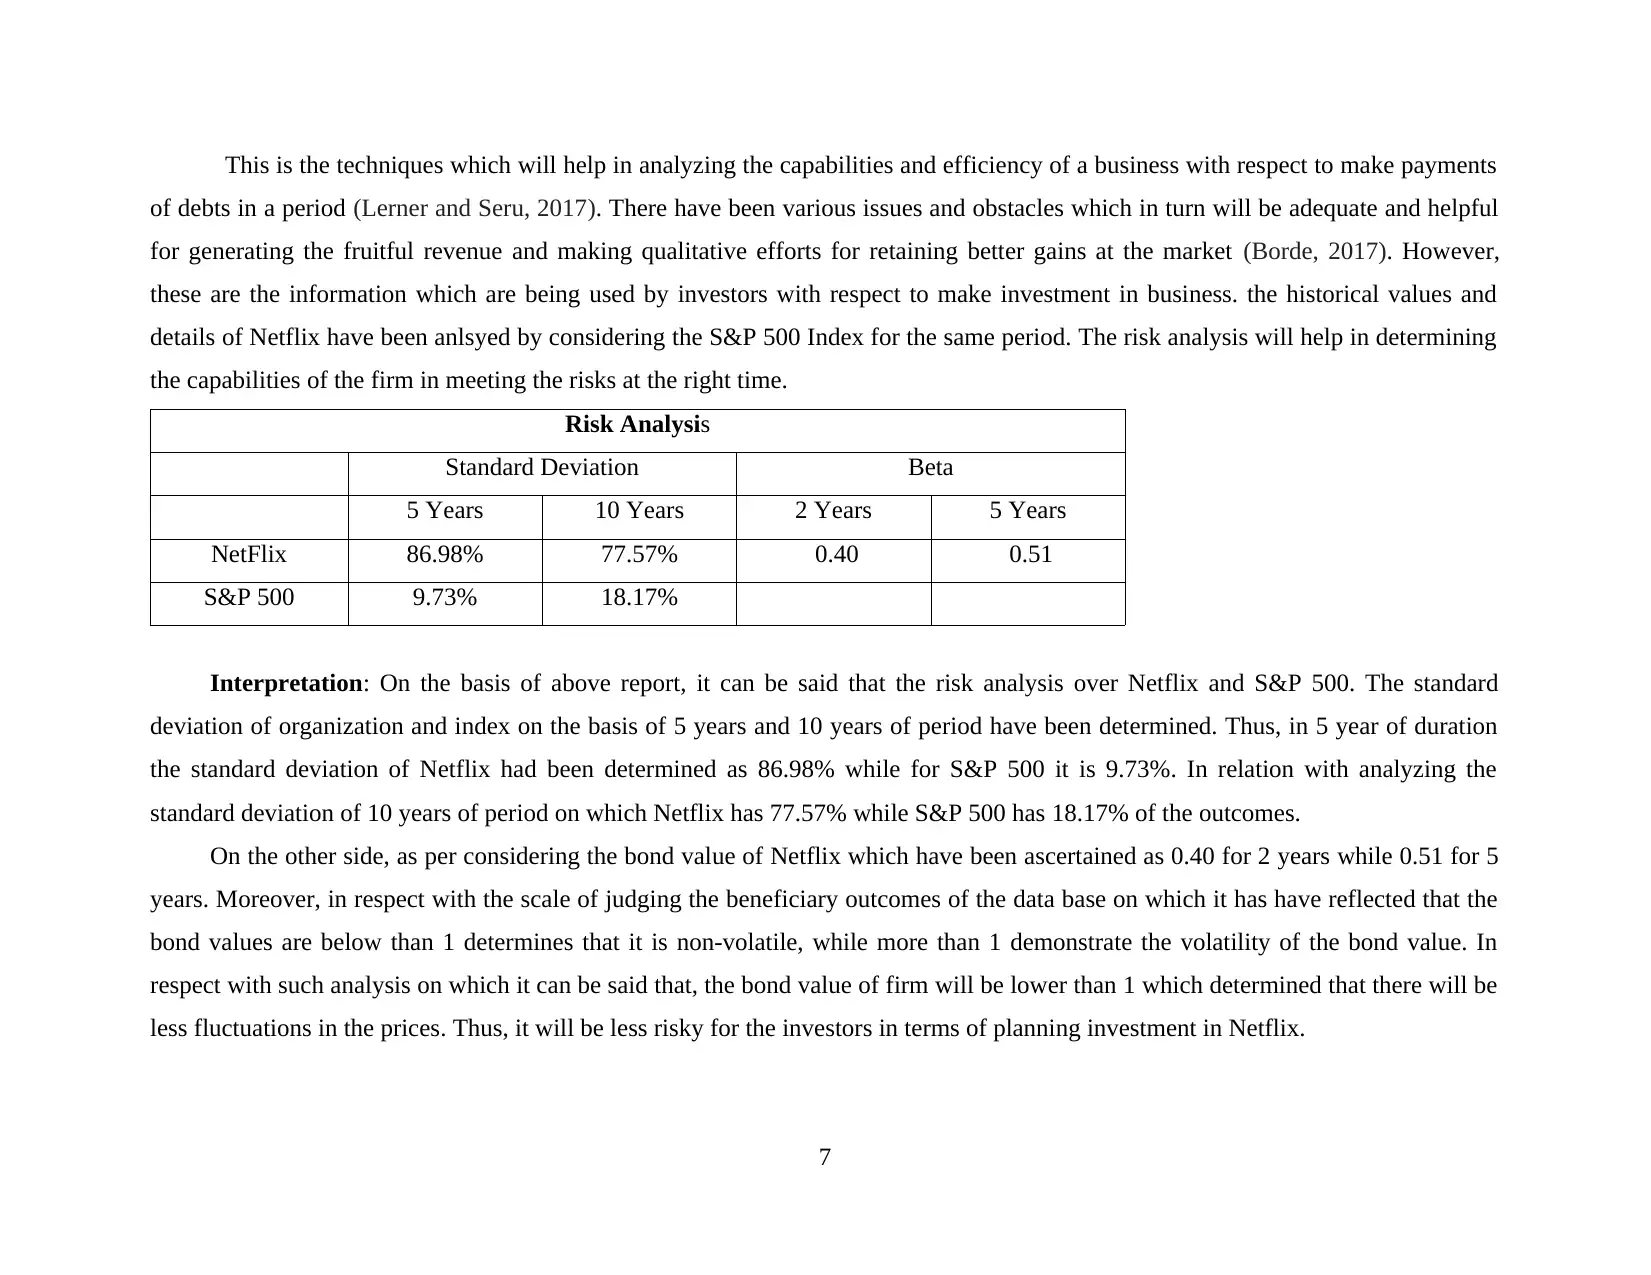
This is the techniques which will help in analyzing the capabilities and efficiency of a business with respect to make payments
of debts in a period (Lerner and Seru, 2017). There have been various issues and obstacles which in turn will be adequate and helpful
for generating the fruitful revenue and making qualitative efforts for retaining better gains at the market (Borde, 2017). However,
these are the information which are being used by investors with respect to make investment in business. the historical values and
details of Netflix have been anlsyed by considering the S&P 500 Index for the same period. The risk analysis will help in determining
the capabilities of the firm in meeting the risks at the right time.
Risk Analysis
Standard Deviation Beta
5 Years 10 Years 2 Years 5 Years
NetFlix 86.98% 77.57% 0.40 0.51
S&P 500 9.73% 18.17%
Interpretation: On the basis of above report, it can be said that the risk analysis over Netflix and S&P 500. The standard
deviation of organization and index on the basis of 5 years and 10 years of period have been determined. Thus, in 5 year of duration
the standard deviation of Netflix had been determined as 86.98% while for S&P 500 it is 9.73%. In relation with analyzing the
standard deviation of 10 years of period on which Netflix has 77.57% while S&P 500 has 18.17% of the outcomes.
On the other side, as per considering the bond value of Netflix which have been ascertained as 0.40 for 2 years while 0.51 for 5
years. Moreover, in respect with the scale of judging the beneficiary outcomes of the data base on which it has have reflected that the
bond values are below than 1 determines that it is non-volatile, while more than 1 demonstrate the volatility of the bond value. In
respect with such analysis on which it can be said that, the bond value of firm will be lower than 1 which determined that there will be
less fluctuations in the prices. Thus, it will be less risky for the investors in terms of planning investment in Netflix.
7
⊘ This is a preview!⊘
Do you want full access?
Subscribe today to unlock all pages.
Trusted by 1+ million students worldwide
B. Calculating risk
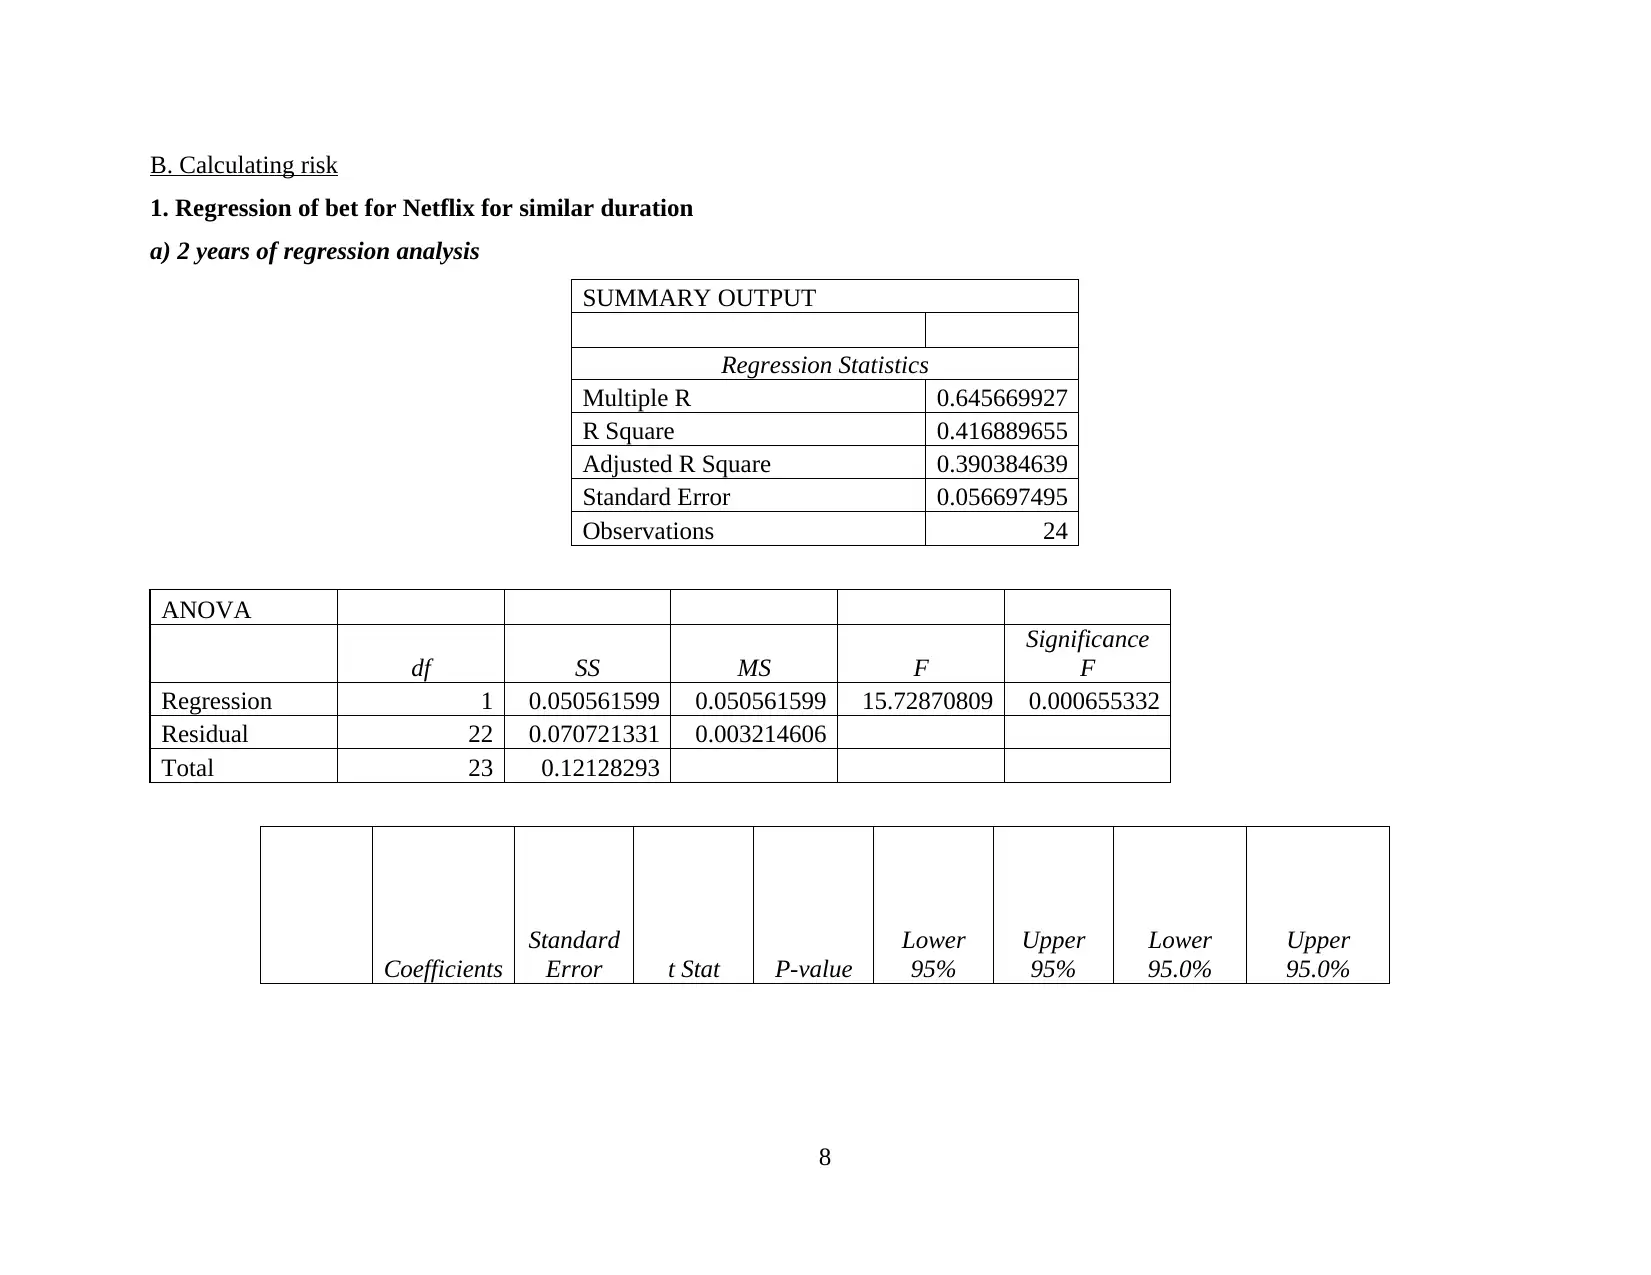
1. Regression of bet for Netflix for similar duration
a) 2 years of regression analysis
SUMMARY OUTPUT
Regression Statistics
Multiple R 0.645669927
R Square 0.416889655
Adjusted R Square 0.390384639
Standard Error 0.056697495
Observations 24
ANOVA
df SS MS F
Significance
F
Regression 1 0.050561599 0.050561599 15.72870809 0.000655332
Residual 22 0.070721331 0.003214606
Total 23 0.12128293
Coefficients
Standard
Error t Stat P-value
Lower
95%
Upper
95%
Lower
95.0%
Upper
95.0%
8
Paraphrase This Document
Need a fresh take? Get an instant paraphrase of this document with our AI Paraphraser
Intercept 0.014 0.011 1.231 0.231 -0.009 0.038 -0.0098 0.0386
X
Variable
1 1.46 0.368 3.96 0.0006 0.697 2.22 0.697 2.227
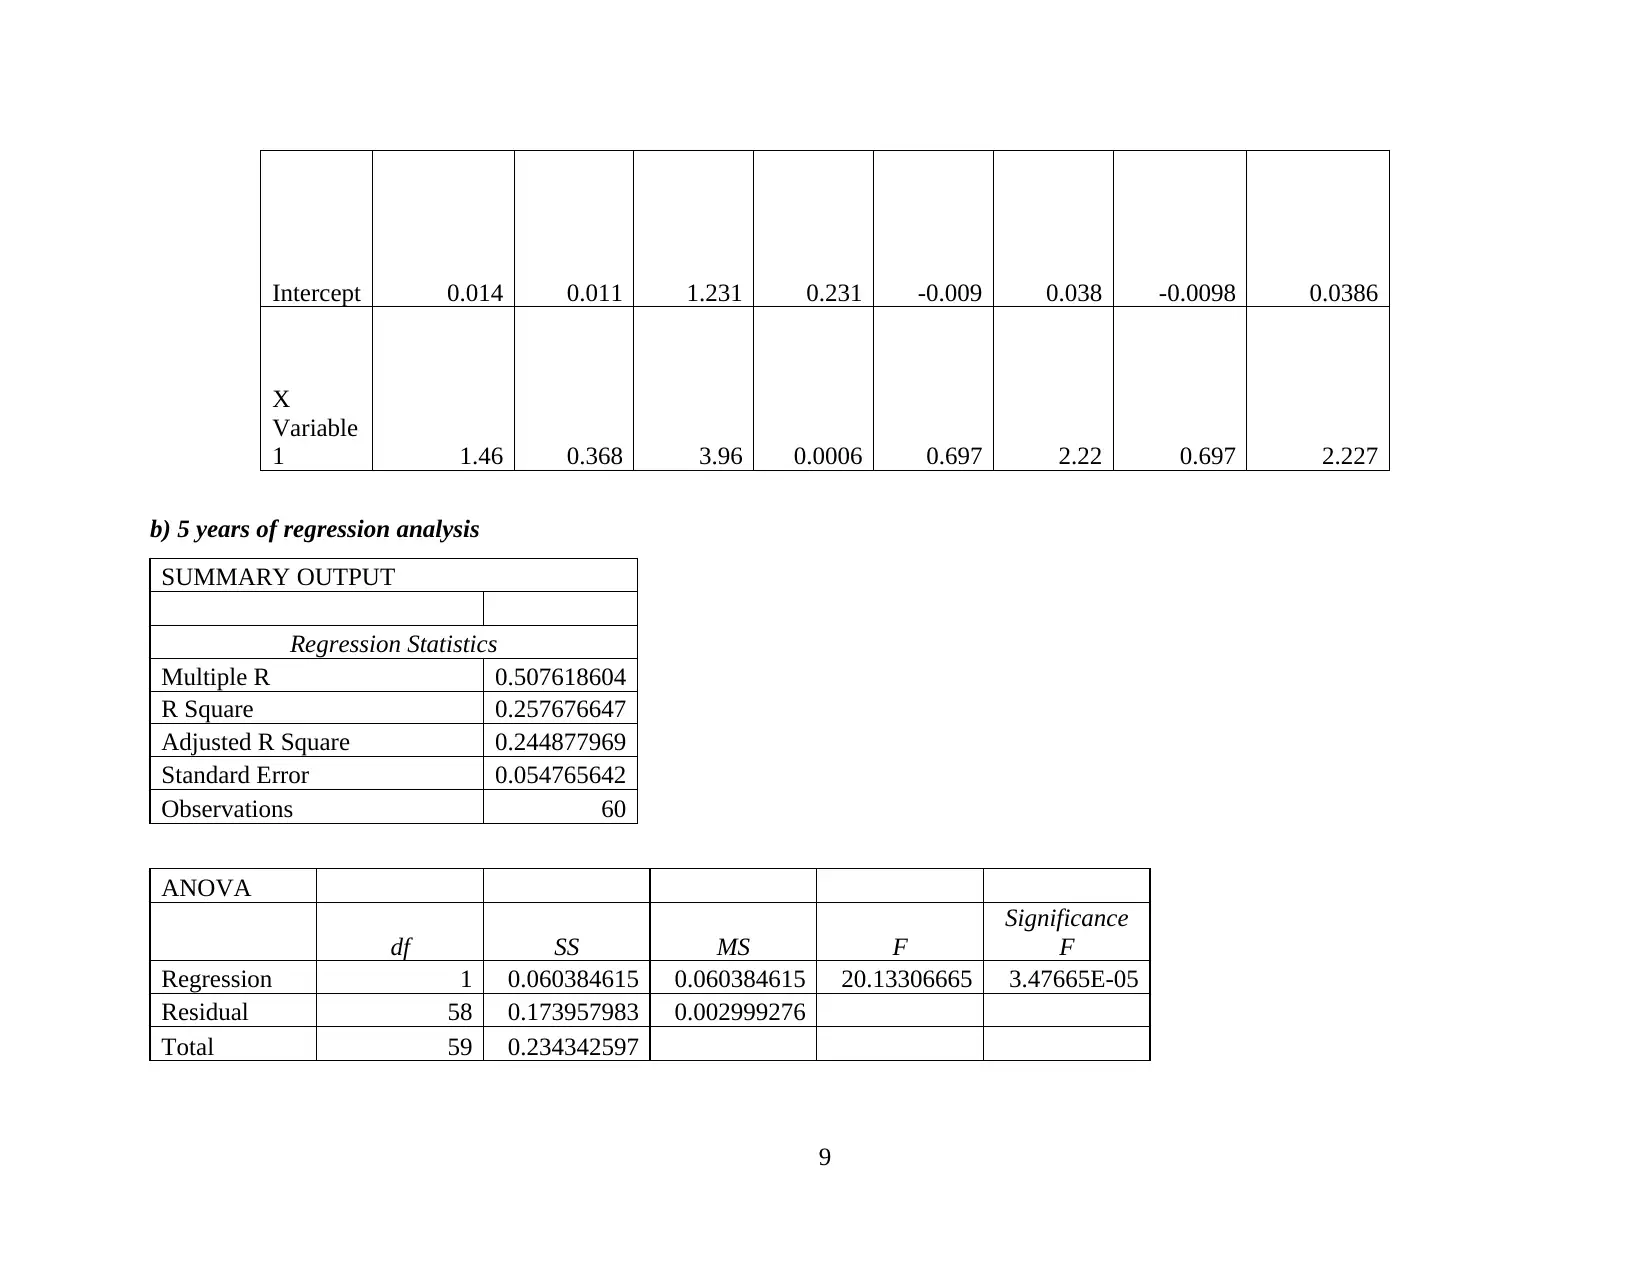
b) 5 years of regression analysis
SUMMARY OUTPUT
Regression Statistics
Multiple R 0.507618604
R Square 0.257676647
Adjusted R Square 0.244877969
Standard Error 0.054765642
Observations 60
ANOVA
df SS MS F
Significance
F
Regression 1 0.060384615 0.060384615 20.13306665 3.47665E-05
Residual 58 0.173957983 0.002999276
Total 59 0.234342597
9
X
Variable
1 1.46 0.368 3.96 0.0006 0.697 2.22 0.697 2.227
b) 5 years of regression analysis
SUMMARY OUTPUT
Regression Statistics
Multiple R 0.507618604
R Square 0.257676647
Adjusted R Square 0.244877969
Standard Error 0.054765642
Observations 60
ANOVA
df SS MS F
Significance
F
Regression 1 0.060384615 0.060384615 20.13306665 3.47665E-05
Residual 58 0.173957983 0.002999276
Total 59 0.234342597
9
Coefficients
Standard
Error t Stat P-value
Lower
95%
Upper
95%
Lower
95.0%
Upper
95.0%
Intercept 0.0075 0.007 1.027 0.308 -0.0071 0.022 -0.007 0.022
X
Variable
1 0.947 0.211 4.486 3.476 0.524 1.369 0.524 1.369
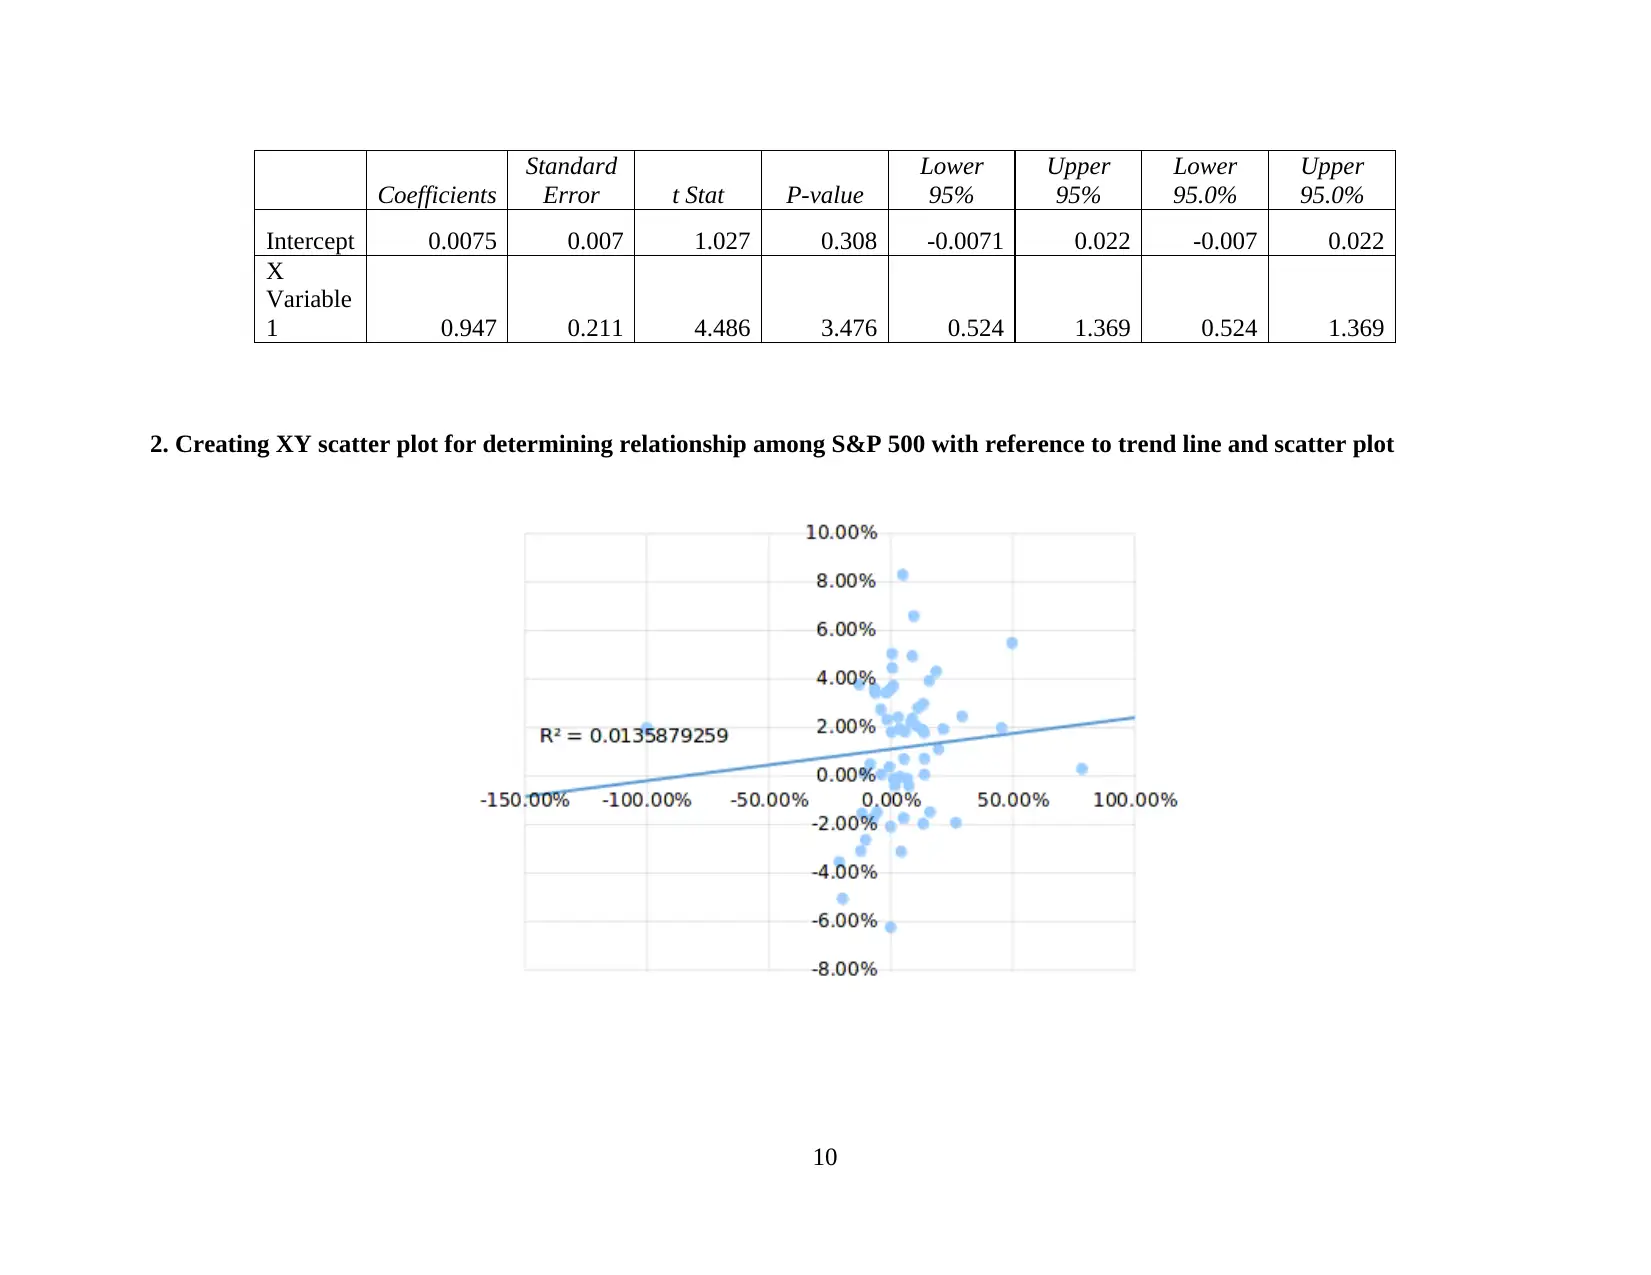
2. Creating XY scatter plot for determining relationship among S&P 500 with reference to trend line and scatter plot
10
Standard
Error t Stat P-value
Lower
95%
Upper
95%
Lower
95.0%
Upper
95.0%
Intercept 0.0075 0.007 1.027 0.308 -0.0071 0.022 -0.007 0.022
X
Variable
1 0.947 0.211 4.486 3.476 0.524 1.369 0.524 1.369
2. Creating XY scatter plot for determining relationship among S&P 500 with reference to trend line and scatter plot
10
⊘ This is a preview!⊘
Do you want full access?
Subscribe today to unlock all pages.
Trusted by 1+ million students worldwide
1 out of 23
Related Documents


Your All-in-One AI-Powered Toolkit for Academic Success.
+13062052269
info@desklib.com
Available 24*7 on WhatsApp / Email
![[object Object]](/_next/static/media/star-bottom.7253800d.svg)
Unlock your academic potential
Copyright © 2020–2026 A2Z Services. All Rights Reserved. Developed and managed by ZUCOL.