Financial Research Method for Ocado Plc: A Ten-Year Review
VerifiedAdded on 2020/05/16
|36
|8880
|155
Report
AI Summary
This report presents a comprehensive financial analysis of Ocado Group Plc, a prominent UK supermarket chain, examining its performance over a decade. The research employs secondary data to calculate and interpret key financial ratios, including profitability, liquidity, and efficiency metrics. Through univariate and trend analysis, the report assesses Ocado's financial health, comparing its performance with industry benchmarks. The findings reveal insights into the company's operational strategies and their impact on financial outcomes. The analysis covers return on capital employed (ROCE), return on assets (ROA), current ratio (CR), and other relevant ratios, providing a detailed understanding of Ocado's financial standing and identifying areas for improvement. The report concludes with recommendations to enhance operational activities and offers insights into the limitations of the study, suggesting avenues for future research.
Running head: FINANCIAL RESEARCH METHOD FOR OCADO PLC
Financial Research Method for Ocado Plc
Name of the Student:
Name of the University:
Author’s Note:
Financial Research Method for Ocado Plc
Name of the Student:
Name of the University:
Author’s Note:
Paraphrase This Document
Need a fresh take? Get an instant paraphrase of this document with our AI Paraphraser
1
FINANCIAL RESEARCH METHOD FOR OCADO PLC
Abstract
This research thesis has been constructed in order to have an understanding about the
financial performance of Ocado Group Plc, a famous supermarket chain that functions
primarily in United Kingdom. The aim of the thesis has been to recognise how the business
has been operating in the UK market and what has been their financial scenario for the past
ten years. This has been undertaken by examining the numerous functions and events that the
firm has been initiating. On the assessment of such events it becomes lucid that Ocado Plc
has looked to operate their business with the international and the domestic guidelines
constructed by the government and therefore, their financial performance has been in an
ethical manner. The data in accordance to Ocado Plc has been collected from secondary
sources and these sources have been used in order to gain the financial data. This data has
been used for the construction of the financial ratios of the company and these ratios have
been compared with the other companies that are existent in the market. This has been
influential in understanding the actual scenario of Ocado Plc and the factors that have an
influence on them. The final result have been helpful in completing the research and thereby
creating an idea about the performance of Ocado Plc and generation of the recommendations
that can improve the operational activities of the company.
2
FINANCIAL RESEARCH METHOD FOR OCADO PLC
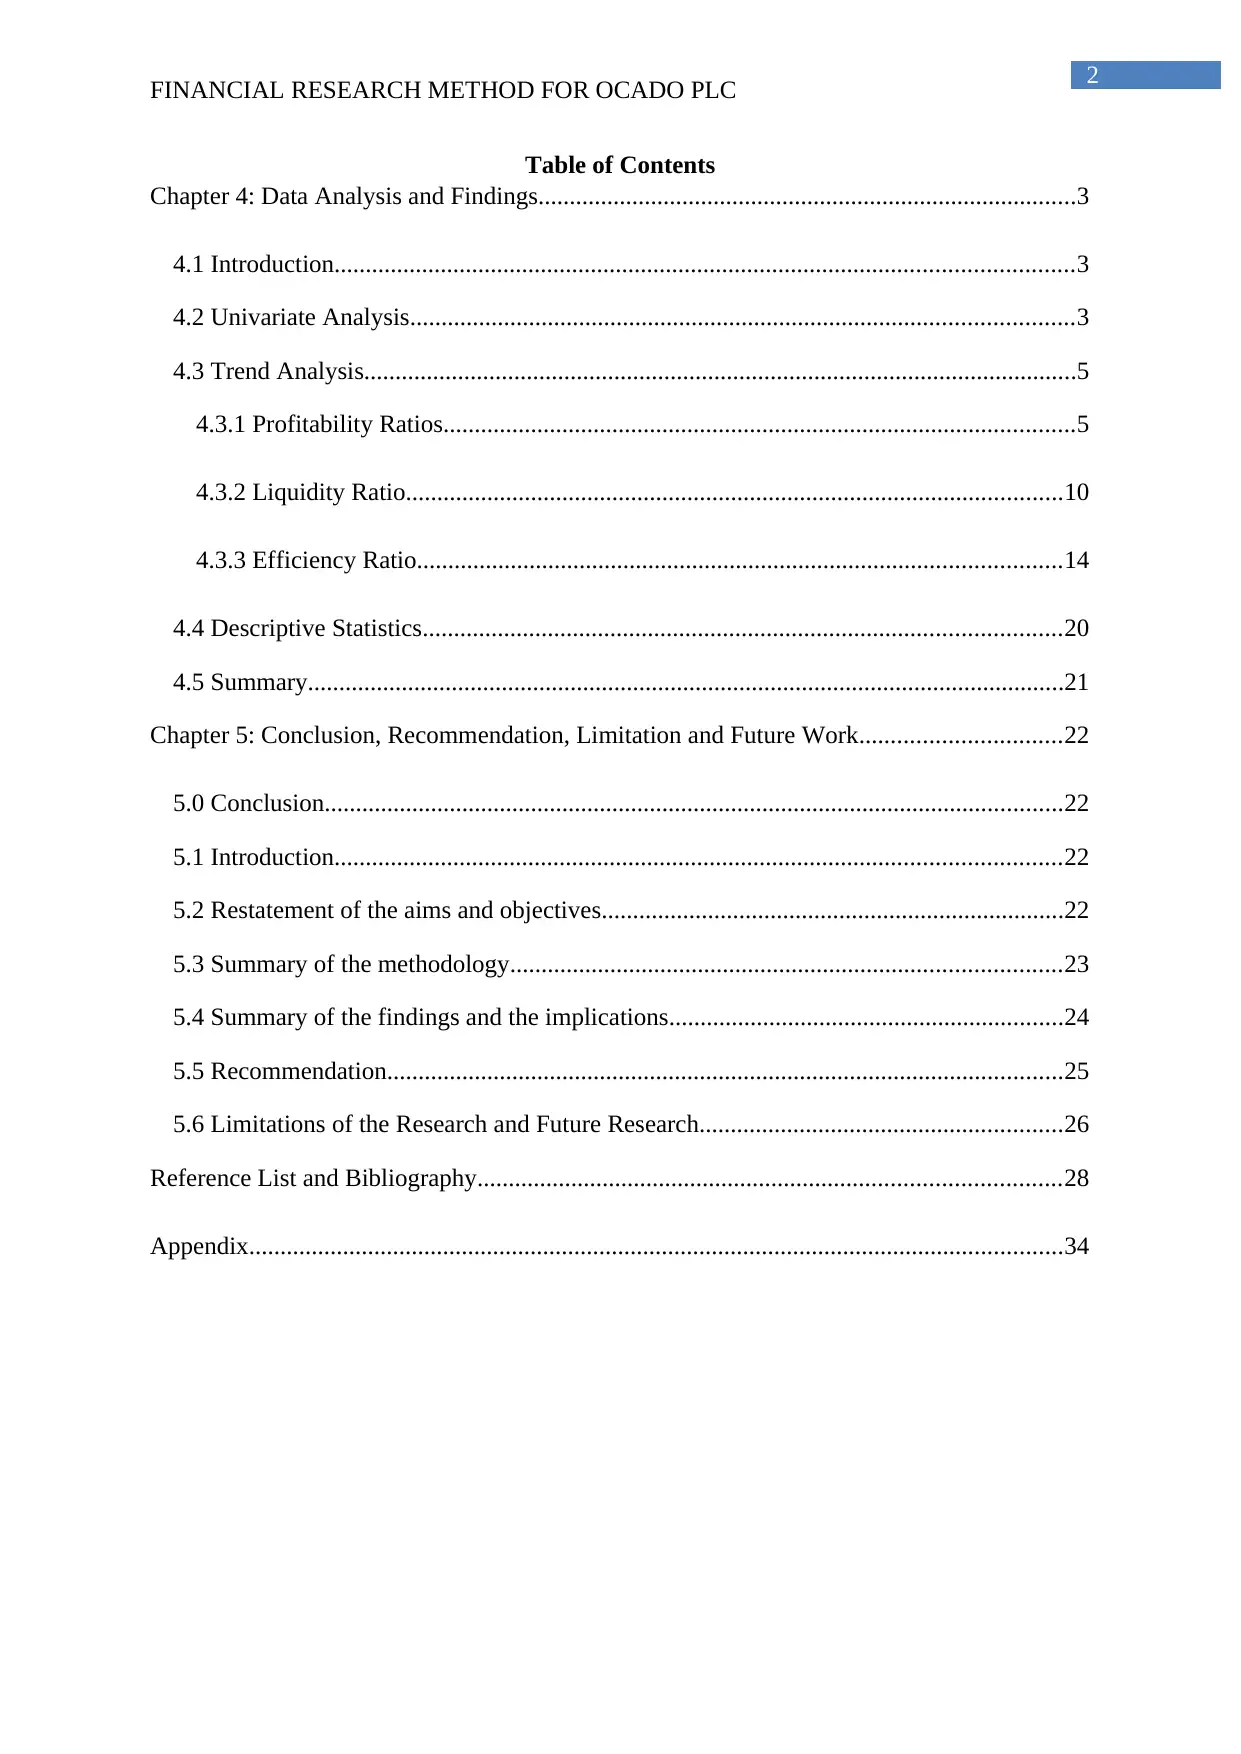
Table of Contents
Chapter 4: Data Analysis and Findings......................................................................................3
4.1 Introduction......................................................................................................................3
4.2 Univariate Analysis..........................................................................................................3
4.3 Trend Analysis..................................................................................................................5
4.3.1 Profitability Ratios.....................................................................................................5
4.3.2 Liquidity Ratio.........................................................................................................10
4.3.3 Efficiency Ratio.......................................................................................................14
4.4 Descriptive Statistics......................................................................................................20
4.5 Summary.........................................................................................................................21
Chapter 5: Conclusion, Recommendation, Limitation and Future Work................................22
5.0 Conclusion......................................................................................................................22
5.1 Introduction....................................................................................................................22
5.2 Restatement of the aims and objectives..........................................................................22
5.3 Summary of the methodology........................................................................................23
5.4 Summary of the findings and the implications...............................................................24
5.5 Recommendation............................................................................................................25
5.6 Limitations of the Research and Future Research..........................................................26
Reference List and Bibliography.............................................................................................28
Appendix..................................................................................................................................34
FINANCIAL RESEARCH METHOD FOR OCADO PLC
Table of Contents
Chapter 4: Data Analysis and Findings......................................................................................3
4.1 Introduction......................................................................................................................3
4.2 Univariate Analysis..........................................................................................................3
4.3 Trend Analysis..................................................................................................................5
4.3.1 Profitability Ratios.....................................................................................................5
4.3.2 Liquidity Ratio.........................................................................................................10
4.3.3 Efficiency Ratio.......................................................................................................14
4.4 Descriptive Statistics......................................................................................................20
4.5 Summary.........................................................................................................................21
Chapter 5: Conclusion, Recommendation, Limitation and Future Work................................22
5.0 Conclusion......................................................................................................................22
5.1 Introduction....................................................................................................................22
5.2 Restatement of the aims and objectives..........................................................................22
5.3 Summary of the methodology........................................................................................23
5.4 Summary of the findings and the implications...............................................................24
5.5 Recommendation............................................................................................................25
5.6 Limitations of the Research and Future Research..........................................................26
Reference List and Bibliography.............................................................................................28
Appendix..................................................................................................................................34
⊘ This is a preview!⊘
Do you want full access?
Subscribe today to unlock all pages.
Trusted by 1+ million students worldwide
3
FINANCIAL RESEARCH METHOD FOR OCADO PLC
Chapter 4: Data Analysis and Findings
4.1 Introduction
This section of the paper looks to assess the financial data that is available for Ocado
Plc and thereby undertake a comparison of the same in order to have an idea about the
changes that are taking place what are the areas for Ocado Plc that needs improvement in
accordance to the other companies existent in the industry. The paper would look to
undertake an assessment of the all the key ratios for Ocado Plc and thereby undertake an
action with the help of which the actual position of the company can be known. This segment
of the paper would therefore explain all the ratios individually in order to have an idea about
the financial scenario of Ocado Plc.
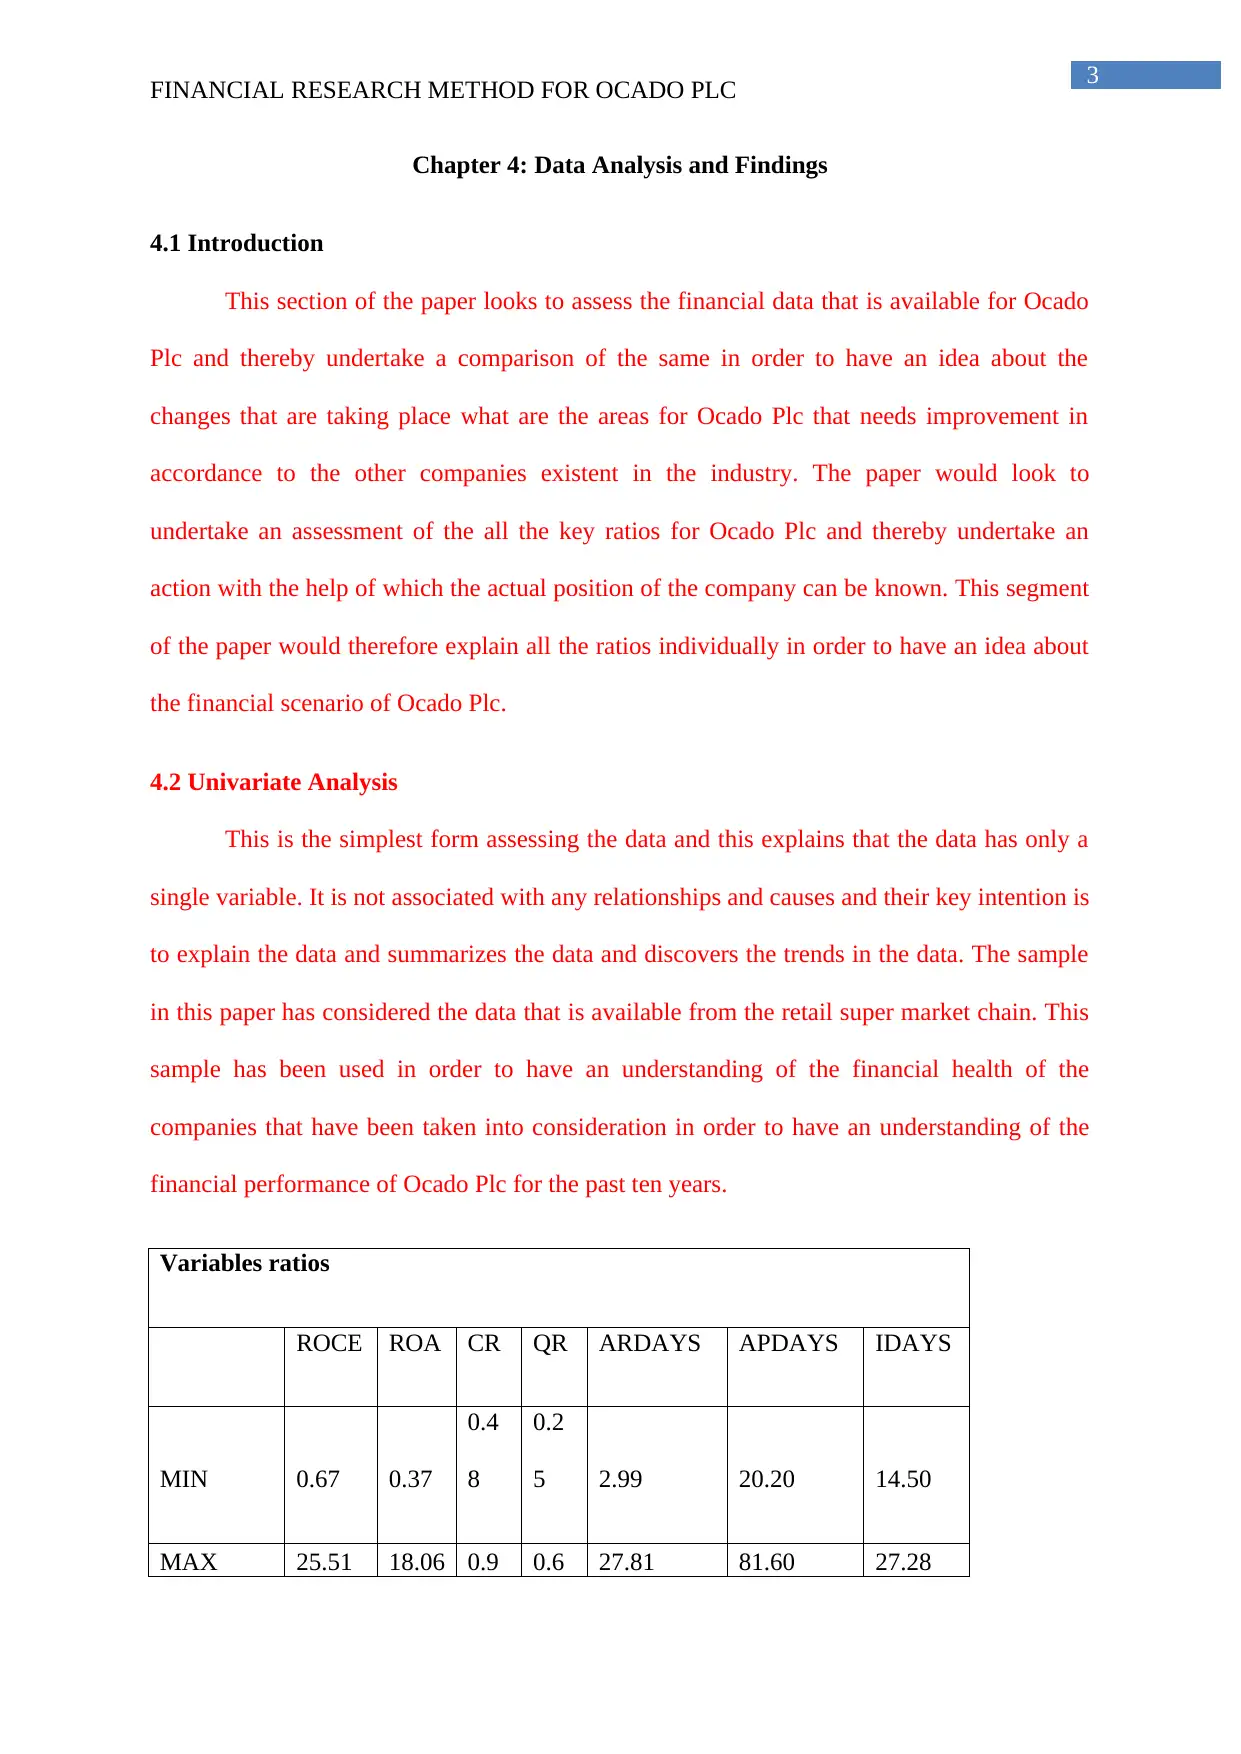
4.2 Univariate Analysis
This is the simplest form assessing the data and this explains that the data has only a
single variable. It is not associated with any relationships and causes and their key intention is
to explain the data and summarizes the data and discovers the trends in the data. The sample
in this paper has considered the data that is available from the retail super market chain. This
sample has been used in order to have an understanding of the financial health of the
companies that have been taken into consideration in order to have an understanding of the
financial performance of Ocado Plc for the past ten years.
Variables ratios
ROCE ROA CR QR ARDAYS APDAYS IDAYS
MIN 0.67 0.37
0.4
8
0.2
5 2.99 20.20 14.50
MAX 25.51 18.06 0.9 0.6 27.81 81.60 27.28
FINANCIAL RESEARCH METHOD FOR OCADO PLC
Chapter 4: Data Analysis and Findings
4.1 Introduction
This section of the paper looks to assess the financial data that is available for Ocado
Plc and thereby undertake a comparison of the same in order to have an idea about the
changes that are taking place what are the areas for Ocado Plc that needs improvement in
accordance to the other companies existent in the industry. The paper would look to
undertake an assessment of the all the key ratios for Ocado Plc and thereby undertake an
action with the help of which the actual position of the company can be known. This segment
of the paper would therefore explain all the ratios individually in order to have an idea about
the financial scenario of Ocado Plc.
4.2 Univariate Analysis
This is the simplest form assessing the data and this explains that the data has only a
single variable. It is not associated with any relationships and causes and their key intention is
to explain the data and summarizes the data and discovers the trends in the data. The sample
in this paper has considered the data that is available from the retail super market chain. This
sample has been used in order to have an understanding of the financial health of the
companies that have been taken into consideration in order to have an understanding of the
financial performance of Ocado Plc for the past ten years.
Variables ratios
ROCE ROA CR QR ARDAYS APDAYS IDAYS
MIN 0.67 0.37
0.4
8
0.2
5 2.99 20.20 14.50
MAX 25.51 18.06 0.9 0.6 27.81 81.60 27.28
Paraphrase This Document
Need a fresh take? Get an instant paraphrase of this document with our AI Paraphraser
4
FINANCIAL RESEARCH METHOD FOR OCADO PLC
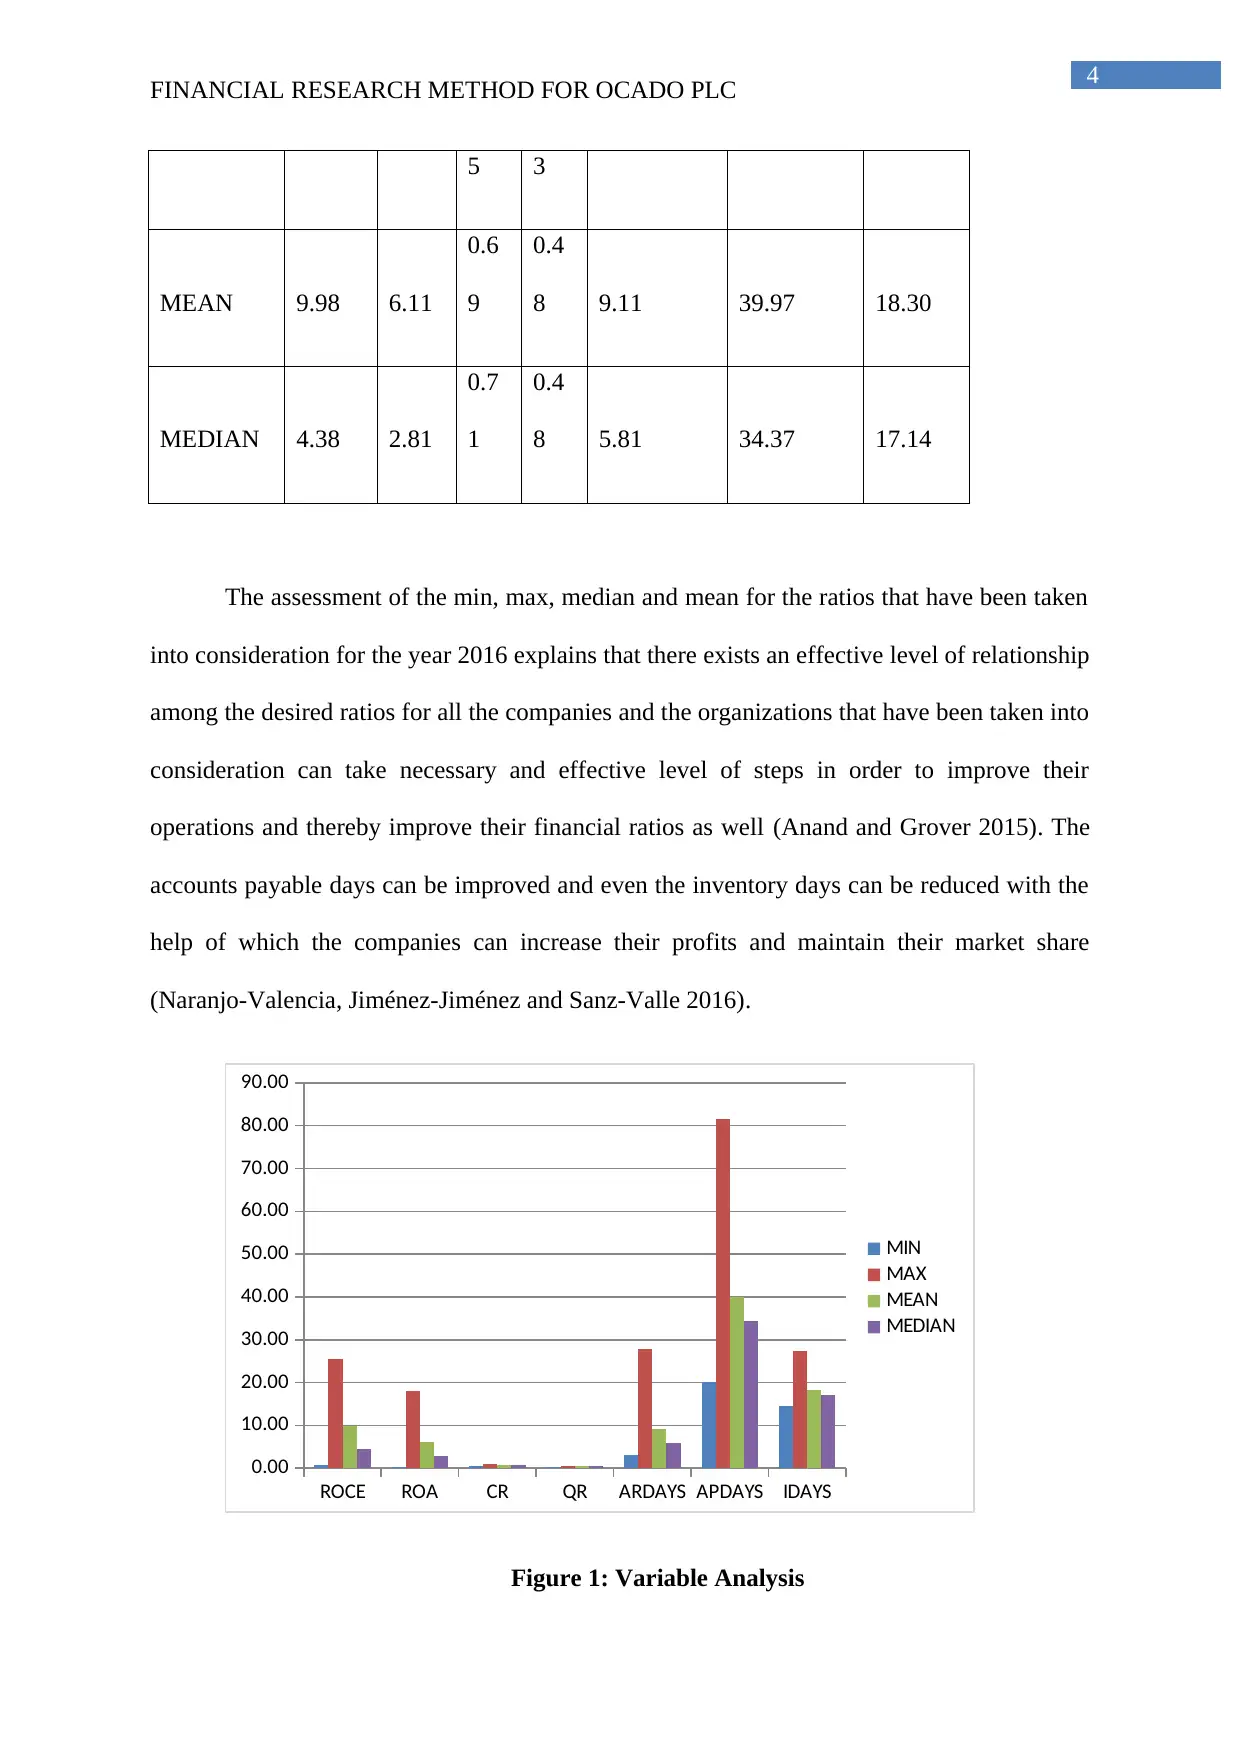
5 3
MEAN 9.98 6.11
0.6
9
0.4
8 9.11 39.97 18.30
MEDIAN 4.38 2.81
0.7
1
0.4
8 5.81 34.37 17.14
The assessment of the min, max, median and mean for the ratios that have been taken
into consideration for the year 2016 explains that there exists an effective level of relationship
among the desired ratios for all the companies and the organizations that have been taken into
consideration can take necessary and effective level of steps in order to improve their
operations and thereby improve their financial ratios as well (Anand and Grover 2015). The
accounts payable days can be improved and even the inventory days can be reduced with the
help of which the companies can increase their profits and maintain their market share
(Naranjo-Valencia, Jiménez-Jiménez and Sanz-Valle 2016).
ROCE ROA CR QR ARDAYS APDAYS IDAYS
0.00
10.00
20.00
30.00
40.00
50.00
60.00
70.00
80.00
90.00
MIN
MAX
MEAN
MEDIAN
Figure 1: Variable Analysis
FINANCIAL RESEARCH METHOD FOR OCADO PLC
5 3
MEAN 9.98 6.11
0.6
9
0.4
8 9.11 39.97 18.30
MEDIAN 4.38 2.81
0.7
1
0.4
8 5.81 34.37 17.14
The assessment of the min, max, median and mean for the ratios that have been taken
into consideration for the year 2016 explains that there exists an effective level of relationship
among the desired ratios for all the companies and the organizations that have been taken into
consideration can take necessary and effective level of steps in order to improve their
operations and thereby improve their financial ratios as well (Anand and Grover 2015). The
accounts payable days can be improved and even the inventory days can be reduced with the
help of which the companies can increase their profits and maintain their market share
(Naranjo-Valencia, Jiménez-Jiménez and Sanz-Valle 2016).
ROCE ROA CR QR ARDAYS APDAYS IDAYS
0.00
10.00
20.00
30.00
40.00
50.00
60.00
70.00
80.00
90.00
MIN
MAX
MEAN
MEDIAN
Figure 1: Variable Analysis
5
FINANCIAL RESEARCH METHOD FOR OCADO PLC
(Source: As Created By the Author)
4.3 Trend Analysis
This section looks to explain the financial ratios of Ocado Plc for the last ten years
and even looks to make a comparison with the other selected super market chains so that the
objective of the paper can be met. The objective of the paper has been to understand the
financial performance of Ocado Plc.
4.3.1 Profitability Ratios
This is a measure that looks to compute the profitability which is a process to
understand the performance of the company. Profitability is simply the ability to make profit
and the profit is the amount that is left from the income gained after the deductions from the
expenses and the costs associated with the income that is earned (Cho et al. 2015).
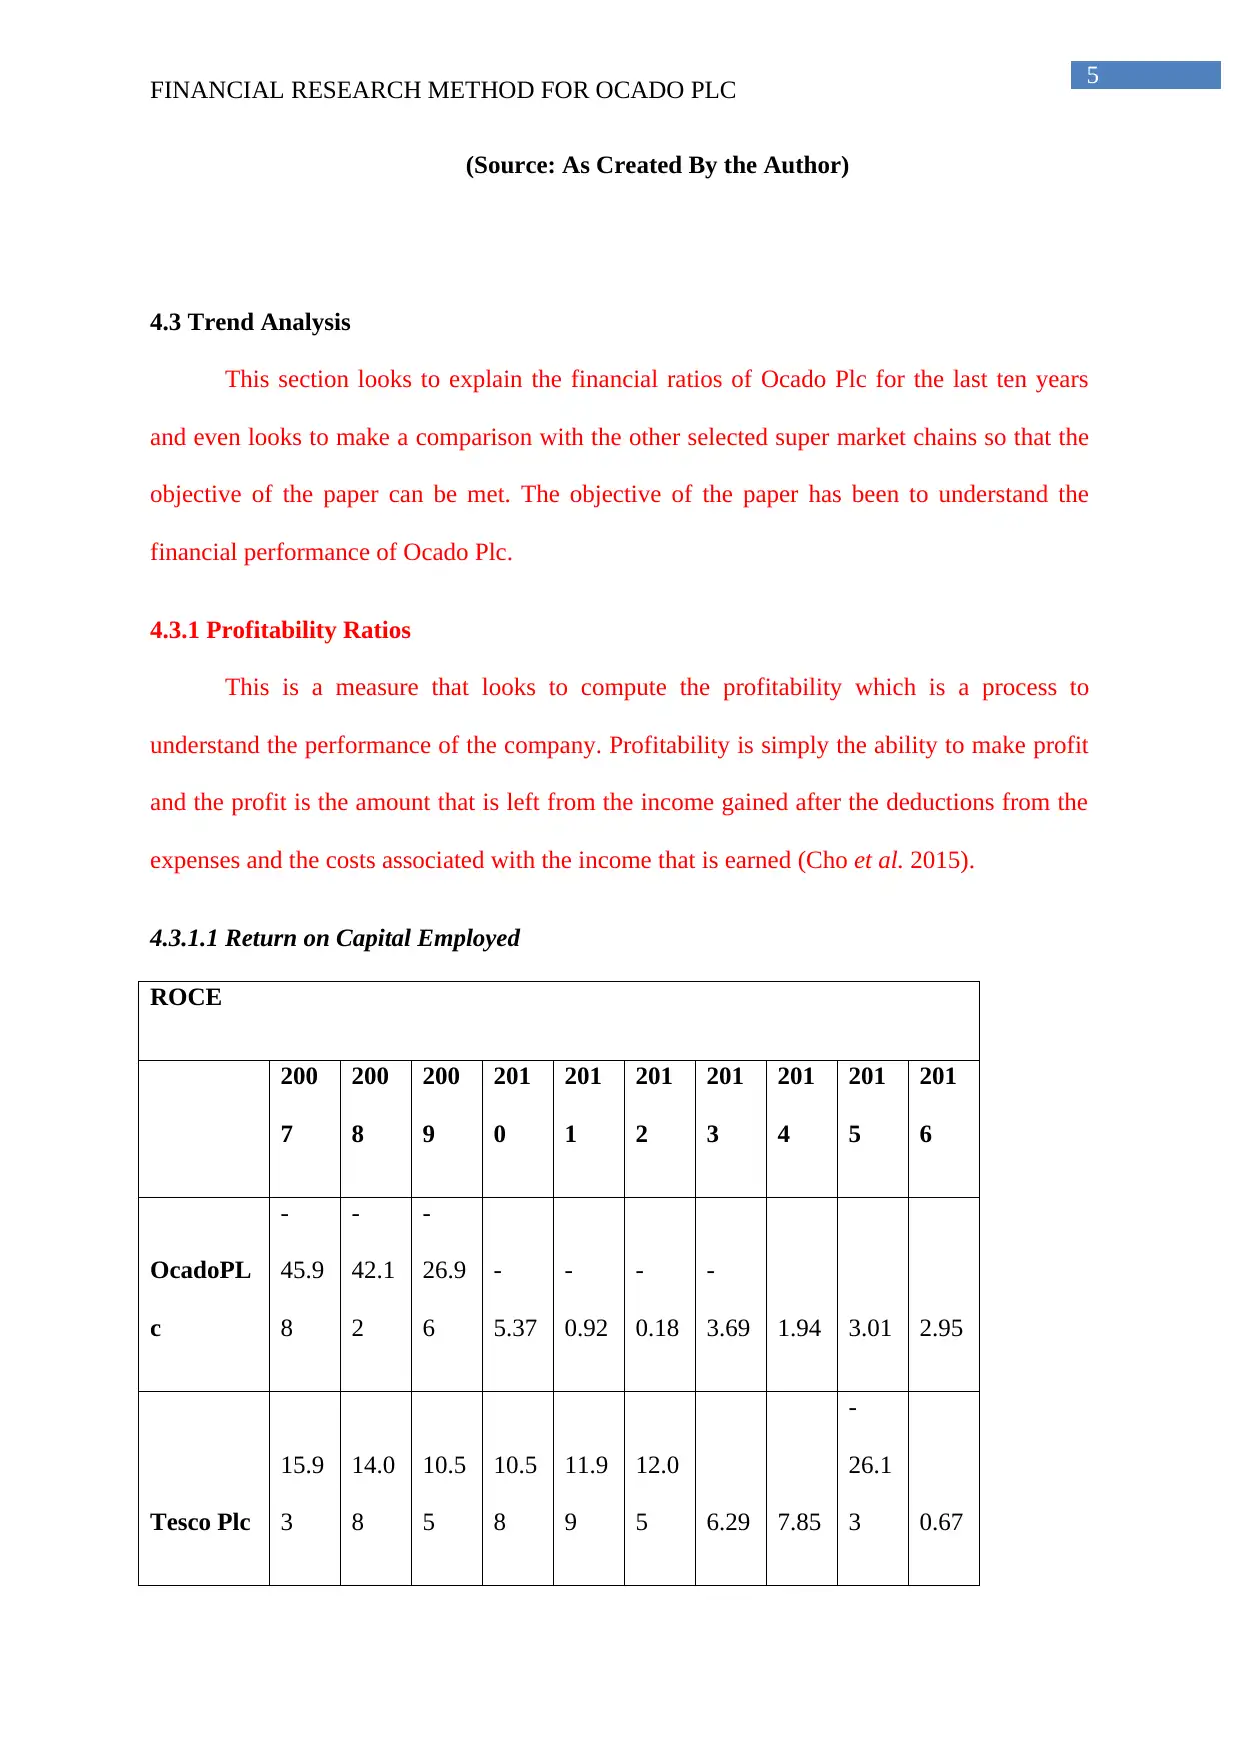
4.3.1.1 Return on Capital Employed
ROCE
200
7
200
8
200
9
201
0
201
1
201
2
201
3
201
4
201
5
201
6
OcadoPL
c
-
45.9
8
-
42.1
2
-
26.9
6
-
5.37
-
0.92
-
0.18
-
3.69 1.94 3.01 2.95
Tesco Plc
15.9
3
14.0
8
10.5
5
10.5
8
11.9
9
12.0
5 6.29 7.85
-
26.1
3 0.67
FINANCIAL RESEARCH METHOD FOR OCADO PLC
(Source: As Created By the Author)
4.3 Trend Analysis
This section looks to explain the financial ratios of Ocado Plc for the last ten years
and even looks to make a comparison with the other selected super market chains so that the
objective of the paper can be met. The objective of the paper has been to understand the
financial performance of Ocado Plc.
4.3.1 Profitability Ratios
This is a measure that looks to compute the profitability which is a process to
understand the performance of the company. Profitability is simply the ability to make profit
and the profit is the amount that is left from the income gained after the deductions from the
expenses and the costs associated with the income that is earned (Cho et al. 2015).
4.3.1.1 Return on Capital Employed
ROCE
200
7
200
8
200
9
201
0
201
1
201
2
201
3
201
4
201
5
201
6
OcadoPL
c
-
45.9
8
-
42.1
2
-
26.9
6
-
5.37
-
0.92
-
0.18
-
3.69 1.94 3.01 2.95
Tesco Plc
15.9
3
14.0
8
10.5
5
10.5
8
11.9
9
12.0
5 6.29 7.85
-
26.1
3 0.67
⊘ This is a preview!⊘
Do you want full access?
Subscribe today to unlock all pages.
Trusted by 1+ million students worldwide
6
FINANCIAL RESEARCH METHOD FOR OCADO PLC
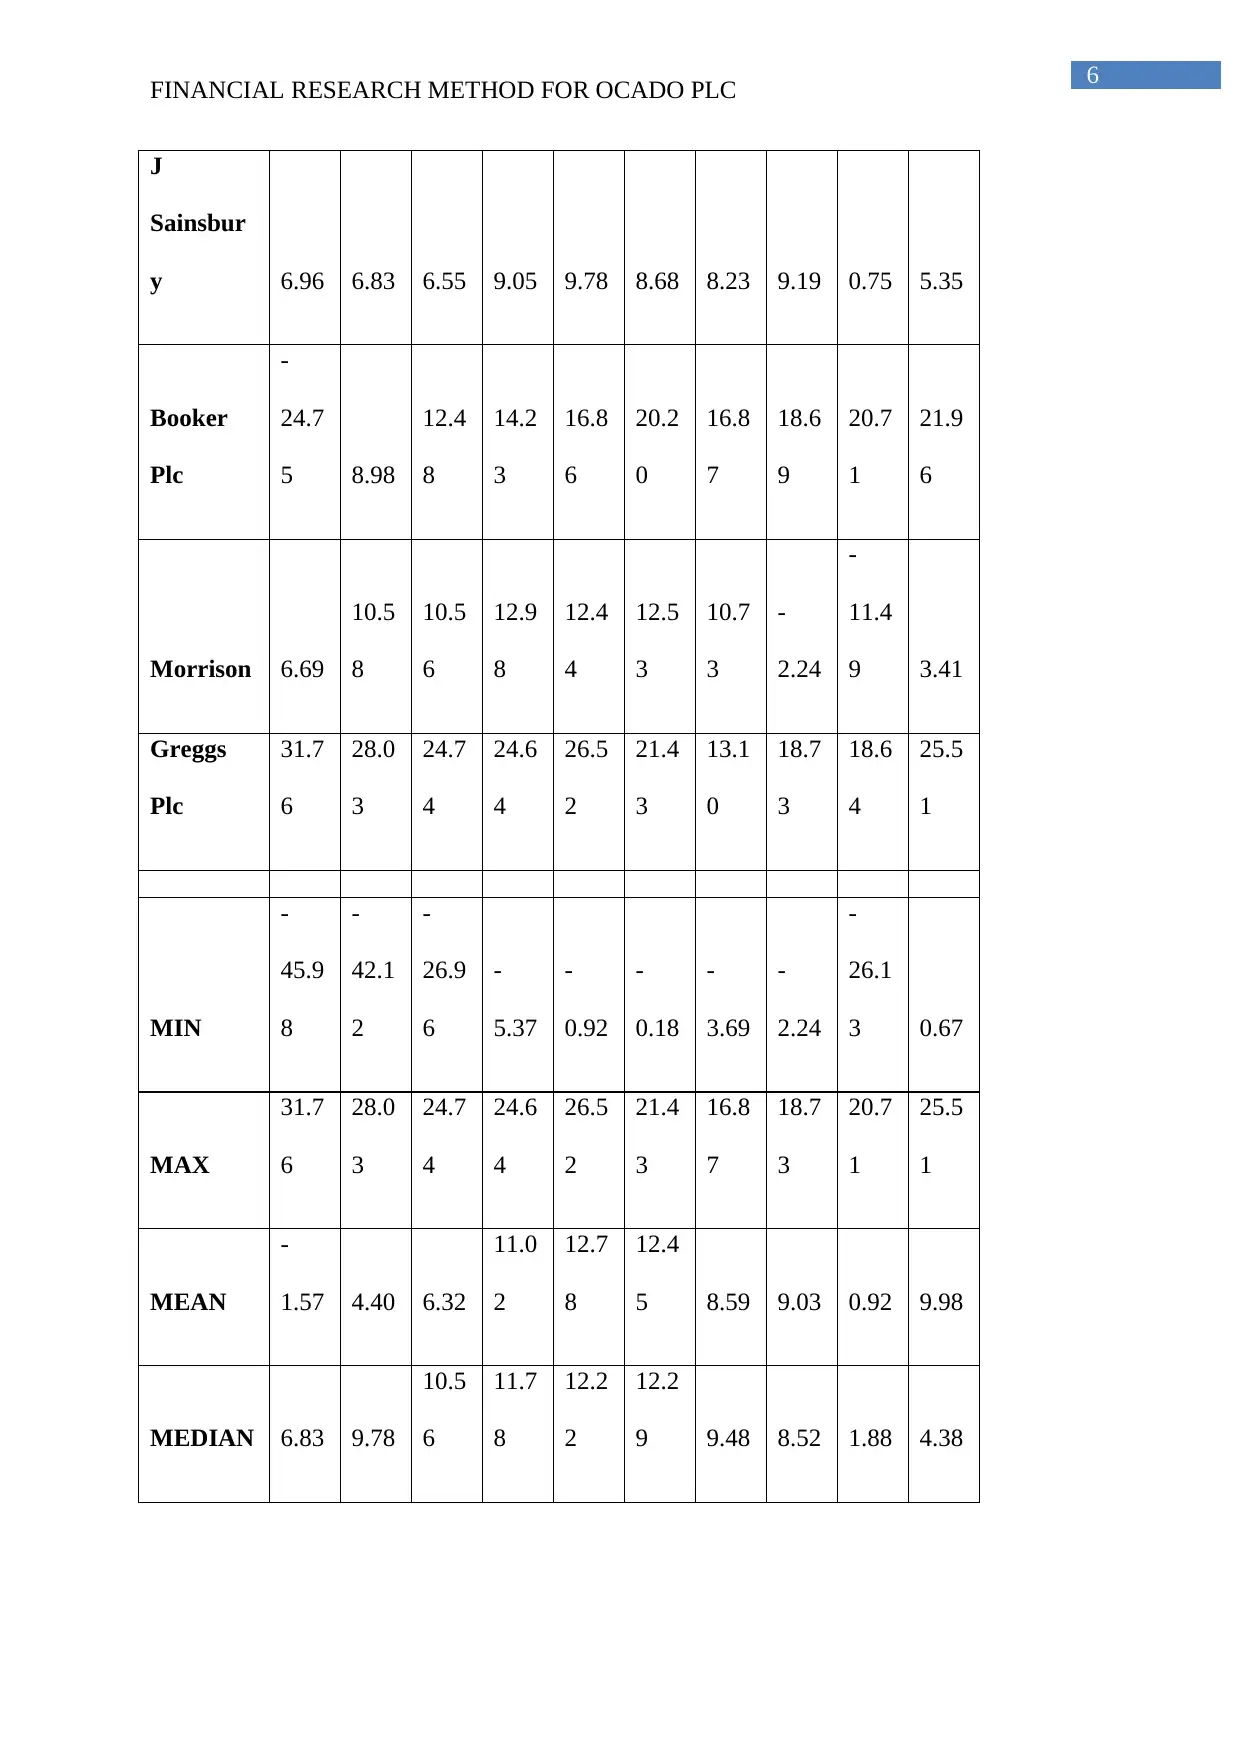
J
Sainsbur
y 6.96 6.83 6.55 9.05 9.78 8.68 8.23 9.19 0.75 5.35
Booker
Plc
-
24.7
5 8.98
12.4
8
14.2
3
16.8
6
20.2
0
16.8
7
18.6
9
20.7
1
21.9
6
Morrison 6.69
10.5
8
10.5
6
12.9
8
12.4
4
12.5
3
10.7
3
-
2.24
-
11.4
9 3.41
Greggs
Plc
31.7
6
28.0
3
24.7
4
24.6
4
26.5
2
21.4
3
13.1
0
18.7
3
18.6
4
25.5
1
MIN
-
45.9
8
-
42.1
2
-
26.9
6
-
5.37
-
0.92
-
0.18
-
3.69
-
2.24
-
26.1
3 0.67
MAX
31.7
6
28.0
3
24.7
4
24.6
4
26.5
2
21.4
3
16.8
7
18.7
3
20.7
1
25.5
1
MEAN
-
1.57 4.40 6.32
11.0
2
12.7
8
12.4
5 8.59 9.03 0.92 9.98
MEDIAN 6.83 9.78
10.5
6
11.7
8
12.2
2
12.2
9 9.48 8.52 1.88 4.38
FINANCIAL RESEARCH METHOD FOR OCADO PLC
J
Sainsbur
y 6.96 6.83 6.55 9.05 9.78 8.68 8.23 9.19 0.75 5.35
Booker
Plc
-
24.7
5 8.98
12.4
8
14.2
3
16.8
6
20.2
0
16.8
7
18.6
9
20.7
1
21.9
6
Morrison 6.69
10.5
8
10.5
6
12.9
8
12.4
4
12.5
3
10.7
3
-
2.24
-
11.4
9 3.41
Greggs
Plc
31.7
6
28.0
3
24.7
4
24.6
4
26.5
2
21.4
3
13.1
0
18.7
3
18.6
4
25.5
1
MIN
-
45.9
8
-
42.1
2
-
26.9
6
-
5.37
-
0.92
-
0.18
-
3.69
-
2.24
-
26.1
3 0.67
MAX
31.7
6
28.0
3
24.7
4
24.6
4
26.5
2
21.4
3
16.8
7
18.7
3
20.7
1
25.5
1
MEAN
-
1.57 4.40 6.32
11.0
2
12.7
8
12.4
5 8.59 9.03 0.92 9.98
MEDIAN 6.83 9.78
10.5
6
11.7
8
12.2
2
12.2
9 9.48 8.52 1.88 4.38
Paraphrase This Document
Need a fresh take? Get an instant paraphrase of this document with our AI Paraphraser
7
FINANCIAL RESEARCH METHOD FOR OCADO PLC
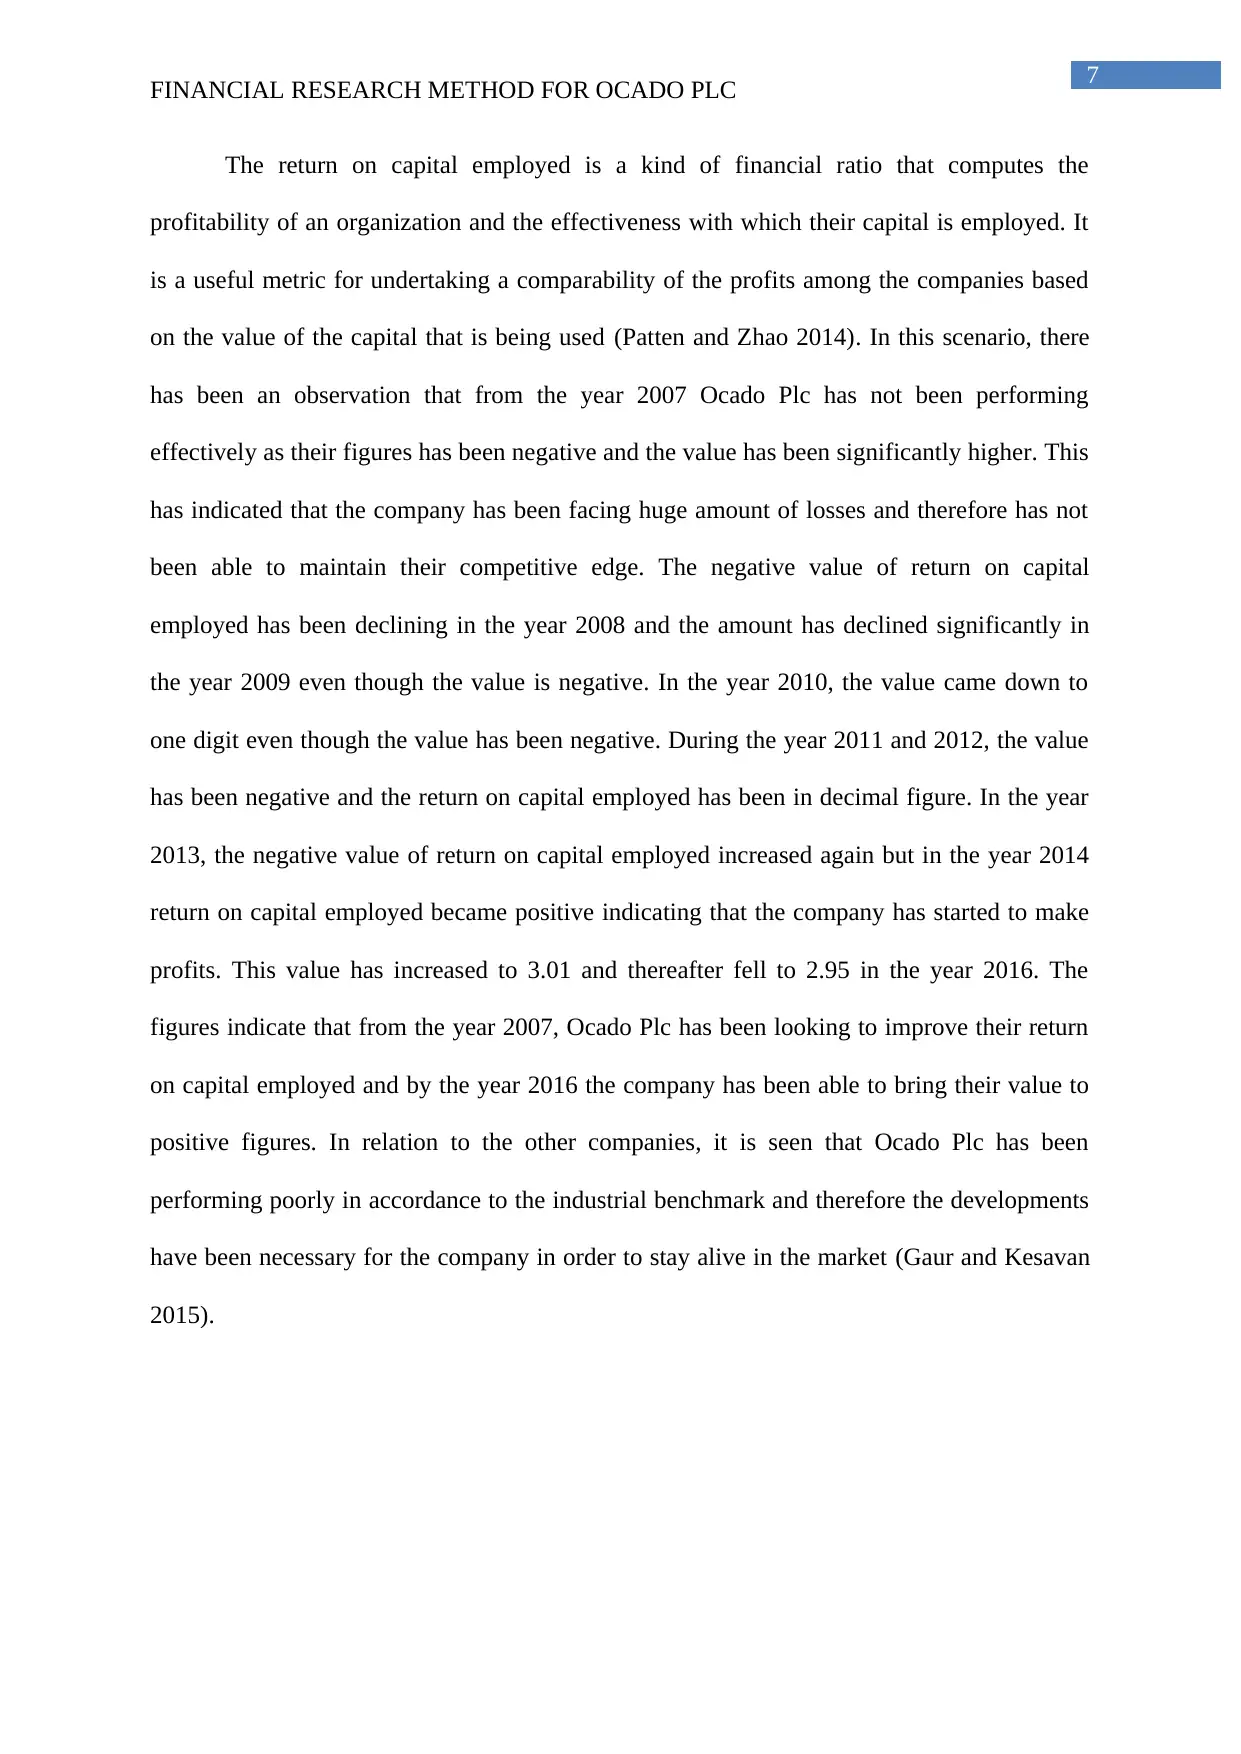
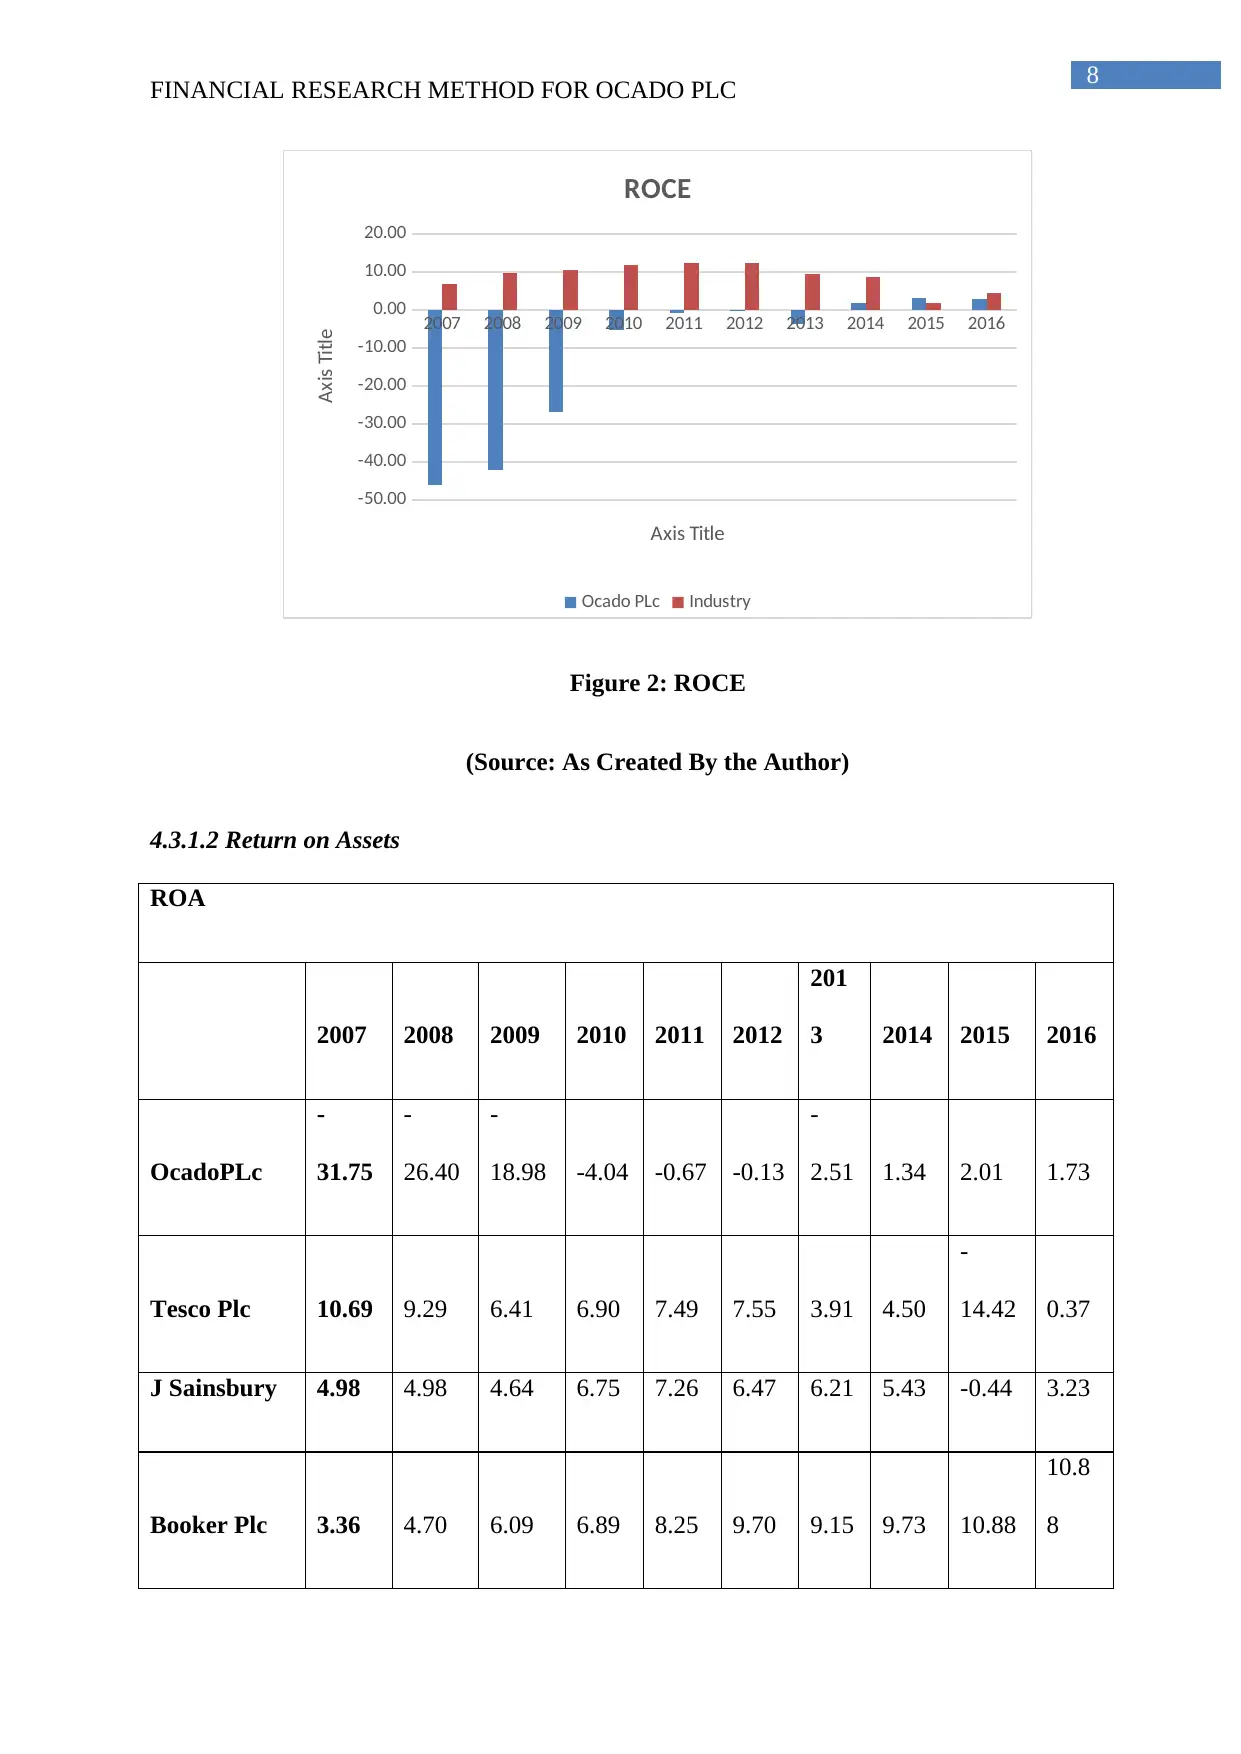
The return on capital employed is a kind of financial ratio that computes the
profitability of an organization and the effectiveness with which their capital is employed. It
is a useful metric for undertaking a comparability of the profits among the companies based
on the value of the capital that is being used (Patten and Zhao 2014). In this scenario, there
has been an observation that from the year 2007 Ocado Plc has not been performing
effectively as their figures has been negative and the value has been significantly higher. This
has indicated that the company has been facing huge amount of losses and therefore has not
been able to maintain their competitive edge. The negative value of return on capital
employed has been declining in the year 2008 and the amount has declined significantly in
the year 2009 even though the value is negative. In the year 2010, the value came down to
one digit even though the value has been negative. During the year 2011 and 2012, the value
has been negative and the return on capital employed has been in decimal figure. In the year
2013, the negative value of return on capital employed increased again but in the year 2014
return on capital employed became positive indicating that the company has started to make
profits. This value has increased to 3.01 and thereafter fell to 2.95 in the year 2016. The
figures indicate that from the year 2007, Ocado Plc has been looking to improve their return
on capital employed and by the year 2016 the company has been able to bring their value to
positive figures. In relation to the other companies, it is seen that Ocado Plc has been
performing poorly in accordance to the industrial benchmark and therefore the developments
have been necessary for the company in order to stay alive in the market (Gaur and Kesavan
2015).
FINANCIAL RESEARCH METHOD FOR OCADO PLC
The return on capital employed is a kind of financial ratio that computes the
profitability of an organization and the effectiveness with which their capital is employed. It
is a useful metric for undertaking a comparability of the profits among the companies based
on the value of the capital that is being used (Patten and Zhao 2014). In this scenario, there
has been an observation that from the year 2007 Ocado Plc has not been performing
effectively as their figures has been negative and the value has been significantly higher. This
has indicated that the company has been facing huge amount of losses and therefore has not
been able to maintain their competitive edge. The negative value of return on capital
employed has been declining in the year 2008 and the amount has declined significantly in
the year 2009 even though the value is negative. In the year 2010, the value came down to
one digit even though the value has been negative. During the year 2011 and 2012, the value
has been negative and the return on capital employed has been in decimal figure. In the year
2013, the negative value of return on capital employed increased again but in the year 2014
return on capital employed became positive indicating that the company has started to make
profits. This value has increased to 3.01 and thereafter fell to 2.95 in the year 2016. The
figures indicate that from the year 2007, Ocado Plc has been looking to improve their return
on capital employed and by the year 2016 the company has been able to bring their value to
positive figures. In relation to the other companies, it is seen that Ocado Plc has been
performing poorly in accordance to the industrial benchmark and therefore the developments
have been necessary for the company in order to stay alive in the market (Gaur and Kesavan
2015).
8
FINANCIAL RESEARCH METHOD FOR OCADO PLC
2007 2008 2009 2010 2011 2012 2013 2014 2015 2016
-50.00
-40.00
-30.00
-20.00
-10.00
0.00
10.00
20.00
ROCE
Ocado PLc Industry
Axis Title
Axis Title
Figure 2: ROCE
(Source: As Created By the Author)
4.3.1.2 Return on Assets
ROA
2007 2008 2009 2010 2011 2012
201
3 2014 2015 2016
OcadoPLc
-
31.75
-
26.40
-
18.98 -4.04 -0.67 -0.13
-
2.51 1.34 2.01 1.73
Tesco Plc 10.69 9.29 6.41 6.90 7.49 7.55 3.91 4.50
-
14.42 0.37
J Sainsbury 4.98 4.98 4.64 6.75 7.26 6.47 6.21 5.43 -0.44 3.23
Booker Plc 3.36 4.70 6.09 6.89 8.25 9.70 9.15 9.73 10.88
10.8
8
⊘ This is a preview!⊘
Do you want full access?
Subscribe today to unlock all pages.
Trusted by 1+ million students worldwide
9
FINANCIAL RESEARCH METHOD FOR OCADO PLC
Morrison 5.01 8.01 7.96 9.79 9.59 9.61 8.35 -1.64 -8.64 2.38
Greggs Plc 21.47 28.03 17.56
17.4
6
19.5
8
16.2
5 9.93
13.4
8 13.55
18.0
6
MIN
-
31.75
-
26.40
-
18.98 -4.04 -0.67 -0.13
-
2.51 -1.64
-
14.42 0.37
MAX 21.47 28.03 17.56
17.4
6
19.5
8
16.2
5 9.93
13.4
8 13.55
18.0
6
MEAN 2.29 4.77 3.95 7.29 8.58 8.24 5.84 5.47 0.49 6.11
MEDIAN 4.995 6.50 6.25 6.90 7.87 8.58 7.28 4.97 0.79 2.81
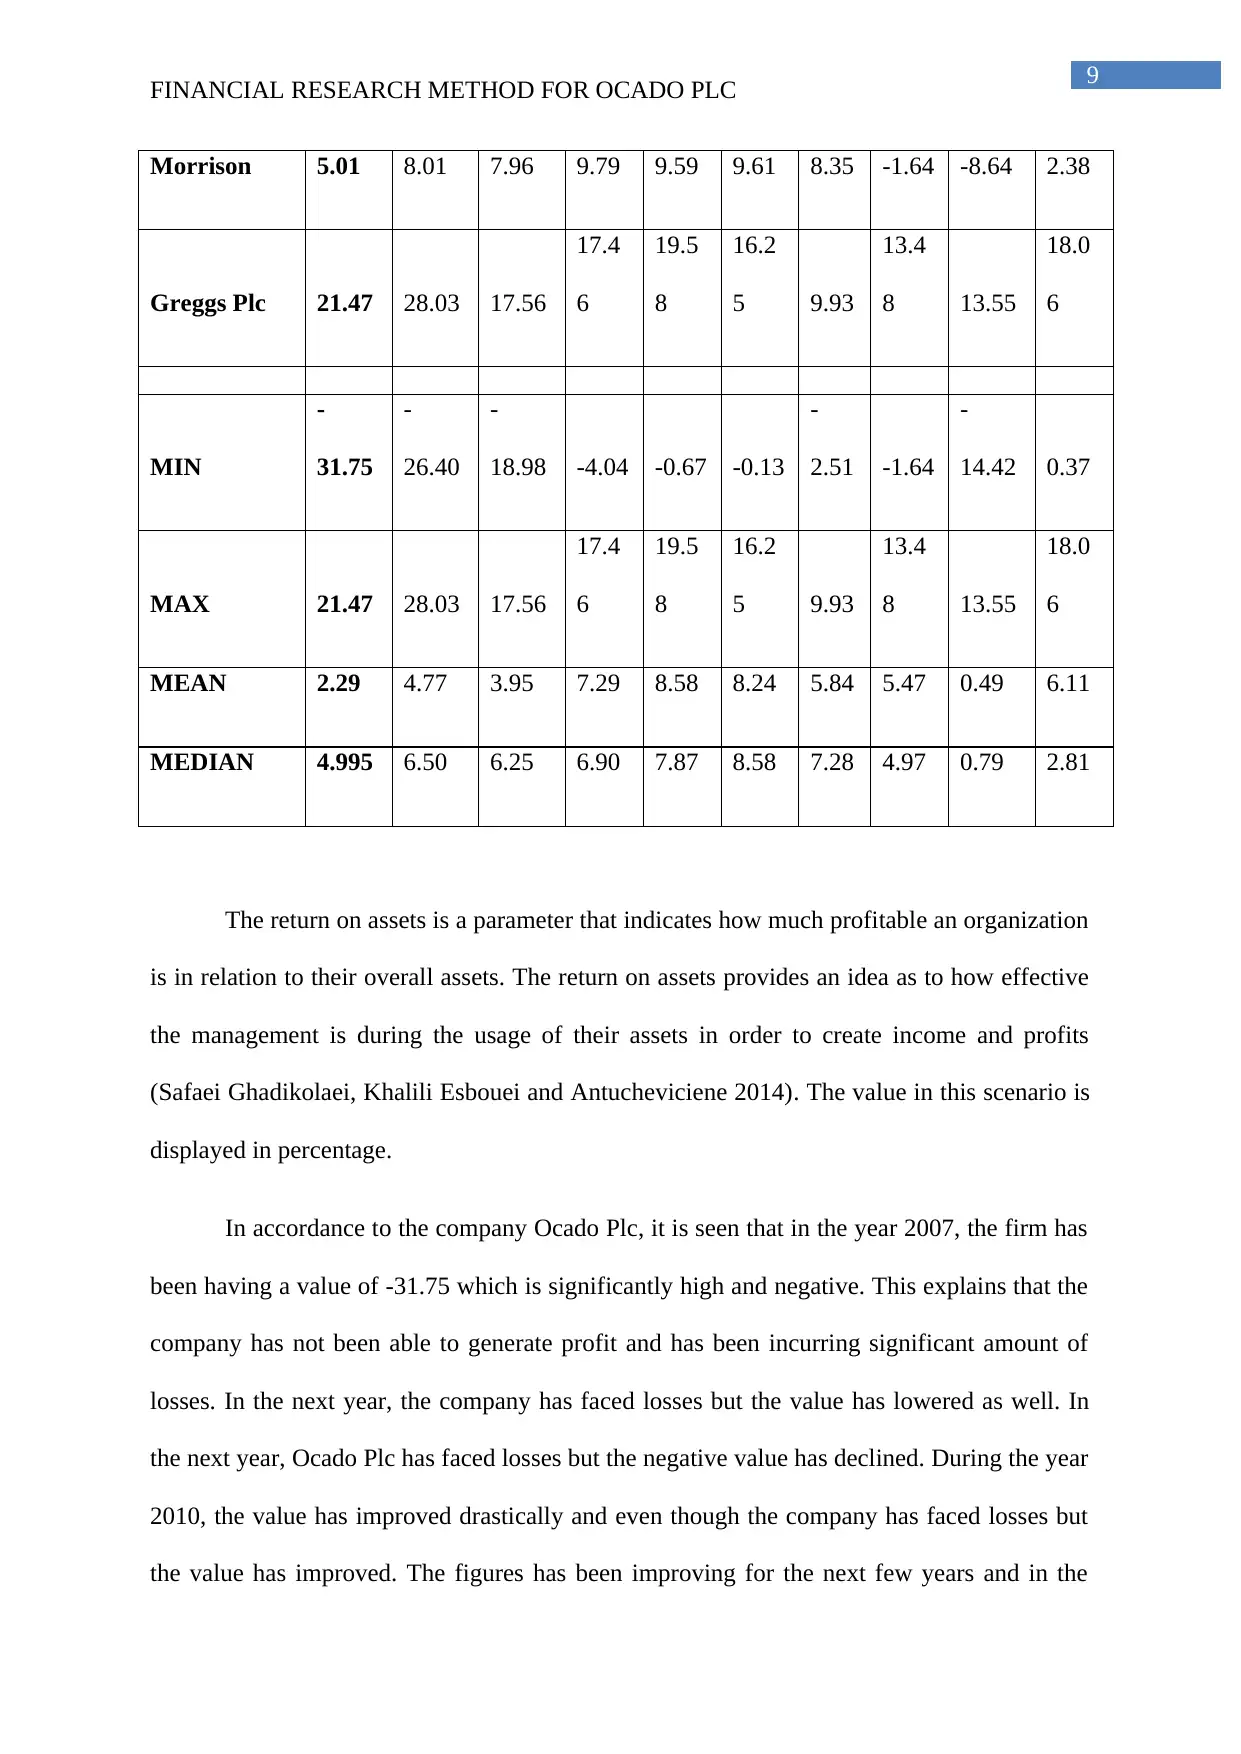
The return on assets is a parameter that indicates how much profitable an organization
is in relation to their overall assets. The return on assets provides an idea as to how effective
the management is during the usage of their assets in order to create income and profits
(Safaei Ghadikolaei, Khalili Esbouei and Antucheviciene 2014). The value in this scenario is
displayed in percentage.
In accordance to the company Ocado Plc, it is seen that in the year 2007, the firm has
been having a value of -31.75 which is significantly high and negative. This explains that the
company has not been able to generate profit and has been incurring significant amount of
losses. In the next year, the company has faced losses but the value has lowered as well. In
the next year, Ocado Plc has faced losses but the negative value has declined. During the year
2010, the value has improved drastically and even though the company has faced losses but
the value has improved. The figures has been improving for the next few years and in the
FINANCIAL RESEARCH METHOD FOR OCADO PLC
Morrison 5.01 8.01 7.96 9.79 9.59 9.61 8.35 -1.64 -8.64 2.38
Greggs Plc 21.47 28.03 17.56
17.4
6
19.5
8
16.2
5 9.93
13.4
8 13.55
18.0
6
MIN
-
31.75
-
26.40
-
18.98 -4.04 -0.67 -0.13
-
2.51 -1.64
-
14.42 0.37
MAX 21.47 28.03 17.56
17.4
6
19.5
8
16.2
5 9.93
13.4
8 13.55
18.0
6
MEAN 2.29 4.77 3.95 7.29 8.58 8.24 5.84 5.47 0.49 6.11
MEDIAN 4.995 6.50 6.25 6.90 7.87 8.58 7.28 4.97 0.79 2.81
The return on assets is a parameter that indicates how much profitable an organization
is in relation to their overall assets. The return on assets provides an idea as to how effective
the management is during the usage of their assets in order to create income and profits
(Safaei Ghadikolaei, Khalili Esbouei and Antucheviciene 2014). The value in this scenario is
displayed in percentage.
In accordance to the company Ocado Plc, it is seen that in the year 2007, the firm has
been having a value of -31.75 which is significantly high and negative. This explains that the
company has not been able to generate profit and has been incurring significant amount of
losses. In the next year, the company has faced losses but the value has lowered as well. In
the next year, Ocado Plc has faced losses but the negative value has declined. During the year
2010, the value has improved drastically and even though the company has faced losses but
the value has improved. The figures has been improving for the next few years and in the
Paraphrase This Document
Need a fresh take? Get an instant paraphrase of this document with our AI Paraphraser
10
FINANCIAL RESEARCH METHOD FOR OCADO PLC
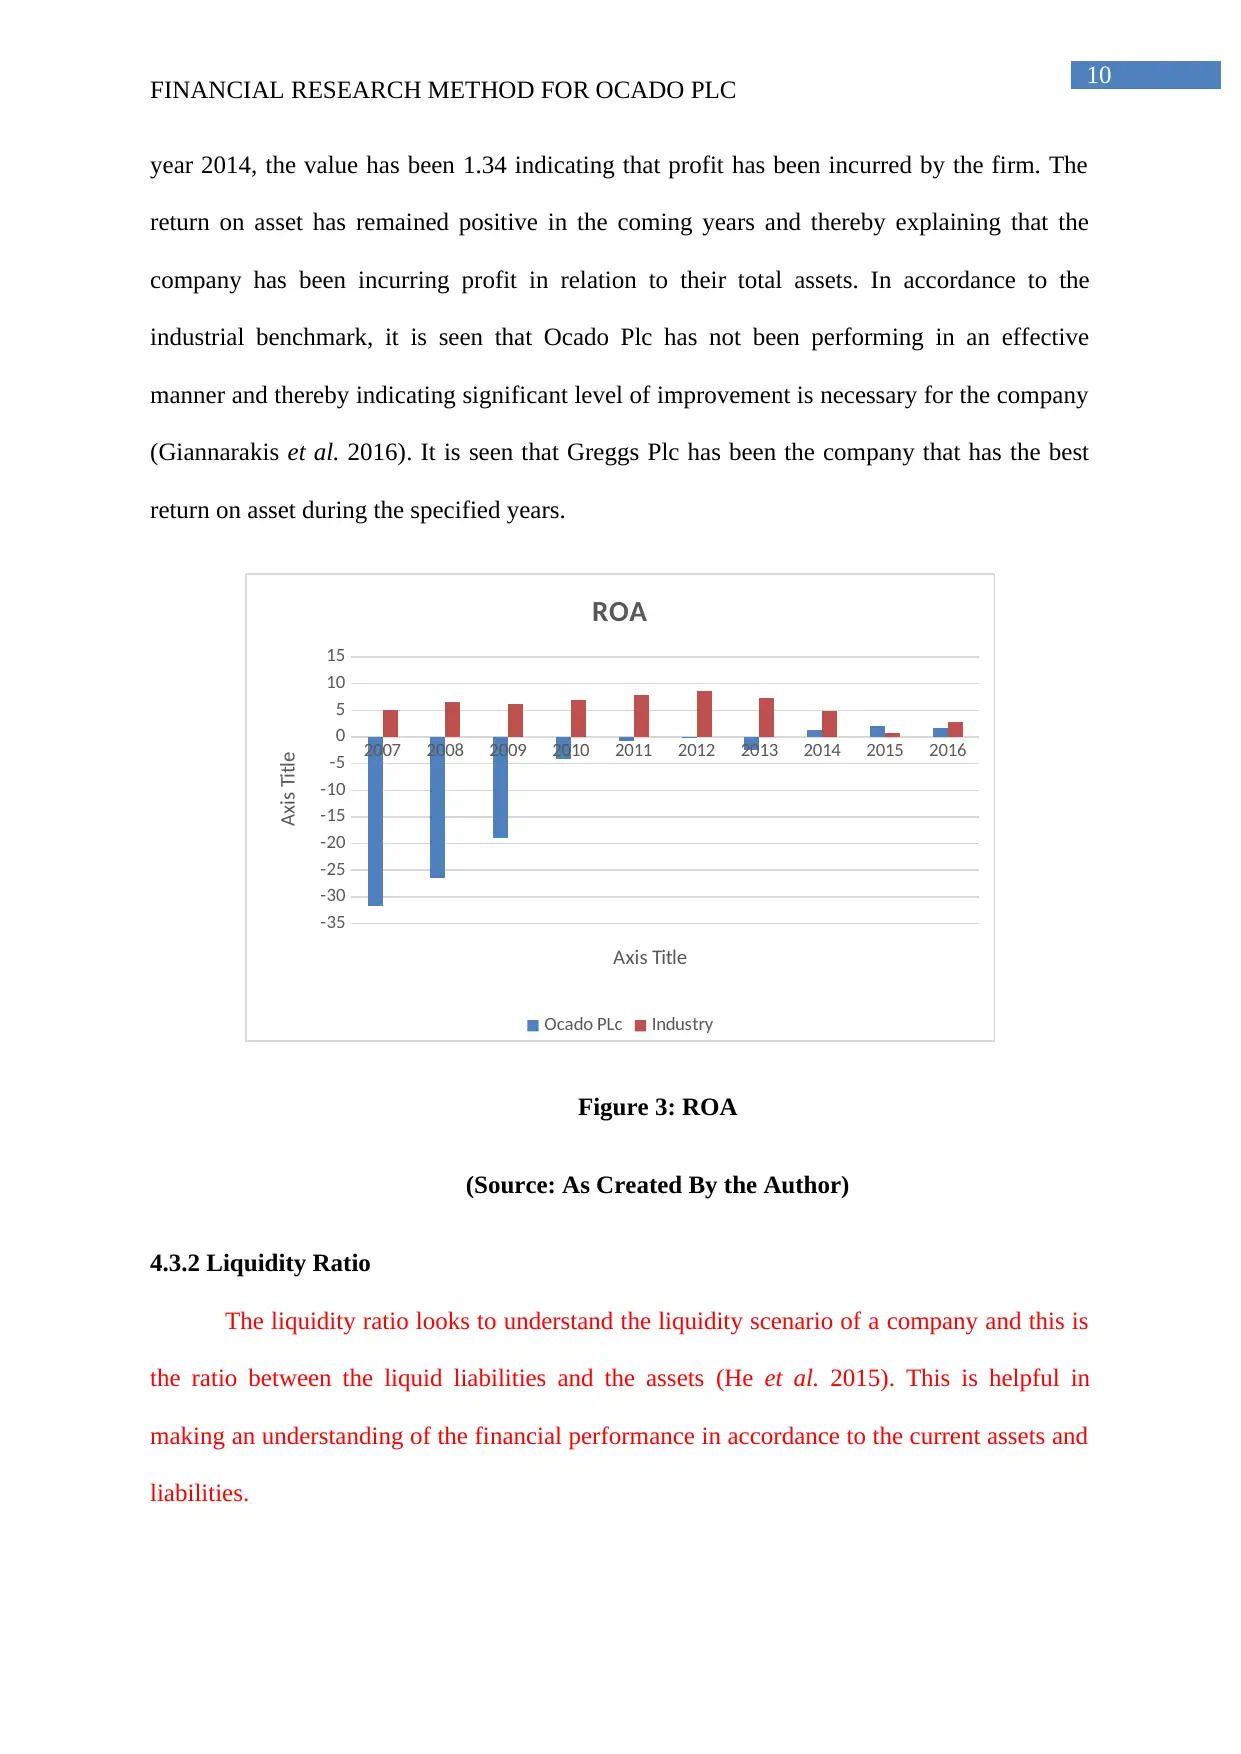
year 2014, the value has been 1.34 indicating that profit has been incurred by the firm. The
return on asset has remained positive in the coming years and thereby explaining that the
company has been incurring profit in relation to their total assets. In accordance to the
industrial benchmark, it is seen that Ocado Plc has not been performing in an effective
manner and thereby indicating significant level of improvement is necessary for the company
(Giannarakis et al. 2016). It is seen that Greggs Plc has been the company that has the best
return on asset during the specified years.
2007 2008 2009 2010 2011 2012 2013 2014 2015 2016
-35
-30
-25
-20
-15
-10
-5
0
5
10
15
ROA
Ocado PLc Industry
Axis Title
Axis Title
Figure 3: ROA
(Source: As Created By the Author)
4.3.2 Liquidity Ratio
The liquidity ratio looks to understand the liquidity scenario of a company and this is
the ratio between the liquid liabilities and the assets (He et al. 2015). This is helpful in
making an understanding of the financial performance in accordance to the current assets and
liabilities.
FINANCIAL RESEARCH METHOD FOR OCADO PLC
year 2014, the value has been 1.34 indicating that profit has been incurred by the firm. The
return on asset has remained positive in the coming years and thereby explaining that the
company has been incurring profit in relation to their total assets. In accordance to the
industrial benchmark, it is seen that Ocado Plc has not been performing in an effective
manner and thereby indicating significant level of improvement is necessary for the company
(Giannarakis et al. 2016). It is seen that Greggs Plc has been the company that has the best
return on asset during the specified years.
2007 2008 2009 2010 2011 2012 2013 2014 2015 2016
-35
-30
-25
-20
-15
-10
-5
0
5
10
15
ROA
Ocado PLc Industry
Axis Title
Axis Title
Figure 3: ROA
(Source: As Created By the Author)
4.3.2 Liquidity Ratio
The liquidity ratio looks to understand the liquidity scenario of a company and this is
the ratio between the liquid liabilities and the assets (He et al. 2015). This is helpful in
making an understanding of the financial performance in accordance to the current assets and
liabilities.
11
FINANCIAL RESEARCH METHOD FOR OCADO PLC
4.3.2.1 Current Ratio
CR
2007 2008 2009 2010 2011 2012 2013 2014 2015 2016
OcadoPLc 0.73 0.34 0.47 2.50 1.45 1.17 1.13 0.88 0.70 0.51
Tesco Plc 0.51 0.61 0.78 0.73 0.65 0.68 0.69 0.61 0.60 0.75
J Sainsbury 0.71 0.66 0.54 0.66 0.58 0.65 0.61 0.65 0.65 0.66
Booker Plc 0.73 0.76 0.71 0.77 0.80 0.85 0.87 0.98 0.99 0.95
Morrison 0.39 0.49 0.53 0.51 0.55 0.57 0.57 0.50 0.54 0.48
Greggs Plc 0.64 0.53 0.84 0.83 0.69 0.81 0.81 0.99 0.99 0.76
MIN 0.39 0.34 0.47 0.51 0.55 0.57 0.57 0.50 0.54 0.48
MAX 0.73 0.76 0.84 2.50 1.45 1.17 1.13 0.99 0.99 0.95
MEAN 0.62 0.57 0.65 1.00 0.79 0.79 0.78 0.77 0.75 0.69
MEDIAN 0.68 0.57 0.63 0.75 0.67 0.75 0.75 0.77 0.68 0.71
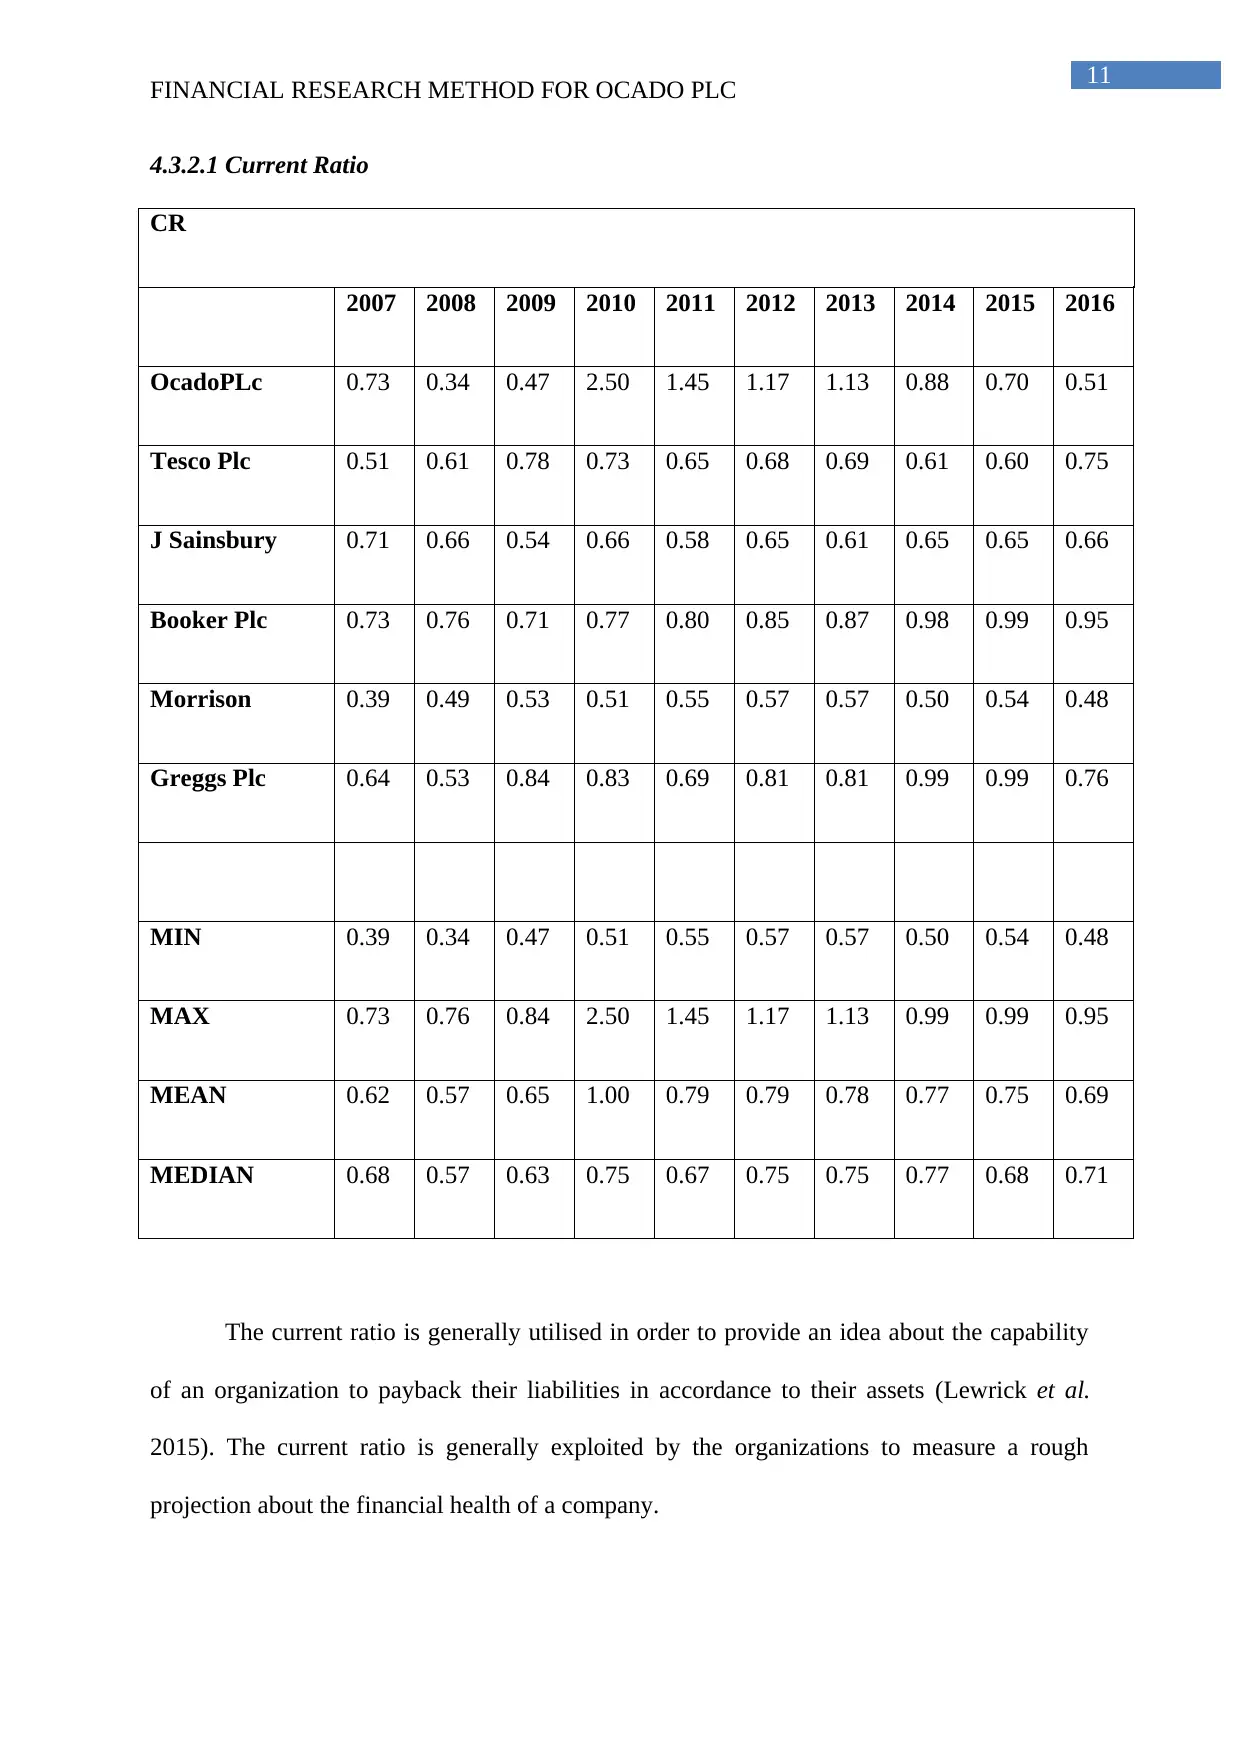
The current ratio is generally utilised in order to provide an idea about the capability
of an organization to payback their liabilities in accordance to their assets (Lewrick et al.
2015). The current ratio is generally exploited by the organizations to measure a rough
projection about the financial health of a company.
FINANCIAL RESEARCH METHOD FOR OCADO PLC
4.3.2.1 Current Ratio
CR
2007 2008 2009 2010 2011 2012 2013 2014 2015 2016
OcadoPLc 0.73 0.34 0.47 2.50 1.45 1.17 1.13 0.88 0.70 0.51
Tesco Plc 0.51 0.61 0.78 0.73 0.65 0.68 0.69 0.61 0.60 0.75
J Sainsbury 0.71 0.66 0.54 0.66 0.58 0.65 0.61 0.65 0.65 0.66
Booker Plc 0.73 0.76 0.71 0.77 0.80 0.85 0.87 0.98 0.99 0.95
Morrison 0.39 0.49 0.53 0.51 0.55 0.57 0.57 0.50 0.54 0.48
Greggs Plc 0.64 0.53 0.84 0.83 0.69 0.81 0.81 0.99 0.99 0.76
MIN 0.39 0.34 0.47 0.51 0.55 0.57 0.57 0.50 0.54 0.48
MAX 0.73 0.76 0.84 2.50 1.45 1.17 1.13 0.99 0.99 0.95
MEAN 0.62 0.57 0.65 1.00 0.79 0.79 0.78 0.77 0.75 0.69
MEDIAN 0.68 0.57 0.63 0.75 0.67 0.75 0.75 0.77 0.68 0.71
The current ratio is generally utilised in order to provide an idea about the capability
of an organization to payback their liabilities in accordance to their assets (Lewrick et al.
2015). The current ratio is generally exploited by the organizations to measure a rough
projection about the financial health of a company.
⊘ This is a preview!⊘
Do you want full access?
Subscribe today to unlock all pages.
Trusted by 1+ million students worldwide
1 out of 36
Related Documents


Your All-in-One AI-Powered Toolkit for Academic Success.
+13062052269
info@desklib.com
Available 24*7 on WhatsApp / Email
![[object Object]](/_next/static/media/star-bottom.7253800d.svg)
Unlock your academic potential
Copyright © 2020–2026 A2Z Services. All Rights Reserved. Developed and managed by ZUCOL.