Financial Performance Analysis: Horizon Oil Ltd vs Tap Oil Ltd, 2018
VerifiedAdded on 2023/06/14
|17
|2821
|303
Report
AI Summary
This report presents a comparative financial analysis of Horizon Oil Limited and Tap Oil Limited, conducted for Business Smart's client, Company A (Horizon Oil Limited), using Tap Oil Limited as a benchmark. The analysis employs profitability, efficiency, liquidity, and stability ratios to evaluate the financial performance and associated risks of both companies. Findings indicate that Horizon Oil Limited is more profitable, having significantly improved its net profit from a substantial loss to a positive figure, while Tap Oil Limited's profitability ratios declined. The report also addresses non-financial issues, such as Horizon Oil Limited's stock market risk, and environmental concerns related to Tap Oil Limited. Ultimately, the report aims to provide insights for decision-making and risk management, with a recommendation focused on balancing profitability with sustainability.
Running head: ACCOUNTING FOR MANAGEMENT
Accounting for Management
Name of the Student:
Name of the University:
Author Note
Accounting for Management
Name of the Student:
Name of the University:
Author Note
Paraphrase This Document
Need a fresh take? Get an instant paraphrase of this document with our AI Paraphraser

1ACCOUNTING FOR MANAGEMENT
Executive Summary
The issue that has been presented in the question is that the analysis of a particular
company with the name Horizon Oil Limited and Tap Oil Limited has been carried out in order
to determine the particular fact as to which company is more profitable. Moreover, such a
purpose has been fulfilled with the help of the significant ratios like the profitability ratios,
efficiency ratios, liquidity ratios and stability ratios.
Furthermore, it has been found out that the Horizon Oil Limited is much more profitable
than the Tap Oil Limited in regards to profitability.
2ACCOUNTING FOR MANAGEMENT
Table of Contents
Introduction......................................................................................................................................3
Issue.................................................................................................................................................3
Findings...........................................................................................................................................4
Comparison between Horizon Oil Limited and Tap Oil Limited................................................4
Analysis of the profitability ratios...............................................................................................5
Analysis of the Efficiency ratios..................................................................................................6
Analysis of Liquidity ratios.........................................................................................................7
Analysis of stability ratios...........................................................................................................8
Analysis of the profitability ratios...............................................................................................9
Analysis of the efficiency ratios................................................................................................10
Analysis of the liquidity ratios...................................................................................................11
Analysis of the stability ratios...................................................................................................12
Non-financial issue in regards to Horizon Oil Limited.................................................................13
Environmental issues in regards to Tap Oil Limited.....................................................................13
Recommendation and Conclusion.................................................................................................14
References......................................................................................................................................15
Appendix........................................................................................................................................16
⊘ This is a preview!⊘
Do you want full access?
Subscribe today to unlock all pages.
Trusted by 1+ million students worldwide
3ACCOUNTING FOR MANAGEMENT
Introduction
The issue that has been presented in the question is that the post the joining of the finance
and business consultation firm, Business Smart, the manager of the firm Mr. James Brown had
decided to take up a family leave. This has led to the preparation of a consultation report for an
important client, Company A.
This particular study aims to focus on the particular aspect of the selected company A
(Horizon Oil Limited) and the chosen benchmarking company, B with the particular name of
Tap Oil Limited. Furthermore, the essential ratios have been computed for the purpose of
evaluating the financial performance of the company and the related risks associated with the
business operations.
Issue
It has been further mentioned in the case study that Company A that is the Horizon Oil
Limited carries out the particular decision of appointing a new Chief Executive Officer. Thus
before the arrival of the new CEO the management of the corporate entity has decided the fact
that the assessment of the financial performance of the company and the particular risks faced
should be carried out. This is essentially done in order to execute the preparation of the financial
statements in an accurate way and the particular issues in regards to the performance of the
business can be potentially identified. Moreover, it has been further mentioned in the case study
that the particular Company A has been operating under public scrutiny due to the fact of high
carbon emissions and consumption of the required amount of energy. In order to resolve this
particular problem in regards to sustainability the members of the Board has been discussing the
considerable improvement in the sustainability reporting of the company by improving the
Paraphrase This Document
Need a fresh take? Get an instant paraphrase of this document with our AI Paraphraser
4ACCOUNTING FOR MANAGEMENT
reporting of the company on environmental challenges and strategies for the protection of the
environment. However, it must be noted here that a particular number of Board members have
opposed to this particular strategy due to the consideration of the risk that has been associated
with lifting such a report. These Board members have been of the opinion that the firm should
focus on the major areas of business and the regaining of profit (Afonso, Baxa and Slavik 2018).
Findings
Comparison between Horizon Oil Limited and Tap Oil Limited
The particular company that has been more profitable in nature is the Horizon Oil
Limited. This is because this particular entity has acquired a profit of $5,400,416. This means
that the net profit acquired by the firm of Horizon Oil Limited has directly leaped from a
negative figure of -$199729329 to $5400416. This is a huge success that has been managed by
the entity of the corporate firm. It must be further explained with the help of the pre-tax profit
component. The pre-tax refers to that particular component that has been derived after deducting
the necessary expenses from the gross profit of the firm. The net profit is a potential indicator of
the profitability of the firm. Therefore, it can be evidently concluded that in regards to the Tap
Oil Limited that has been considered as a benchmark company, the particular corporate entity of
Horizon Oil Limited has obtained a greater amount of profit.
Furthermore, the comparison of the different financial components can be carried out
with the help of the essential or the significant ratios that aim to provide an overview into the
financial performance of the company with the help of the carrying out of the computations of
the different kinds of financial ratios like the asset turnover ratios, the efficiency ratios and the
liquidity ratios.
5ACCOUNTING FOR MANAGEMENT
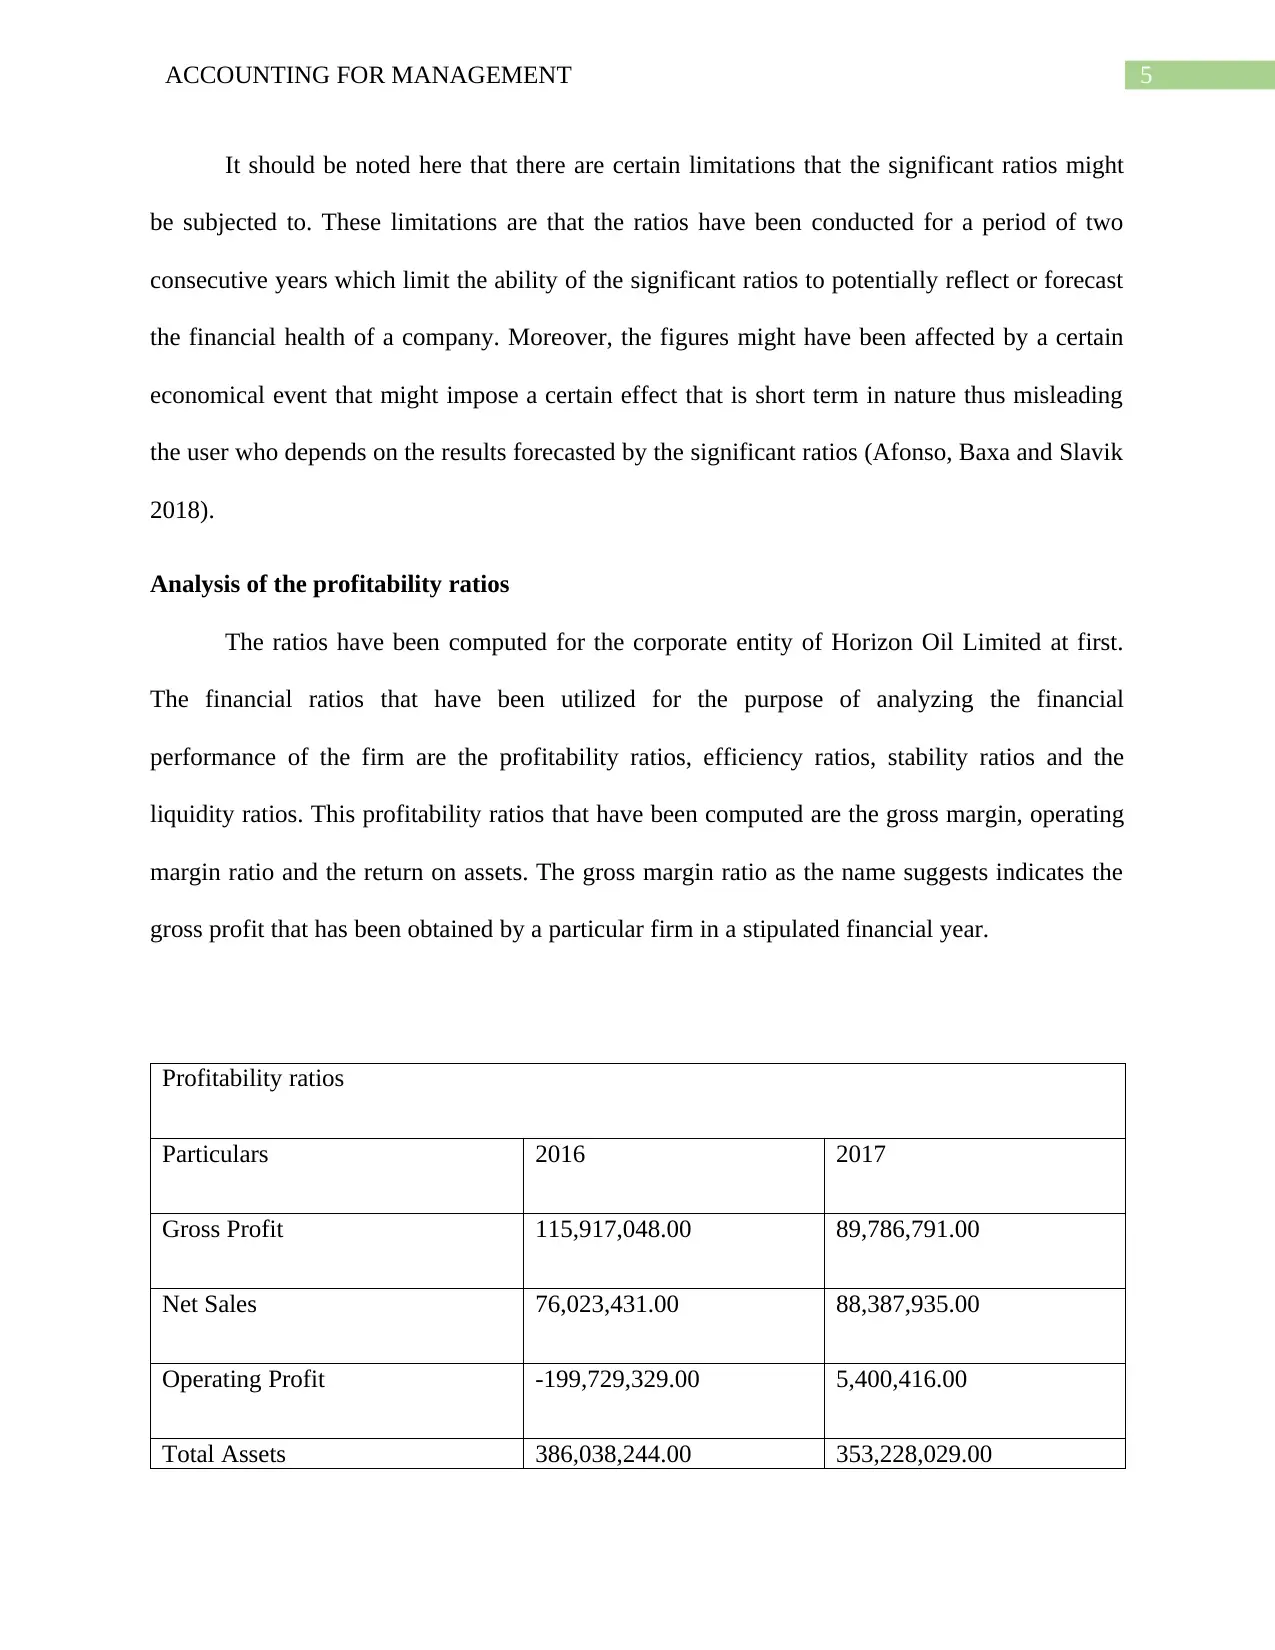
It should be noted here that there are certain limitations that the significant ratios might
be subjected to. These limitations are that the ratios have been conducted for a period of two
consecutive years which limit the ability of the significant ratios to potentially reflect or forecast
the financial health of a company. Moreover, the figures might have been affected by a certain
economical event that might impose a certain effect that is short term in nature thus misleading
the user who depends on the results forecasted by the significant ratios (Afonso, Baxa and Slavik
2018).
Analysis of the profitability ratios
The ratios have been computed for the corporate entity of Horizon Oil Limited at first.
The financial ratios that have been utilized for the purpose of analyzing the financial
performance of the firm are the profitability ratios, efficiency ratios, stability ratios and the
liquidity ratios. This profitability ratios that have been computed are the gross margin, operating
margin ratio and the return on assets. The gross margin ratio as the name suggests indicates the
gross profit that has been obtained by a particular firm in a stipulated financial year.
Profitability ratios
Particulars 2016 2017
Gross Profit 115,917,048.00 89,786,791.00
Net Sales 76,023,431.00 88,387,935.00
Operating Profit -199,729,329.00 5,400,416.00
Total Assets 386,038,244.00 353,228,029.00
⊘ This is a preview!⊘
Do you want full access?
Subscribe today to unlock all pages.
Trusted by 1+ million students worldwide
6ACCOUNTING FOR MANAGEMENT
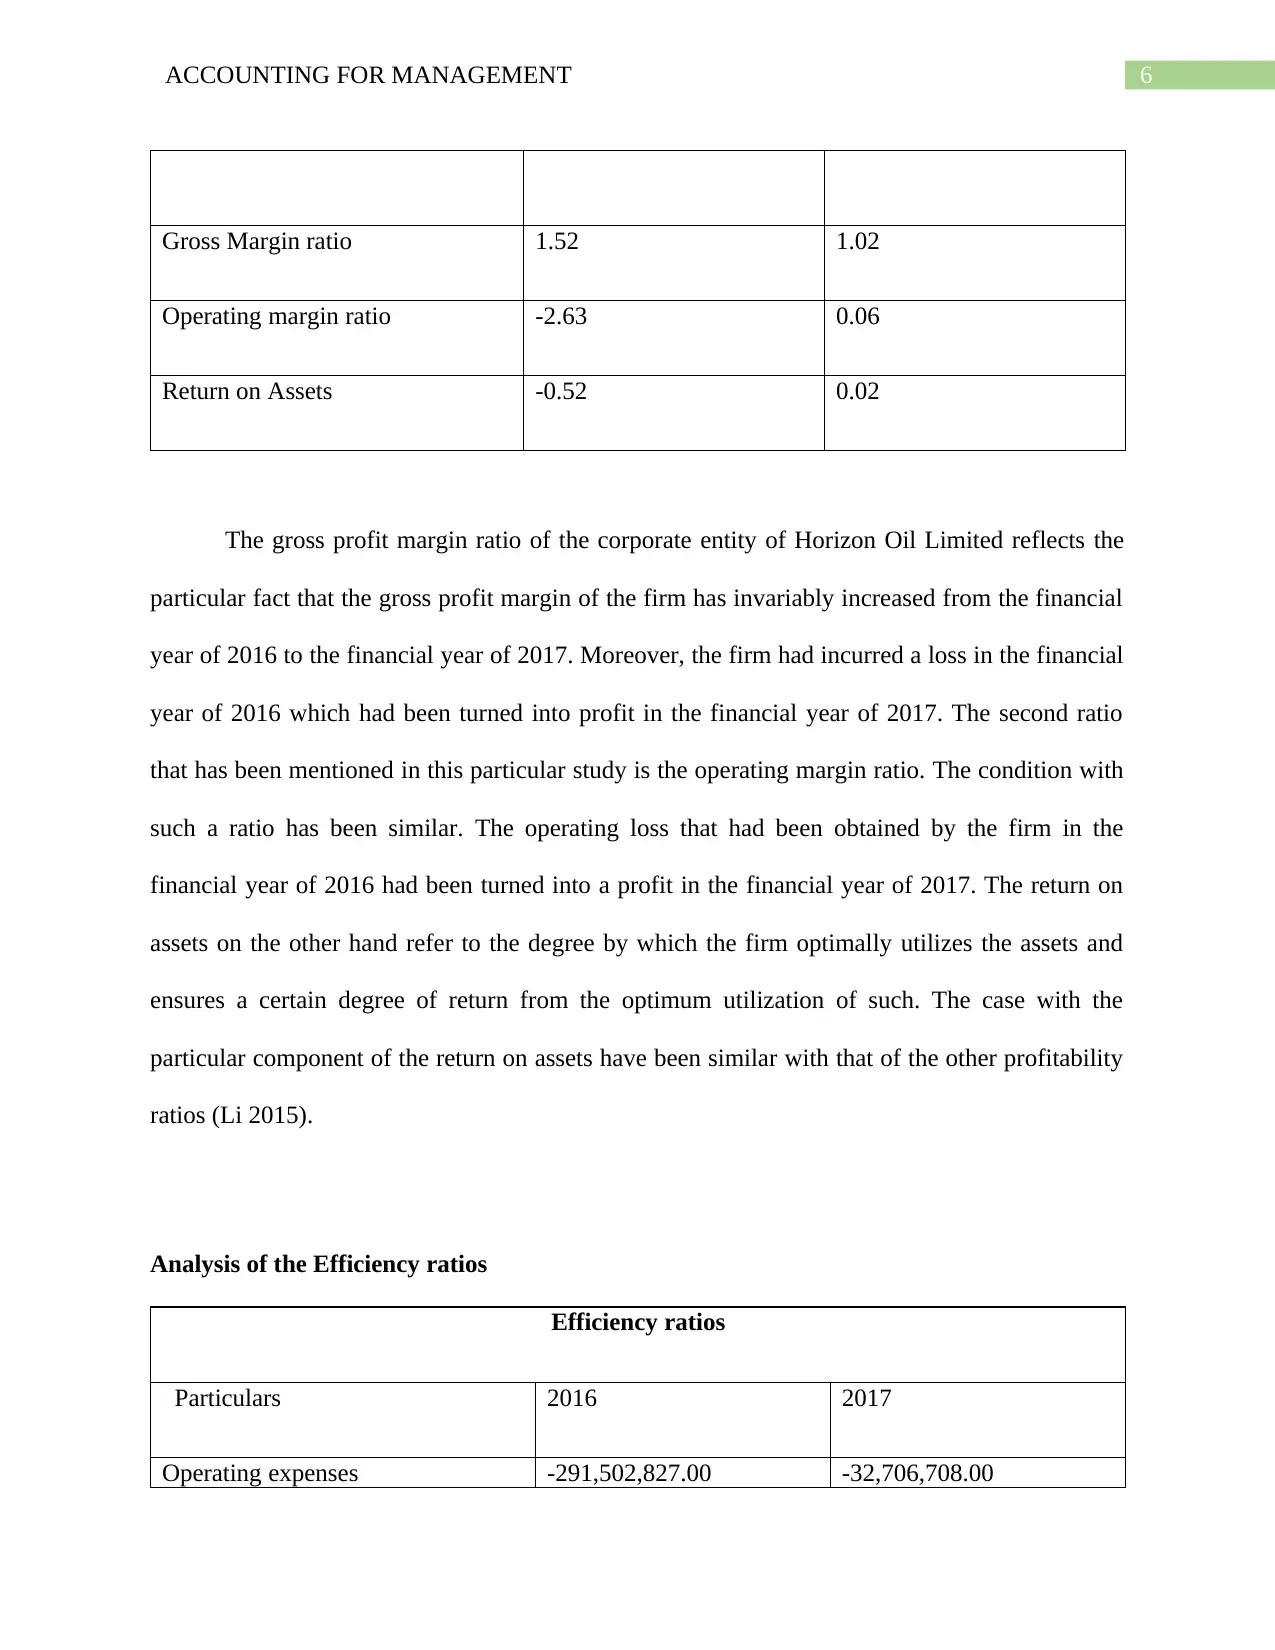
Gross Margin ratio 1.52 1.02
Operating margin ratio -2.63 0.06
Return on Assets -0.52 0.02
The gross profit margin ratio of the corporate entity of Horizon Oil Limited reflects the
particular fact that the gross profit margin of the firm has invariably increased from the financial
year of 2016 to the financial year of 2017. Moreover, the firm had incurred a loss in the financial
year of 2016 which had been turned into profit in the financial year of 2017. The second ratio
that has been mentioned in this particular study is the operating margin ratio. The condition with
such a ratio has been similar. The operating loss that had been obtained by the firm in the
financial year of 2016 had been turned into a profit in the financial year of 2017. The return on
assets on the other hand refer to the degree by which the firm optimally utilizes the assets and
ensures a certain degree of return from the optimum utilization of such. The case with the
particular component of the return on assets have been similar with that of the other profitability
ratios (Li 2015).
Analysis of the Efficiency ratios
Efficiency ratios
Particulars 2016 2017
Operating expenses -291,502,827.00 -32,706,708.00
Paraphrase This Document
Need a fresh take? Get an instant paraphrase of this document with our AI Paraphraser
7ACCOUNTING FOR MANAGEMENT
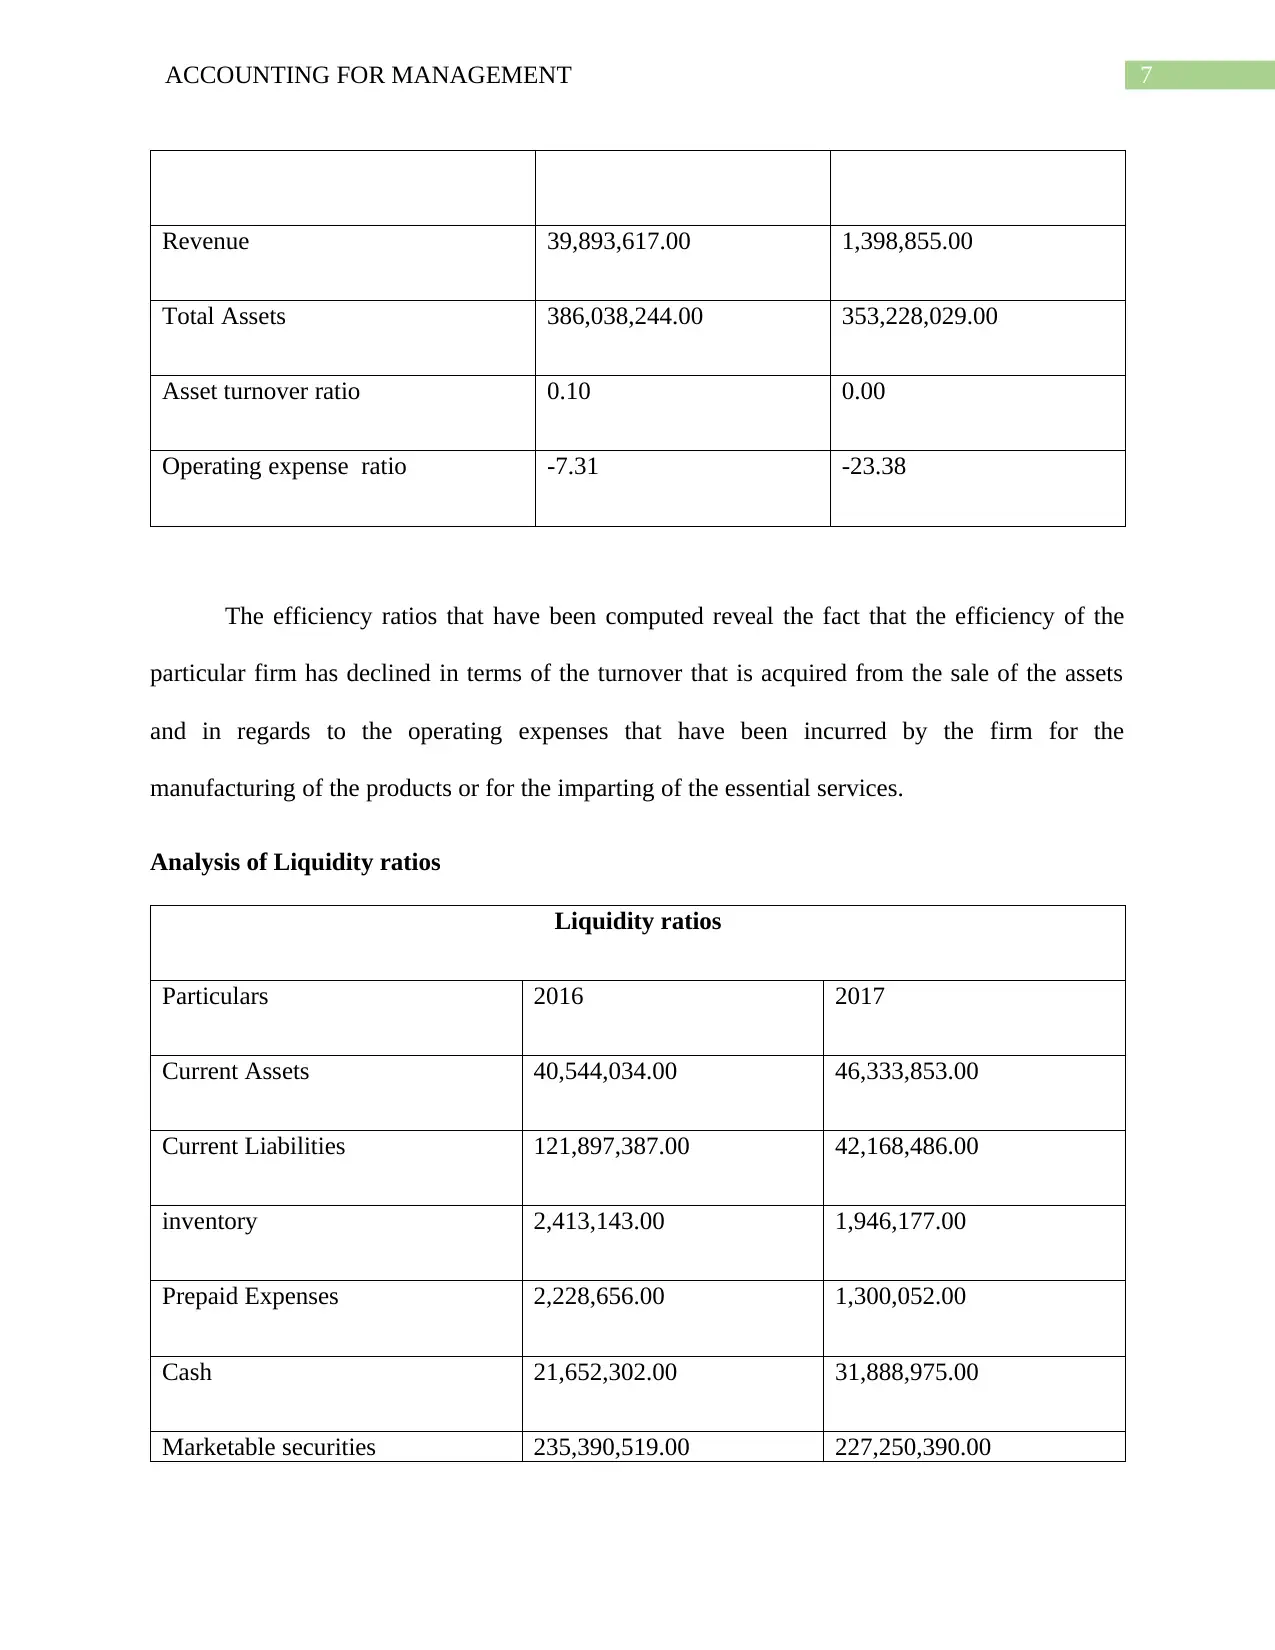
Revenue 39,893,617.00 1,398,855.00
Total Assets 386,038,244.00 353,228,029.00
Asset turnover ratio 0.10 0.00
Operating expense ratio -7.31 -23.38
The efficiency ratios that have been computed reveal the fact that the efficiency of the
particular firm has declined in terms of the turnover that is acquired from the sale of the assets
and in regards to the operating expenses that have been incurred by the firm for the
manufacturing of the products or for the imparting of the essential services.
Analysis of Liquidity ratios
Liquidity ratios
Particulars 2016 2017
Current Assets 40,544,034.00 46,333,853.00
Current Liabilities 121,897,387.00 42,168,486.00
inventory 2,413,143.00 1,946,177.00
Prepaid Expenses 2,228,656.00 1,300,052.00
Cash 21,652,302.00 31,888,975.00
Marketable securities 235,390,519.00 227,250,390.00
8ACCOUNTING FOR MANAGEMENT
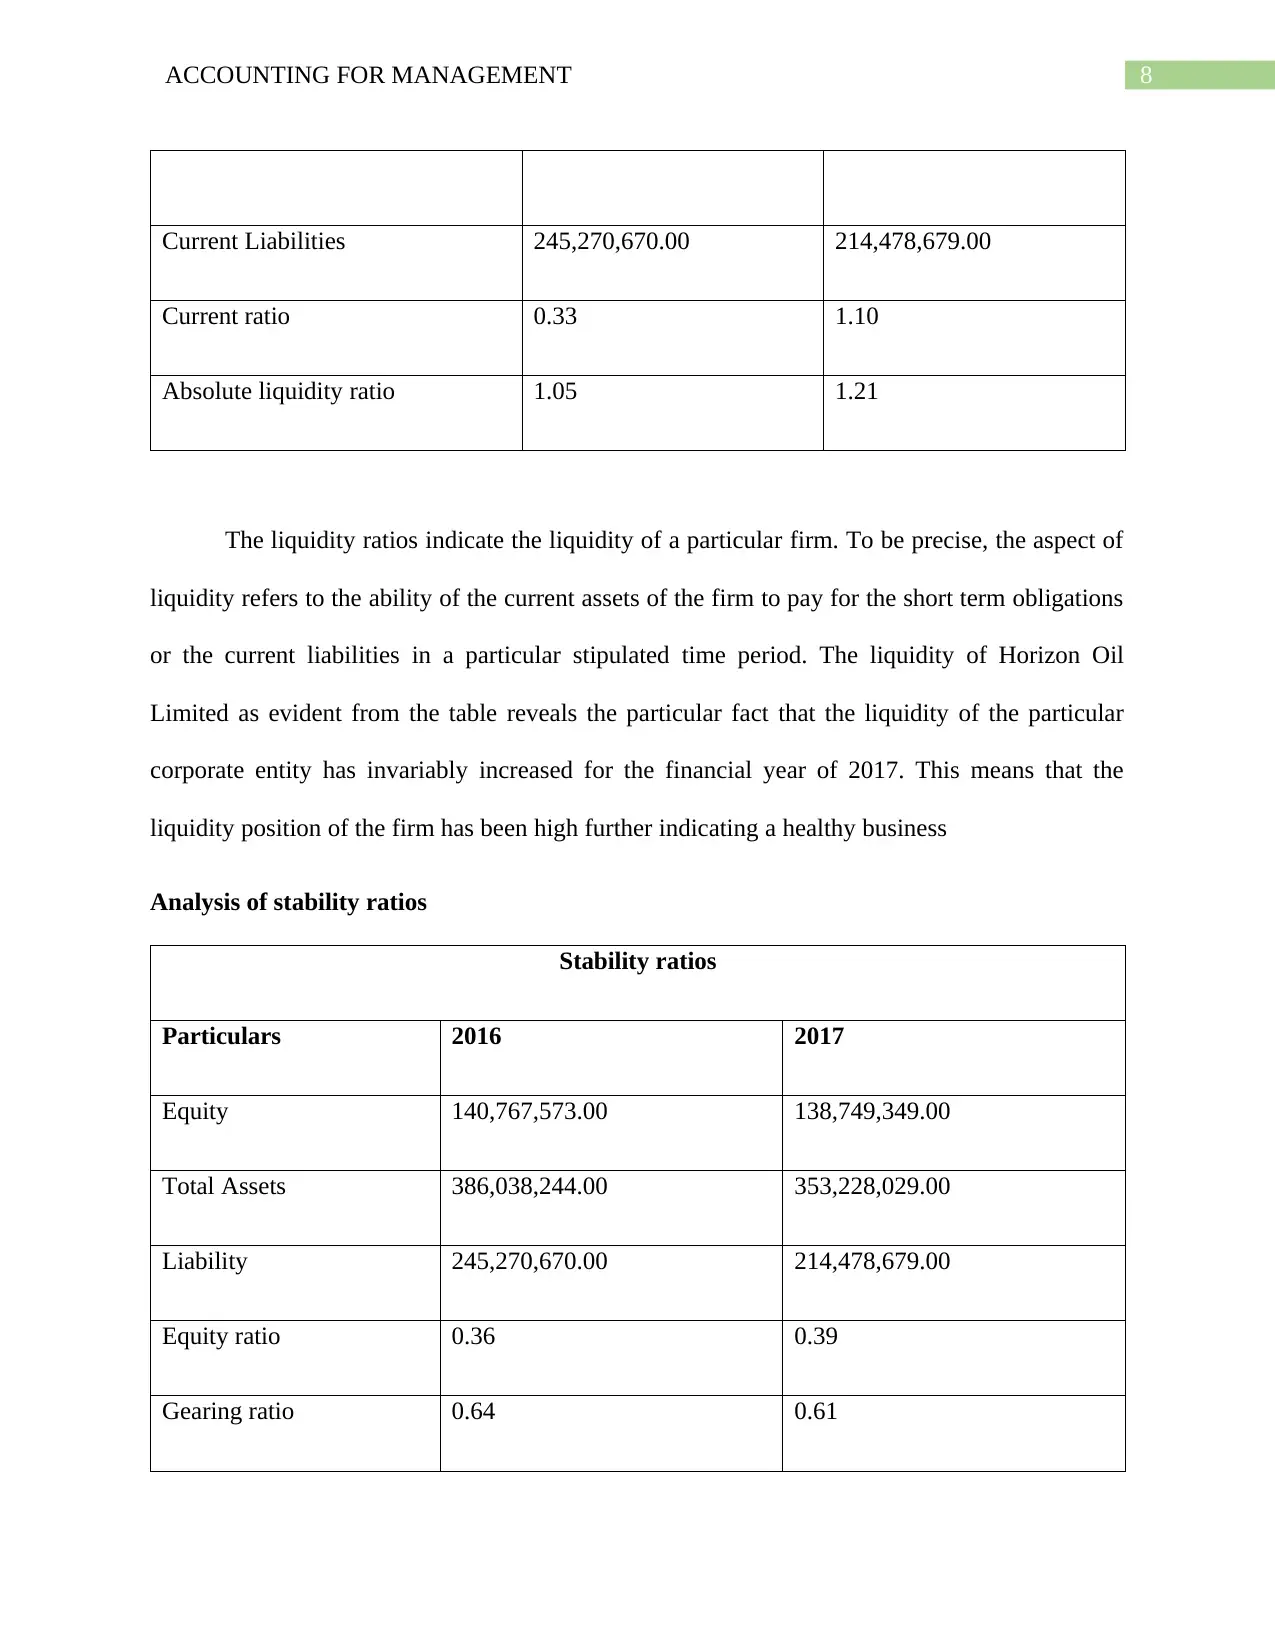
Current Liabilities 245,270,670.00 214,478,679.00
Current ratio 0.33 1.10
Absolute liquidity ratio 1.05 1.21
The liquidity ratios indicate the liquidity of a particular firm. To be precise, the aspect of
liquidity refers to the ability of the current assets of the firm to pay for the short term obligations
or the current liabilities in a particular stipulated time period. The liquidity of Horizon Oil
Limited as evident from the table reveals the particular fact that the liquidity of the particular
corporate entity has invariably increased for the financial year of 2017. This means that the
liquidity position of the firm has been high further indicating a healthy business
Analysis of stability ratios
Stability ratios
Particulars 2016 2017
Equity 140,767,573.00 138,749,349.00
Total Assets 386,038,244.00 353,228,029.00
Liability 245,270,670.00 214,478,679.00
Equity ratio 0.36 0.39
Gearing ratio 0.64 0.61
⊘ This is a preview!⊘
Do you want full access?
Subscribe today to unlock all pages.
Trusted by 1+ million students worldwide
9ACCOUNTING FOR MANAGEMENT
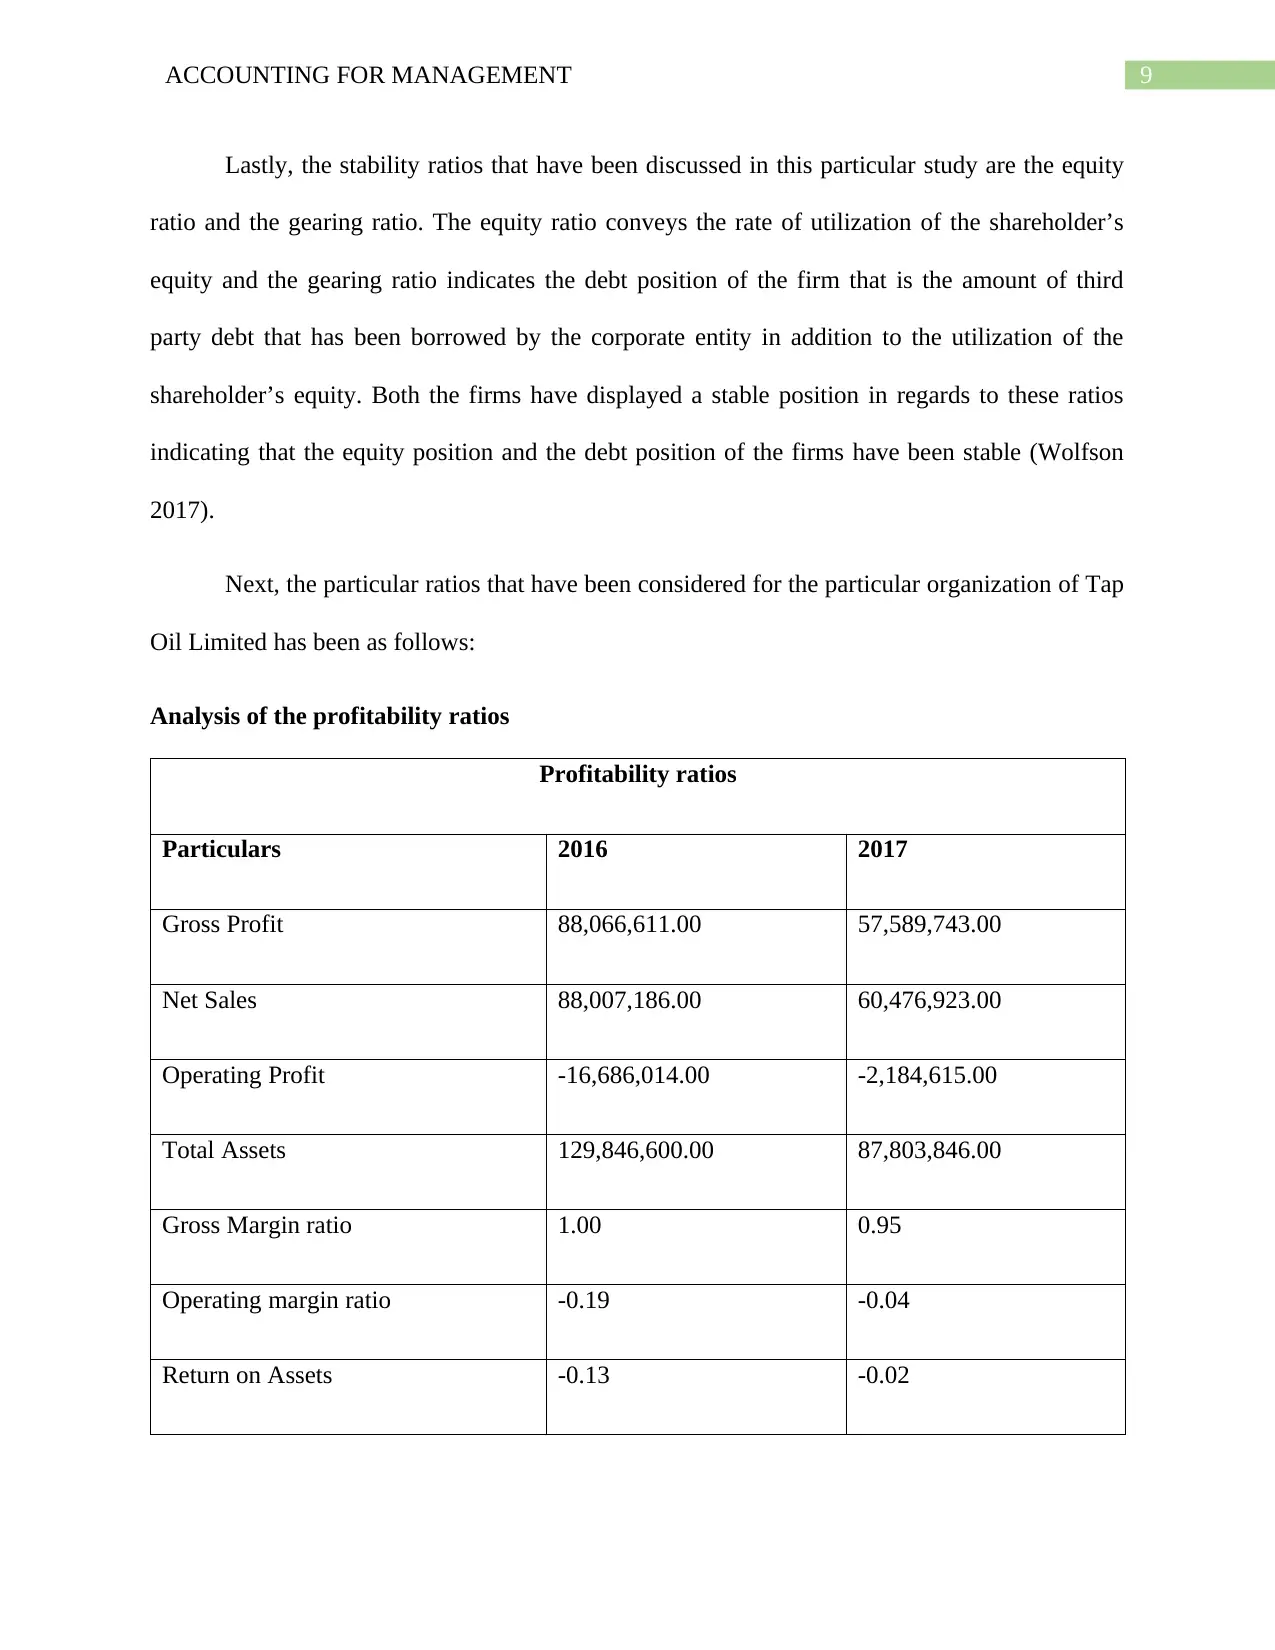
Lastly, the stability ratios that have been discussed in this particular study are the equity
ratio and the gearing ratio. The equity ratio conveys the rate of utilization of the shareholder’s
equity and the gearing ratio indicates the debt position of the firm that is the amount of third
party debt that has been borrowed by the corporate entity in addition to the utilization of the
shareholder’s equity. Both the firms have displayed a stable position in regards to these ratios
indicating that the equity position and the debt position of the firms have been stable (Wolfson
2017).
Next, the particular ratios that have been considered for the particular organization of Tap
Oil Limited has been as follows:
Analysis of the profitability ratios
Profitability ratios
Particulars 2016 2017
Gross Profit 88,066,611.00 57,589,743.00
Net Sales 88,007,186.00 60,476,923.00
Operating Profit -16,686,014.00 -2,184,615.00
Total Assets 129,846,600.00 87,803,846.00
Gross Margin ratio 1.00 0.95
Operating margin ratio -0.19 -0.04
Return on Assets -0.13 -0.02
Paraphrase This Document
Need a fresh take? Get an instant paraphrase of this document with our AI Paraphraser
10ACCOUNTING FOR MANAGEMENT
On the other hand, the comparison with the benchmark company that is the Tap Oil
Limited reveal the fact that the corporate entity has fallen aback in regards to the Horizon Oil
Limited. All the profitability ratios have declined and the particular corporate entity has faced a
major setback both in the financial years of 2016 and that of 2017. This has been further
evidenced by the negative values of the profitability ratios that have been computed (Li 2015).
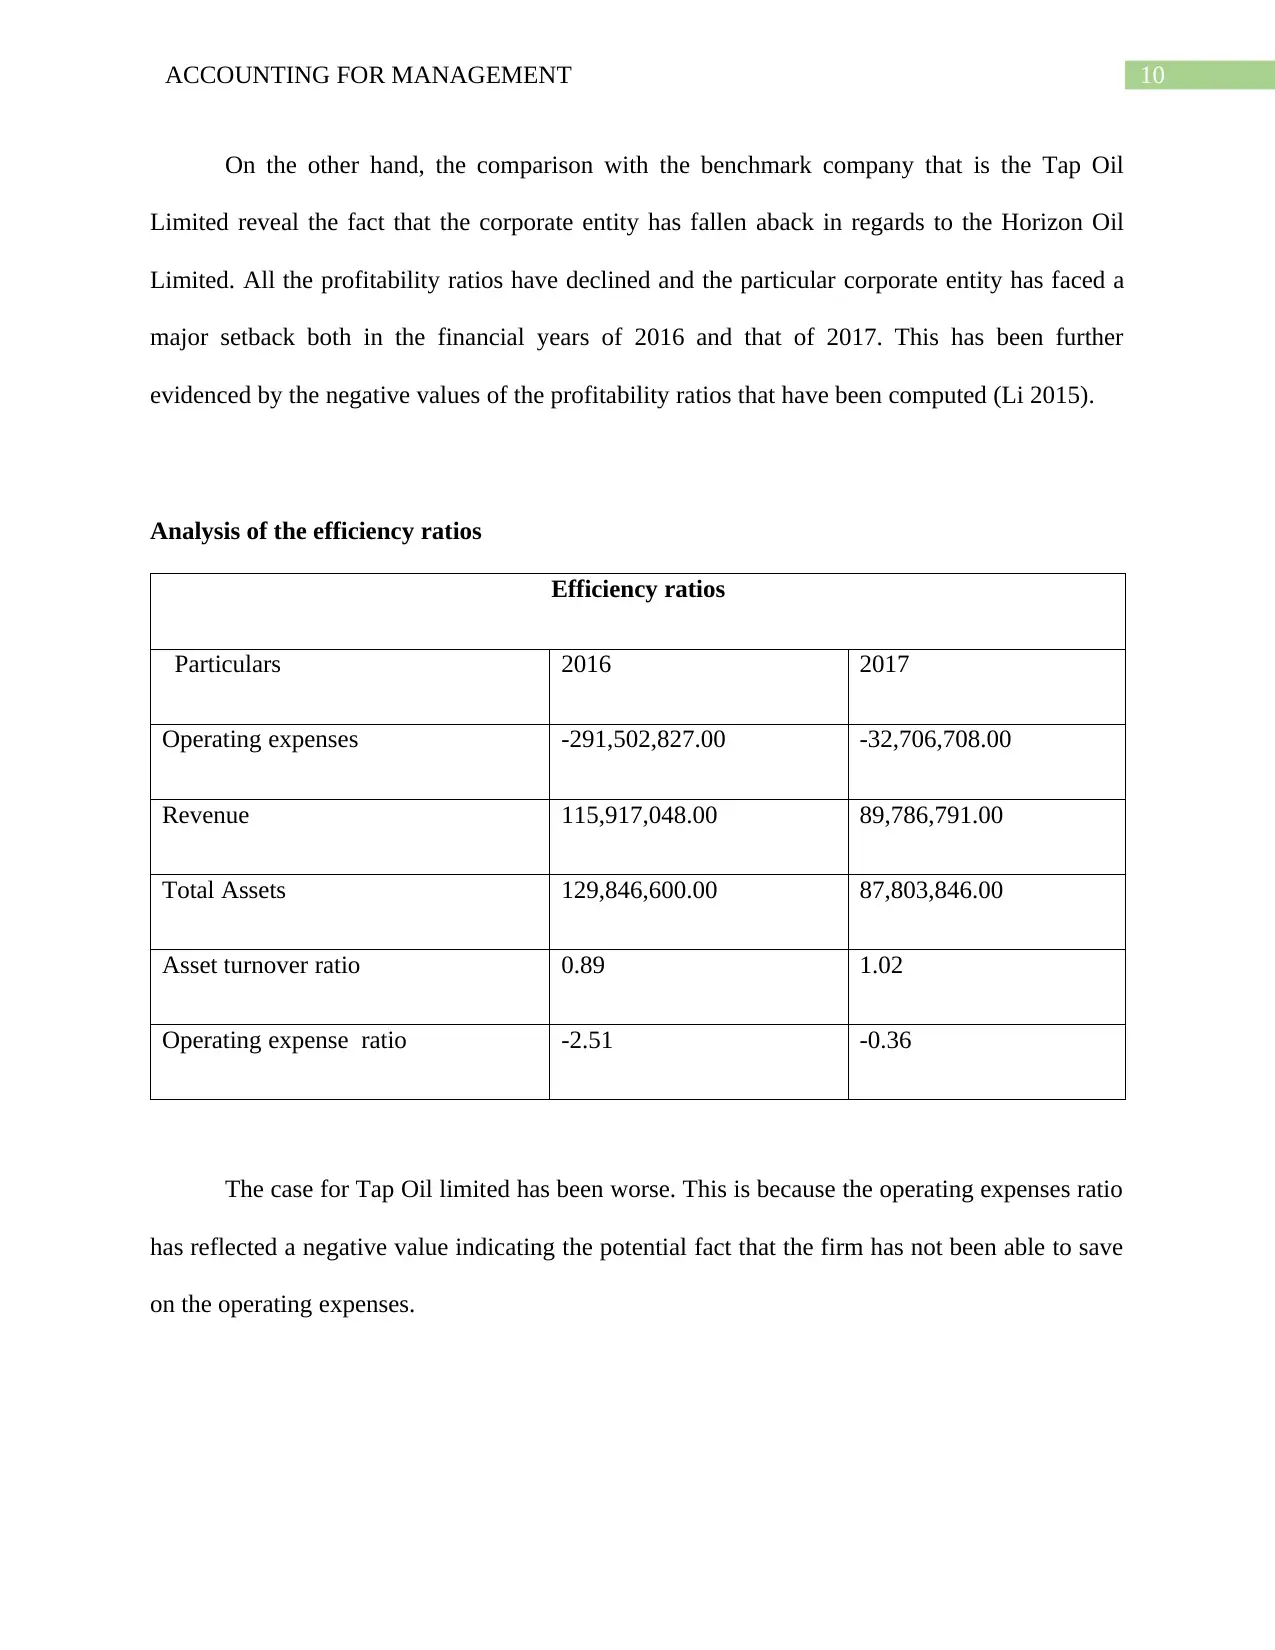
Analysis of the efficiency ratios
Efficiency ratios
Particulars 2016 2017
Operating expenses -291,502,827.00 -32,706,708.00
Revenue 115,917,048.00 89,786,791.00
Total Assets 129,846,600.00 87,803,846.00
Asset turnover ratio 0.89 1.02
Operating expense ratio -2.51 -0.36
The case for Tap Oil limited has been worse. This is because the operating expenses ratio
has reflected a negative value indicating the potential fact that the firm has not been able to save
on the operating expenses.
On the other hand, the comparison with the benchmark company that is the Tap Oil
Limited reveal the fact that the corporate entity has fallen aback in regards to the Horizon Oil
Limited. All the profitability ratios have declined and the particular corporate entity has faced a
major setback both in the financial years of 2016 and that of 2017. This has been further
evidenced by the negative values of the profitability ratios that have been computed (Li 2015).
Analysis of the efficiency ratios
Efficiency ratios
Particulars 2016 2017
Operating expenses -291,502,827.00 -32,706,708.00
Revenue 115,917,048.00 89,786,791.00
Total Assets 129,846,600.00 87,803,846.00
Asset turnover ratio 0.89 1.02
Operating expense ratio -2.51 -0.36
The case for Tap Oil limited has been worse. This is because the operating expenses ratio
has reflected a negative value indicating the potential fact that the firm has not been able to save
on the operating expenses.
11ACCOUNTING FOR MANAGEMENT
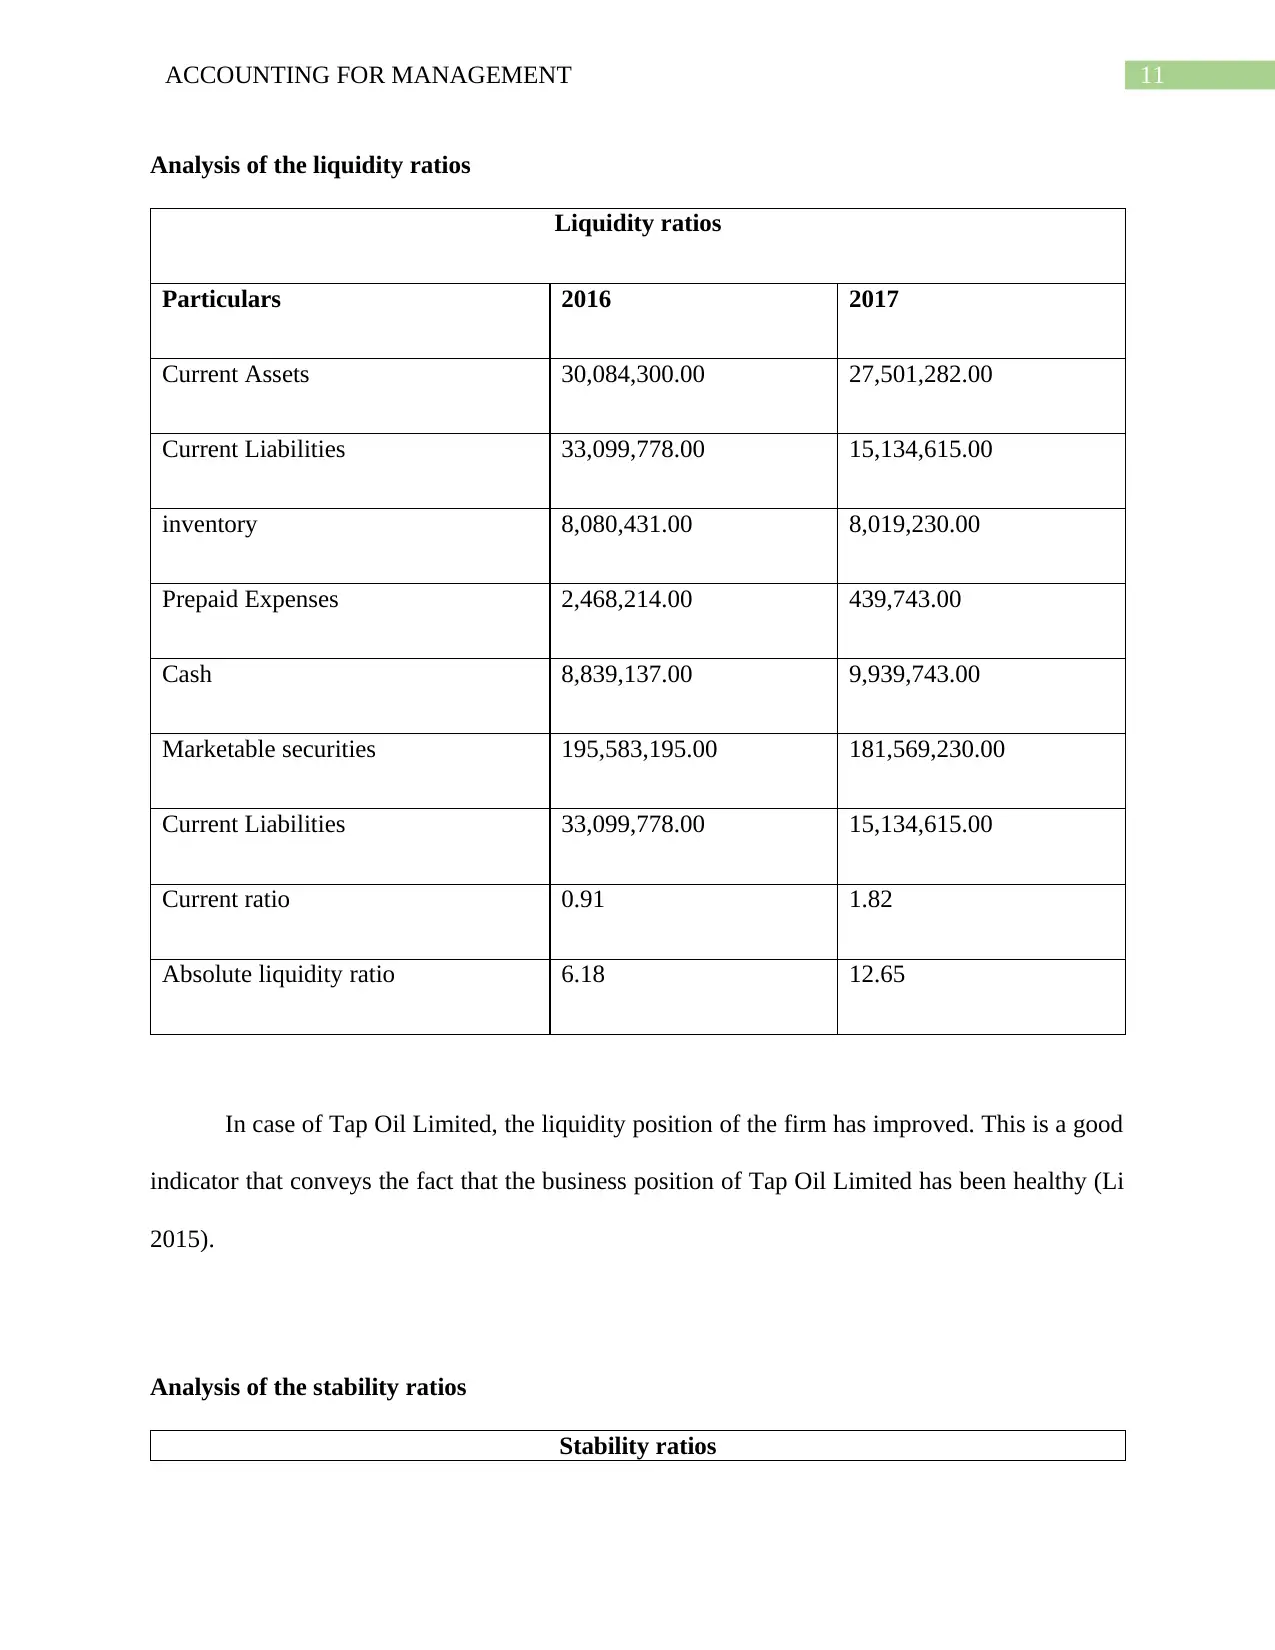
Analysis of the liquidity ratios
Liquidity ratios
Particulars 2016 2017
Current Assets 30,084,300.00 27,501,282.00
Current Liabilities 33,099,778.00 15,134,615.00
inventory 8,080,431.00 8,019,230.00
Prepaid Expenses 2,468,214.00 439,743.00
Cash 8,839,137.00 9,939,743.00
Marketable securities 195,583,195.00 181,569,230.00
Current Liabilities 33,099,778.00 15,134,615.00
Current ratio 0.91 1.82
Absolute liquidity ratio 6.18 12.65
In case of Tap Oil Limited, the liquidity position of the firm has improved. This is a good
indicator that conveys the fact that the business position of Tap Oil Limited has been healthy (Li
2015).
Analysis of the stability ratios
Stability ratios
⊘ This is a preview!⊘
Do you want full access?
Subscribe today to unlock all pages.
Trusted by 1+ million students worldwide
1 out of 17
Related Documents


Your All-in-One AI-Powered Toolkit for Academic Success.
+13062052269
info@desklib.com
Available 24*7 on WhatsApp / Email
![[object Object]](/_next/static/media/star-bottom.7253800d.svg)
Unlock your academic potential
Copyright © 2020–2026 A2Z Services. All Rights Reserved. Developed and managed by ZUCOL.