UU-MBA710: Pan African Resources PLC Financial Performance Report
VerifiedAdded on 2022/12/23
|20
|4162
|1
Report
AI Summary
This report provides a comprehensive financial and strategic analysis of Pan African Resources PLC, a precious metals producer operating in the mining industry. The report examines the company's corporate governance structure, highlighting its commitment to ethical leadership, accountability, and transparency. It delves into the challenges faced by the company, including technical, human capital, financial, and policy-related risks. Furthermore, the report assesses the company's capital investments, including the Egoli project and the Royal Sheba project, and identifies its sources of finance, such as share capital, long-term funds from financial institutions, and financial instruments. The financial performance of Pan African Resources PLC is evaluated using financial statements and ratio analysis, including profitability and liquidity ratios. Finally, the report analyzes the company's share performance, offering insights from an investor's perspective.
Running head: FINANCE AND STRATEGIC MANAGEMENT
Finance and strategic management
Name of the student
Name of the university
Student ID
Author note
Finance and strategic management
Name of the student
Name of the university
Student ID
Author note
Paraphrase This Document
Need a fresh take? Get an instant paraphrase of this document with our AI Paraphraser
1FINANCE AND STRATEGIC MANAGEMENT
Table of Contents
Introduction......................................................................................................................................2
1.4.1 Status of corporate governance and challenges......................................................................2
1.4.2 Existing or projected capital investment of the entity............................................................5
1.4.3 Sources of finance...................................................................................................................5
1.4.4 Financial information and measurement of business performance........................................7
1.4.5 Share performance of the entity............................................................................................12
Conclusion and recommendation..................................................................................................15
Reference.......................................................................................................................................16
2FINANCE AND STRATEGIC MANAGEMENT
Introduction
Pan African Resources PLC is the producer of precious metals and is engaged into
mining business. It operates the business through various segments namely Barberton Mines,
Evander Gold Mines and Evander Gold Mining Proprietary Limited, Phoenix Platinum,
Uitkomst Colliery and KwaZulu-natal. It is mid-tier African entity that is focused in producing
gold and listed under Johannesburg as well as London. Strategically the entity is focused in
exploitation of the ore-bodies of high grade that is capable of yielding high margins with base of
comparatively lost cost (Panafricanresources.com, 2019). Objective of the report is to
concentrate on different financial as well as non-financial aspects of Pan African Resources PLC.
The report will highlight the corporate governance complied by the entity and different
challenges faced by it in context of its operation. It will further focus into the financial
performance as well as stock performance of the entity over the past 2 years.
1.4.1 Status of corporate governance and challenges
Board of the entity is committed towards accountability, responsibility, transparency,
fairness through application of ethical leadership. Further, the board integrates the responsible
corporate citizenship into business strategies of the entity, assessments and audits and the same
embeds the sound practice of corporate governance into day-to-day operation as well as
procedures for entire group (Chan, Watson & Woodliff, 2014).
Board of the entity is accountable for framework and governance structure and the same
is supported by 4 sub-committees. The framework covers the delegation process of authority
where daily management of the entity is delegated to CEO. Companies Act 2006 regulates the
⊘ This is a preview!⊘
Do you want full access?
Subscribe today to unlock all pages.
Trusted by 1+ million students worldwide
3FINANCE AND STRATEGIC MANAGEMENT
disclosure of the standards related to the entity’s corporate governance. Apart from theta the
board also takes into account the corporate governance stated under UK Corporate Governance
Code as well as the guidance issued by FRC. Considering the ethical behaviour, the entity is
committed towards highest level in context of professional as well as personal ethical behaviour
and the leadership endeavours to implement the ethical behaviour culture
(Panafricanresources.com, 2019). Further, it has zero-tolerance approach towards corruption and
bribery. Apart from that, it complies with UK Bribery Act. In context of accountability the Board
of the entity is responsible for overall success of the entity’s resources and its major role is
exercising leadership as well as sound judgements while directing the entity for achieving
sustainable growth along with working for shareholder’s best interest. Major responsibilities of
the board consists – setting up of ethical code for board as well as the entity, formulation of
annual agenda of board along with CEO to be in line with the strategic objective of the entity,
monitoring effectiveness of board and evaluating individual performance of directors, engaging
with the CEO on continuous basis and presiding over AGM (Panafricanresources.com, 2019).
Board is further accountable for managing risk as well as the formal procedures for governing
risk and assuring that the board carries out its responsibilities adequately. It reviews the
operational risk reports on regular basis that ensure required level of risk management and
monitors the progress as compared to indicators of key risks. In addition, the board conform to
all the applicable regulations and legal acts. Monitoring as well as compliance management takes
place at different levels of the entity that includes operational level for assuring safety and health
compliance as well as external audits (Revelli & Viviani, 2015).
Paraphrase This Document
Need a fresh take? Get an instant paraphrase of this document with our AI Paraphraser
4FINANCE AND STRATEGIC MANAGEMENT
Gold mining industry is a major contributor to South African economy. However, it faces
different types of risks and challenges including human capital, technical, policies and financial.
Major challenges faced by the entity are as follows –
Technical – The gold industry of South Africa is mainly characterised by the hard-rock
mining at deep level. Hence, inherent constraint in context of technology as well as the
declining trend of labour intensive mining qualities put wide level of pressure on the
entity to enhance the efficiencies with regard to the productivity along with reducing and
managing costs (Gürtunca, 2018).
Human capital – greatest challenge at present the entities are facing is the rapidity as well
as the degree of shrinkage in context of human capital. Struggle for getting the ore to
surface for past decades has been associated by the fact that the diseases like AIDS/HIV
have become epidemic among the worker of South African as well as migrants in the
mine industry. It led to high expenses on the medical insurance as well as disability cover
along with high costs for indirect labour (Richardson, 2018).
Financial consideration – gold mining at deep level needs capital investment of big
amounts as well as specialised equipment and needs long times for development to actual
gold production. Previously cost pressure was eliminated through weakening of rant
against US dollar. However, since 2002 the scenario reversed and the miners lost the
coverage of higher gold prices for rand (Neingo & Tholana, 2016).
Policies – apart from the above mentioned challenges, the company also faces challenges
in context of embracing different laws and regulation including national legislation and
The Mineral and Petroleum Resources Development Act of 2002. Further, these acts
allow discretionary power to government for regulating the mineral rights and supporting
5FINANCE AND STRATEGIC MANAGEMENT
as well as promoting HDSAs (Historically Disadvantaged South Africans) under mining
industry (Neingo & Tholana, 2016).
1.4.2 Existing or projected capital investment of the entity
Different capital investments those are expected to enhance the performance of the entity
are as follows –
Egoli – mining feasibility study of Egoli seems to be promising and the study is already
completed along with the finalisation of optimisation studies. Options available for the
project’s development are expected to be completed by during the financial year 2020. At
present the entity is reviewing merits for expediting Egoli project and it is evaluating the
funding option in context of the same. Pay channel of Egoli is near about 4.5 km in
distance that is used by the Evander Mines for the purpose of hoisting run-of-material to
Kinross metallurgical plant (Panafricanresources.com, 2019).
Royal Sheba project of Barbrton Mines – feasibility of this project determined that
mining in near surface resources through application of opencast mining approach will
lead to higher than the projected capital expenses. Further, it was concluded that the
project will be used for analysing the advantages of applying underground open-stoping
and sub-level mining approach through development of haulage from the existing surface
(Panafricanresources.com, 2019).
1.4.3 Sources of finance
Throughout the business life the entity requires fund for smooth operation and expansion
and the money is needed on continuous basis. Different sources of funds are classified on the
⊘ This is a preview!⊘
Do you want full access?
Subscribe today to unlock all pages.
Trusted by 1+ million students worldwide
6FINANCE AND STRATEGIC MANAGEMENT
basis of time period, control, ownership, and generation source. Funds those are required for
satisfying the needs of more than 1 year are considered as long term sources and the funds
required for less than one year period are considered as short-term sources. Based on the
ownership the funds are segregated as borrowed funds and owner’s fund. Owner’s funds are
raised from the business owners and the profits those are reinvested in business (Robinson et al.,
2015). On the contrary, borrowed funds are the funds generated through borrowings or loans.
Major sources of the funds used by the entity are as follows –
Share capital and treasury shares – share capital signifies the value of fund raised
through share issue by entity. The same is collected through issue of the shares and
remains with the entity till the liquidation. The entity holds the share capital as it is
shareholder’s money and they are considered as the owners of the entity. Entire share
capital in divided into the small parts and each of the part is known as share. However,
during the last 2 years the entity did not issue any new share and hence no fund
generated from share issue (Kostyukova et al., 2017). On the other hand, treasury shares
are entity’s own share generated through the buyback arrangement and is held by the
entity. Treasury shares are represented as deduction from the equity. It is reported as per
the general principle that the economic impact for any transaction associated with the
equity shareholders shall be reported under equity. It signifies that while the entity
transact with the owners, it is actually transact among them. However, during the last 2
years the entity did not transact with any treasury shares and hence no changes are
reported in treasury share amount (Kostyukova et al., 2017).
Long-term funds raised from financial institutions – based on the requirement the entity
raise capital from different financial institutes. Amount of funds raised through long
Paraphrase This Document
Need a fresh take? Get an instant paraphrase of this document with our AI Paraphraser
7FINANCE AND STRATEGIC MANAGEMENT
term liabilities was $62,703.80 as against $63,131.20 for preceding year. It is found that
during the year the entity did not raise any new fund through borrowing from financial
institutions. However, it made repayment towards capital amounting to $3523.60
thousands and towards finance cost amounting to $ 6161.80 thousands (Ehiedu, 2014).
Financial instruments – the entity manages the solvency that assures that the entity will
continue to be the going concern along with maximising the sustainable returns to its
shareholders through optimising the equity and debt component. The entity raised $
36594.3 thousands through issuing equity financial instrument and $11,826 thousands
through debt financial instrument.
1.4.4 Financial information and measurement of business performance
Performance measurement through financial information
Looking into the financial performance of the entity through analysing the financial
statement for past 2 years it can be recognised that the revenues of the entity from continuing
operations have been went up from $ 145,974.80 thousands to $ $ 217,679 thousands over the
last 2 years. In the same trend the COGS also went up from $ 107,139.90 to $ 152,980 thousands
over the same period. Income before income taxes has been significantly gone up from $
14,985.10 to $ 58,408.30 thousands over the years from 2018 to 2019 (Amba, 2014). Likewise,
the net profit has been significantly gone up from $ 15,589.4 to $ 38,042.20 thousands over the
same period. Hence, it can be stated that the profitability position of the entity has been enhanced
over the years from 2018 to 2019. On the other hand, analysing the balance sheet of the entity for
the period closed on 30th June 2019 it can be stated that the current assets of the entity has been
increased from $ 26,513.80 thousands to $ 29,964.7 thousands. On the other side the short term
8FINANCE AND STRATEGIC MANAGEMENT
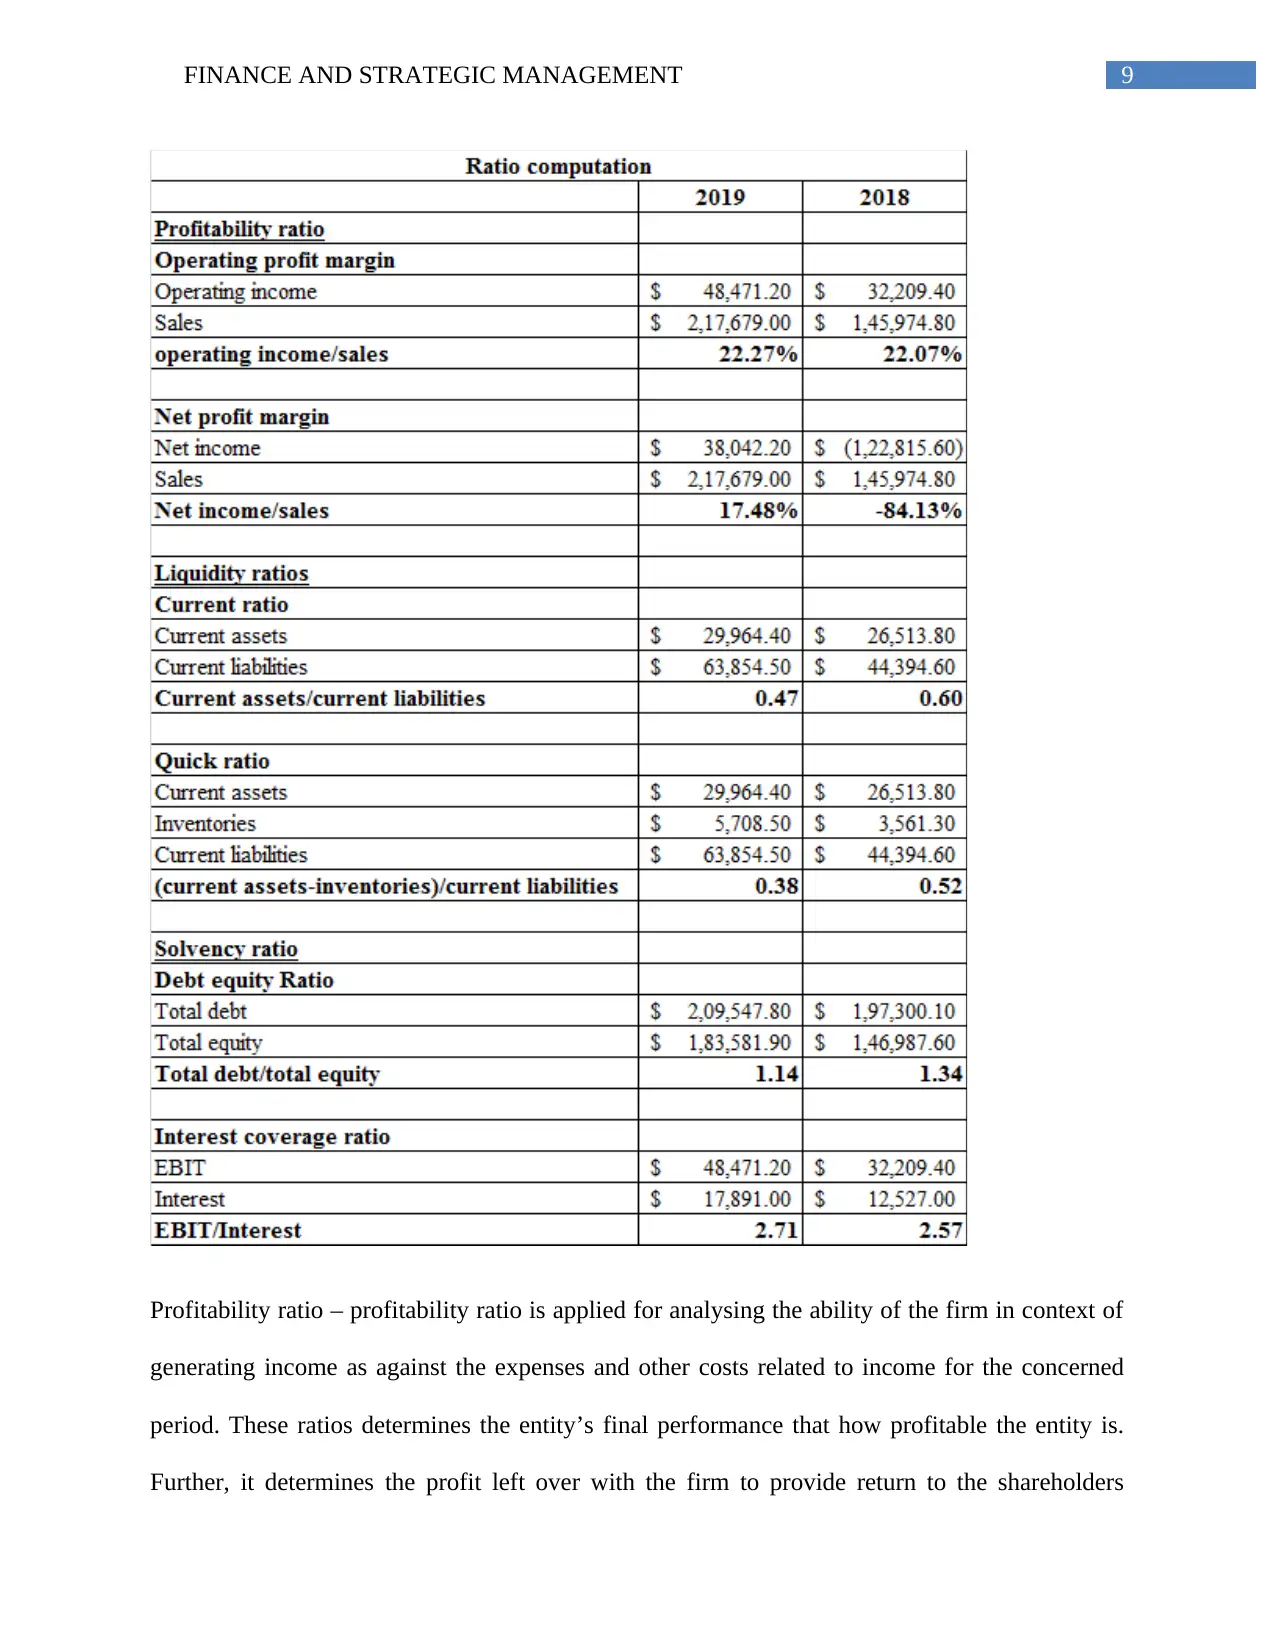
liabilities of the entity has been increased from $ 44,394.60 to $ 63,854.5 thousands over the
same period (Blum & Dacorogna, 2014). Hence, it is signifying that the liquidity position of the
entity has been deteriorated as the increases of current liabilities are comparatively higher as
compared to the increase of current assets. Amount of equities has been increased from $
146,987.60 to $ 183,581.90 thousands over the period of 2018 to 2019. Reason behind the
increase in the amount of equity is the increase in the amount of retained earnings from $ 74,942
to $ 112,984.20 thousands (Panafricanresources.com, 2019). It is again signifying that the entity
has strong profitability position.
Performance measurement through ratio analysis
⊘ This is a preview!⊘
Do you want full access?
Subscribe today to unlock all pages.
Trusted by 1+ million students worldwide
9FINANCE AND STRATEGIC MANAGEMENT
Profitability ratio – profitability ratio is applied for analysing the ability of the firm in context of
generating income as against the expenses and other costs related to income for the concerned
period. These ratios determines the entity’s final performance that how profitable the entity is.
Further, it determines the profit left over with the firm to provide return to the shareholders
Paraphrase This Document
Need a fresh take? Get an instant paraphrase of this document with our AI Paraphraser
10FINANCE AND STRATEGIC MANAGEMENT
(Zainudin & Hashim, 2016). Profitability ratios used for analysing the profitability position of
Pan African Resources PLC are –
Operating profit margin – this ratio determines the performance or profitability exercised
for computing the profit percentage produced by the entity from the operation carried out
by it before deducting the charges for interest and tax. This ratio is computed through
dividing the operating profit by sales revenue. Looking into the operating profit margin of
the entity it is found that the same for the entity over the past 2 years that is 2018 and
2019 has been increased from 22.07% to 22.27% (Panafricanresources.com, 2019). It is
signifying that the profit from operation has been enhanced over the years.
Net profit margin – this is the profitability ratio computed as net income after tax divided
by the sales revenue. Generally the net profit margin is represented in percentage form
and determines amount of each dollar left with the firm after meeting all the expenses.
Existing as well as potential investors are interested in this ratio as it shows the bottom-
line profit of the entity that is left for providing return to the shareholders. Looking into
the operating profit margin of the entity it is found that the same for the entity over the
past 2 years that is 2018 and 2019 has been increased significantly from loss of 84.13%
to 22.27% (Panafricanresources.com, 2019).
Liquidity ratio – these ratios are applied for determining the ability of the firm to pay off the
short term debt obligations with its available current assets and without raising any external fund.
To be more specific, the liquidity ratios determine the firm’s ability to converts its short term
assets into cash (Asiri & Hameed, 2014). Liquidity ratios used for analysing the liquidity
position of Pan African Resources PLC are –
11FINANCE AND STRATEGIC MANAGEMENT
Current ratio – probably it is the most often used and best known liquidity ratios that is
used by the investors as well analysts for analysing the ability of the firm to make
payments for the short term obligation for debt including borrowing and accounts
payables. This is computed through dividing the current assets by the current liabilities
(Brigham et al., 2016). If the current ratio is at least more than 1, it signifies that the
entity’s current assets are adequate to meet the short term obligation. Looking into the
current ratio of the entity it is found that the same for the entity over the past 2 years that
is 2018 and 2019 has been lower than 1 and further deteriorated from 0.60 to 0.47. It is
signifying that the current assets not adequate to cover up the short term obligation
(Panafricanresources.com, 2019).
Quick ratio – this is another major liquidity ratio that is stricter than the current ratio as it
considers only the assets those are readily convertible into cash. It other sense, it does not
consider the assets those takes some time to get converted into cash like inventories. It is
computed through dividing the current assets excluding non-quick assets by current
liabilities. Quick ratio more than 1 suggests that the entity’s quick assets are adequate to
meet the short term obligation (Brigham et al., 2016). Analysing the quick ratio of the
entity it is found that the same for the entity over the past 2 years that is 2018 and 2019
has been lower than 1 and has been dropped to 0.38 from 0.52. It is signifying that the
quick assets of the entity cannot cover up the short term obligation
(Panafricanresources.com, 2019).
Solvency ratios – these ratios are used for determining the firm’s position from the solvency
aspect. Moreover, solvency ratios enumerates the capital structure of the entity and are analysed
by the investors for understanding as well as appreciating its ability to meet the liabilities and
⊘ This is a preview!⊘
Do you want full access?
Subscribe today to unlock all pages.
Trusted by 1+ million students worldwide
1 out of 20
Related Documents


Your All-in-One AI-Powered Toolkit for Academic Success.
+13062052269
info@desklib.com
Available 24*7 on WhatsApp / Email
![[object Object]](/_next/static/media/star-bottom.7253800d.svg)
Unlock your academic potential
Copyright © 2020–2026 A2Z Services. All Rights Reserved. Developed and managed by ZUCOL.