Comprehensive Financial Analysis of PepsiCo's Performance (2017-2018)

Verified

Added on  2022/11/29

|18
|2798
|212
Report
AI Summary
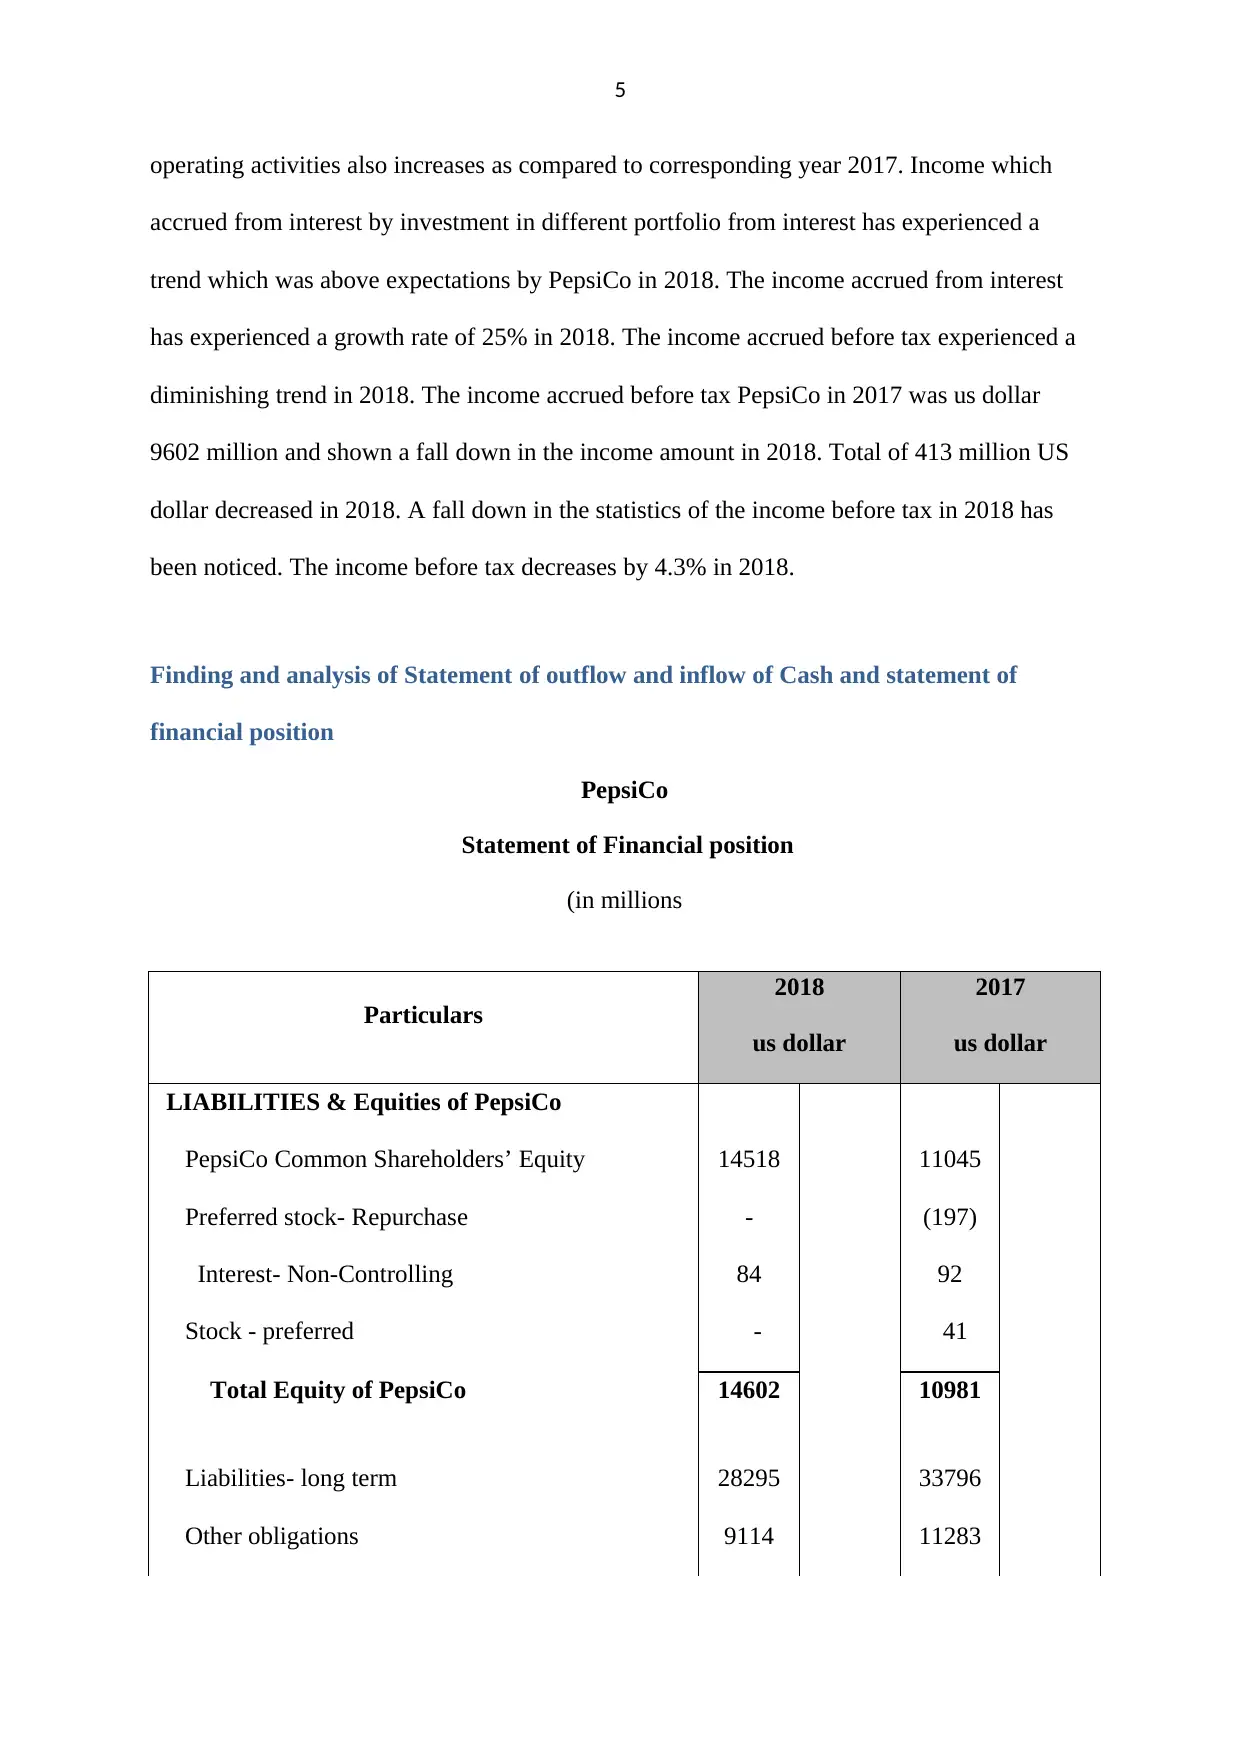
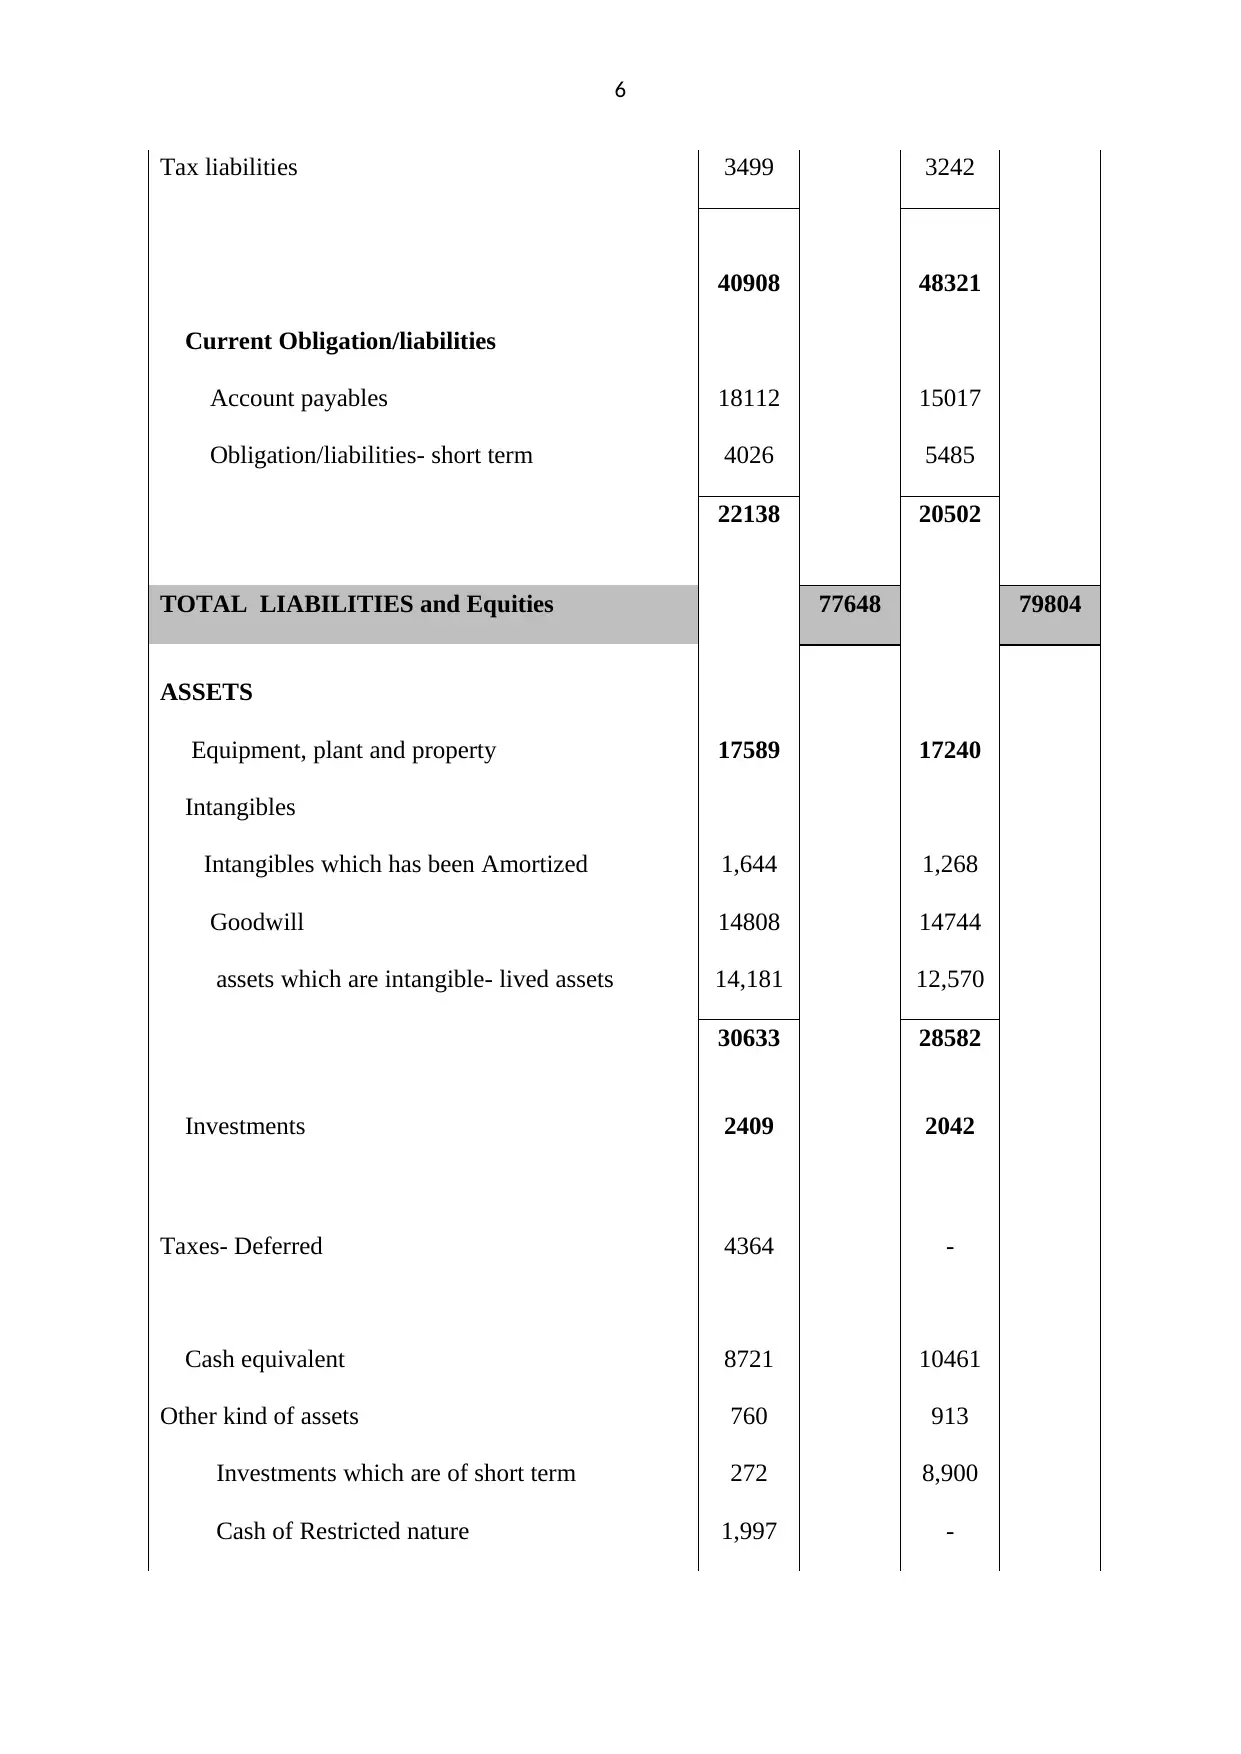
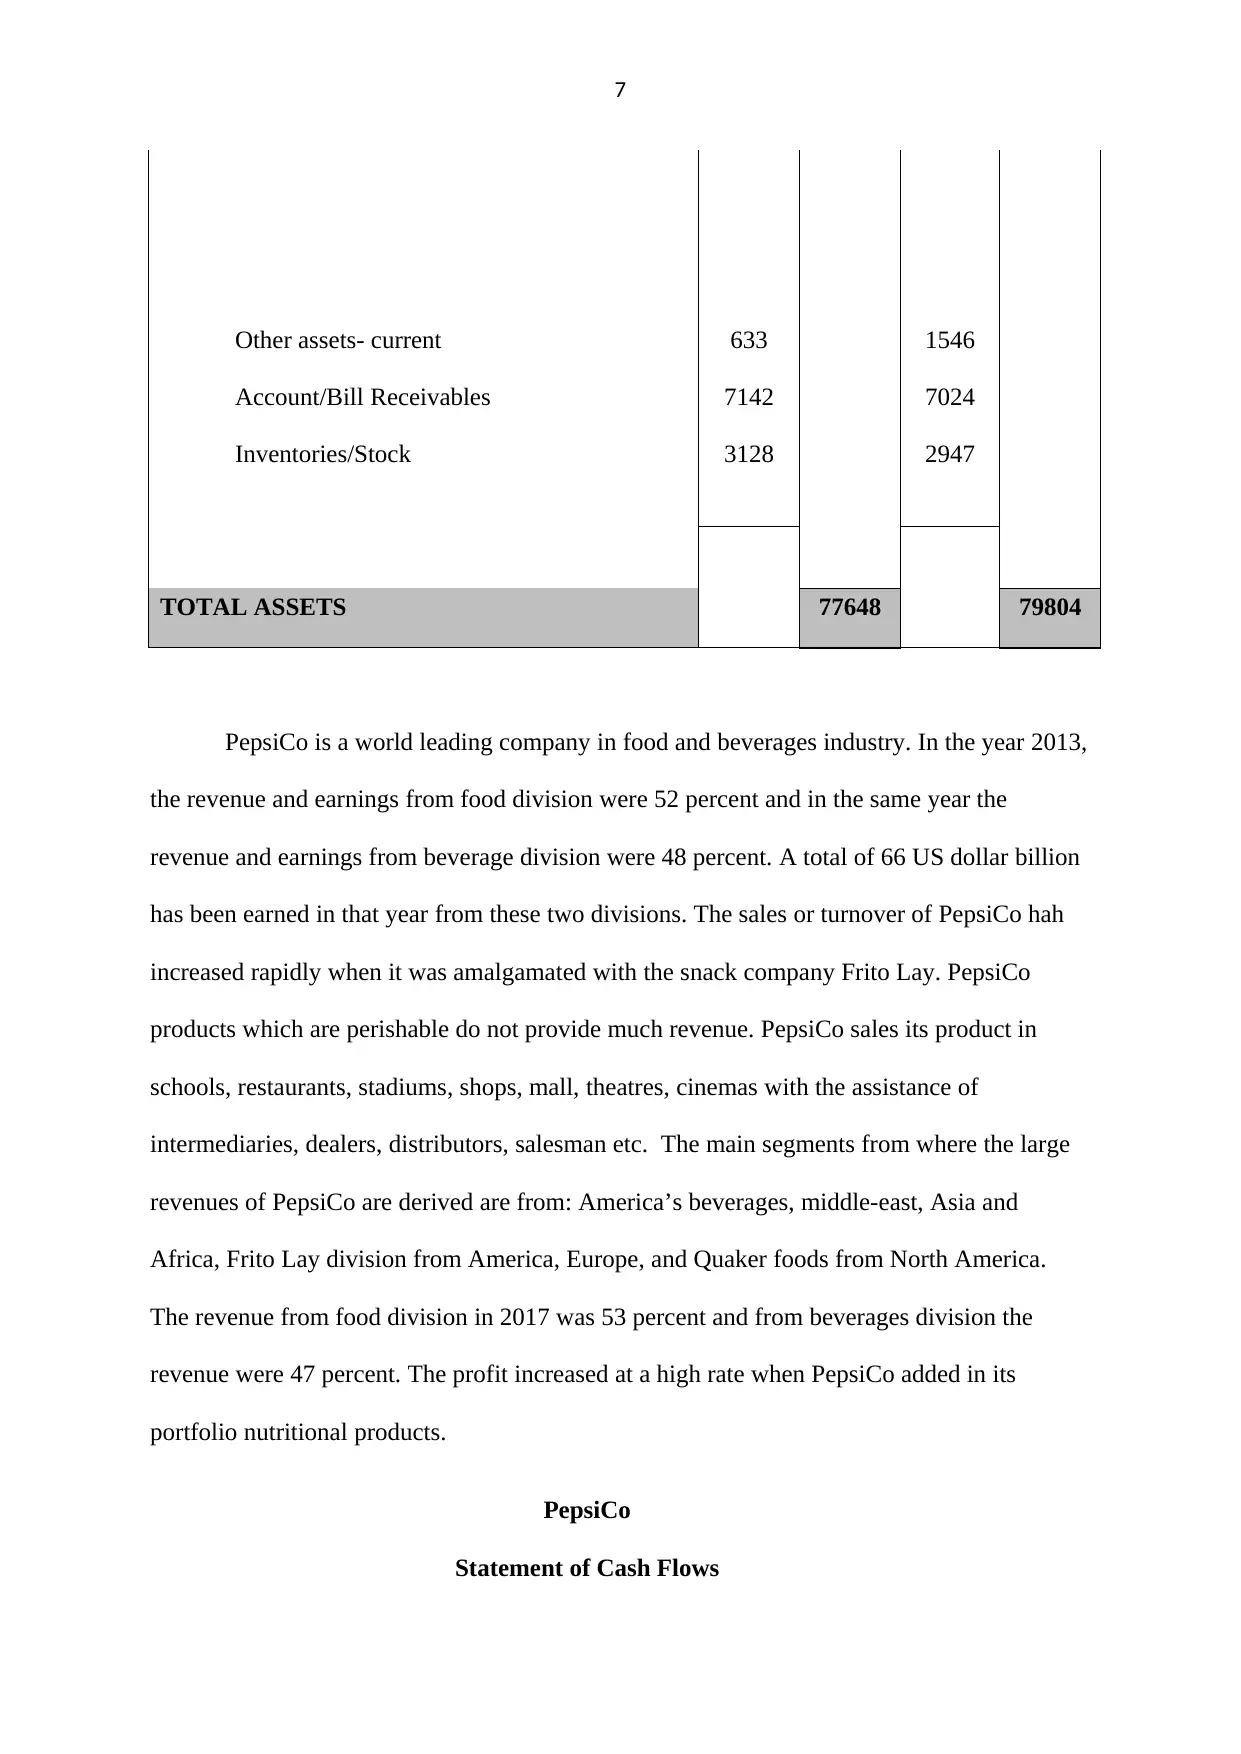
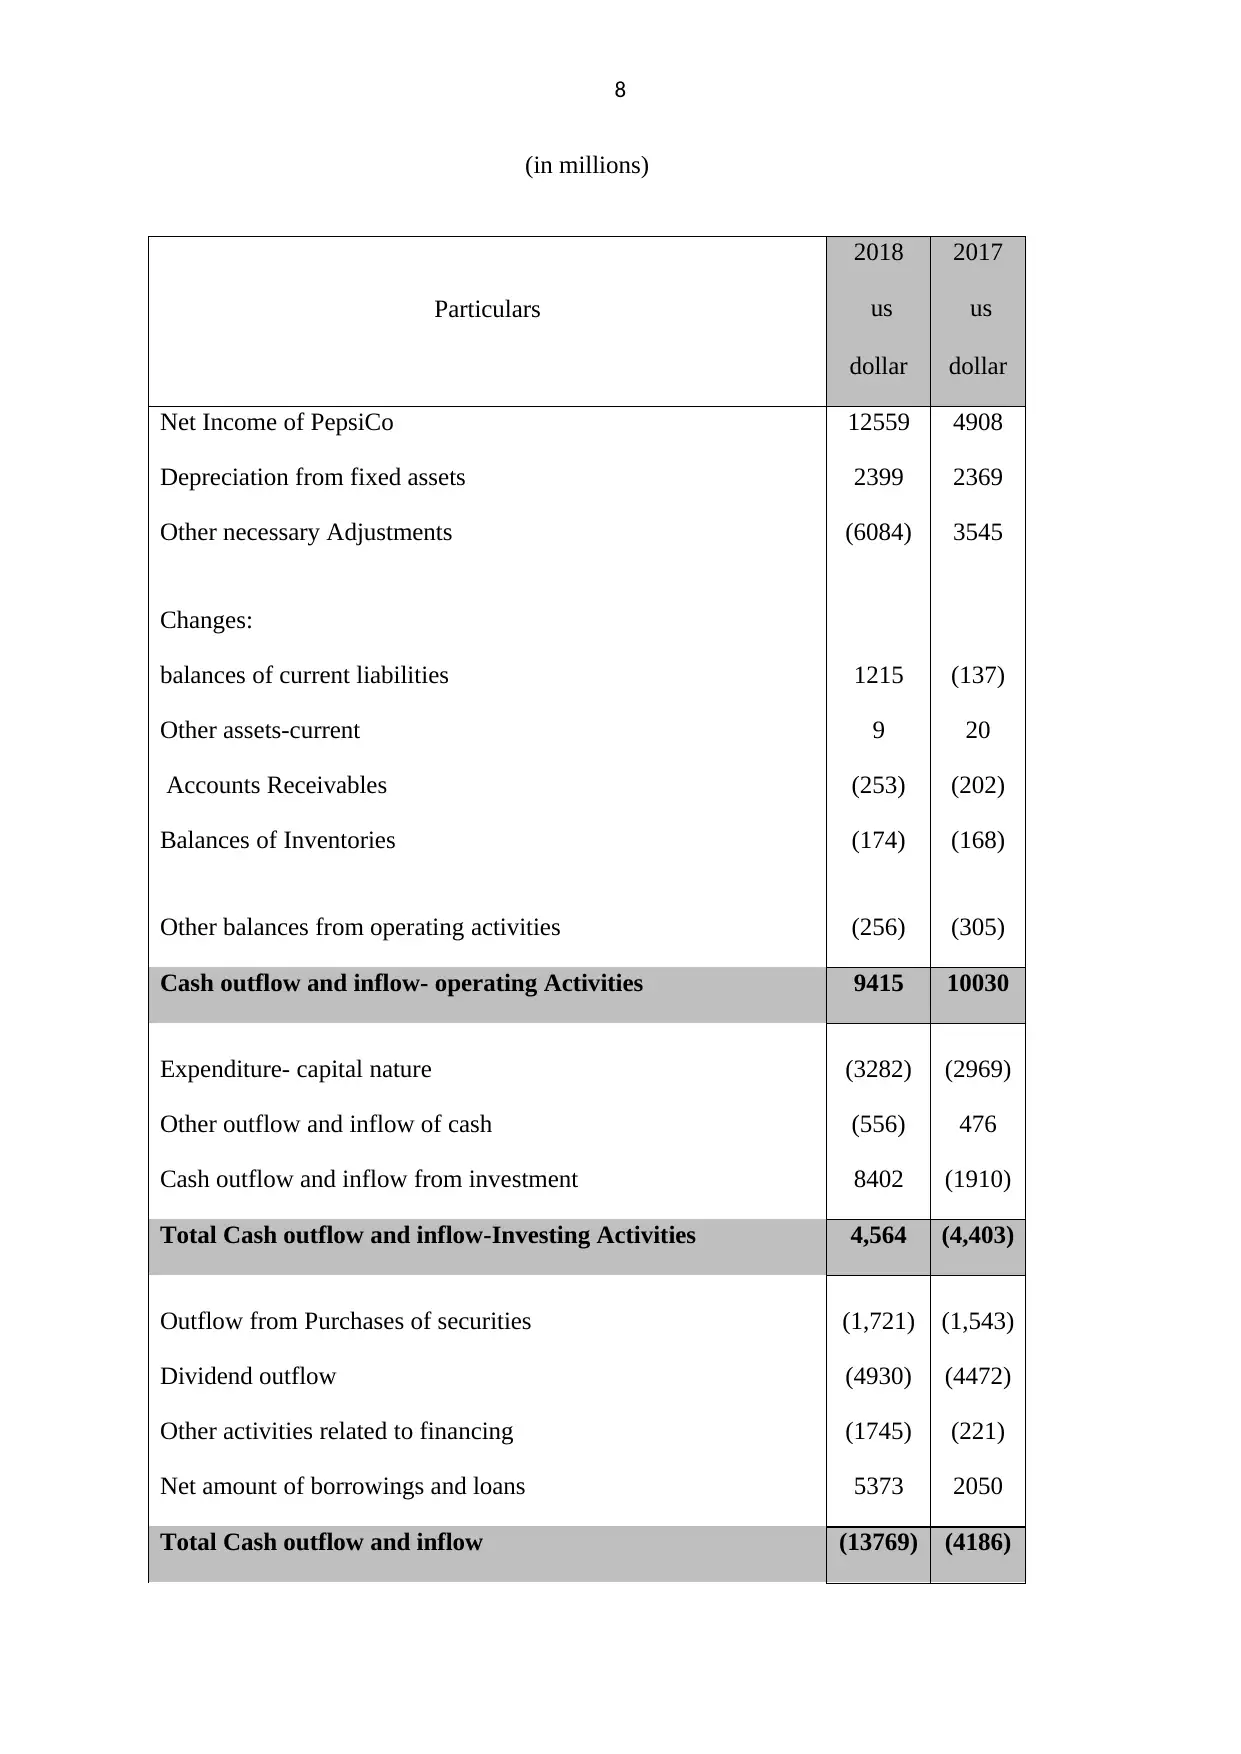
This report provides a comprehensive financial analysis of PepsiCo, examining its performance from 2017 to 2018. It begins with an overview of PepsiCo's history and operations, followed by an in-depth evaluation of its income statements, highlighting trends in revenue, gross profit, and operating income. The analysis extends to the statements of cash flow and financial position, scrutinizing the inflows and outflows from operating, investing, and financing activities, as well as changes in assets, liabilities, and equity. Key financial ratios, including short-term and long-term solvency ratios, inventory turnover, sales to accounts receivable, and return on equity (ROE), are calculated and interpreted to assess PepsiCo's financial health. The report also explores the company's capital structure, emphasizing the debt-to-equity ratio, and concludes with recommendations based on the financial analysis.
Document Page
1
Theory and its use in the financial statement
tabler-icon-diamond-filled.svg

Paraphrase This Document

Need a fresh take? Get an instant paraphrase of this document with our AI Paraphraser
Document Page
2
Table of Contents
History and overview of PepsiCo..............................................................................................3
Evaluation of statement of Income............................................................................................3
Finding and analysis of Statement of outflow and inflow of Cash and statement of financial
position.......................................................................................................................................5
Evaluation and study of financial Ratios.................................................................................10
Finding and analysis of long term solvency.............................................................................11
Finding and analysis of Sales to inventory..............................................................................11
Findings and analysis of Sales to Account Receivables..........................................................12
Findings and analysis of Sales and Earning.............................................................................13
Return on Equity and leverage of PepsiCo..............................................................................15
Recommendation and conclusions...........................................................................................15
References................................................................................................................................17
Document Page
3
History and overview of PepsiCo
PepsiCo is one of the largest sellers and manufacturers of beverage and food in the
industry of beverage and food. PepsiCo Food sector includes products such as pasta, cereals,
chips and flavored snacks. The beverage products are juices, sports drinks, coffee, tea, soft
drinks. Out of forty trademarks of packaged goods PepsiCo has already owned nine of them.
PepsiCo holds 22 different brands in its portfolio such as Lays, Pepsi, and Gatorade etc. In
1965 a huge merger took place between Frito Lay and PepsiCo. This merger assists PepsiCo
to expand its business in the industry of beverage and foods. The competitors of PepsiCo are
private, global and regional companies. Companies such as Kellogg, ConAgra foods are the
main competitor in the industry of food and companies such as Coca-Cola, Cott Corporation,
monster Beverage Company are the main competitors in beverage industry.
Evaluation of statement of Income
PepsiCo
Financial position of consolidated Income
(in millions)
Particulars
2018 2017
us
dollar
us
dollar
Revenue- Net 64,661 63,525
Less: Cost 29381 28796
GROSS Earnings 35280 34729
Operating Expenses of PepsiCo (25,170 (24,453
Document Page
4
) )
OPERATING PROFIT of PepsiCo 10,110 10,276
Expenses incurred on interest (1,525) (1,151)
Income- income accrued from interest 306 244
Other pension and retirement benefit income 298 233
INCOME BEFORE TAX 9,189 9,602
Income Tax Credit/(Expense) 3,370 (4,694)
INCOME AFTER TAX 12,559 4,908
Profit distributable to Non-Controlling Interests (44) (51)
Profit attributable to PepsiCo shareholders 12,515 4,857
Outstanding shares : Basic 1,415 1,425
Diluted 1,425 1,438
EPS- Diluted 8.78 3.38
EPS - Basic 8.84 3.41
While evaluating the statement of income of 2018 and 2017 which is the most recent
year’s statement of income of PepsiCo, it has been studied that in 2017 net revenue was us
dollar 63525 million and in 2018 it become us dollar 64661 million. Trend which is noticed
net earnings of PepsiCo is increasing trend. The percentage increase in net revenue is 1.8
percent in 2018. The gross profit of PepsiCo rises above from us dollar 34729 to us dollar
35280 million. The percentage increased in the gross profit is 1.59 in 2018. This represents
that Sales of PepsiCo increased rapidly in 2018. PepsiCo by including the nutritional products
in the year 2017 has expanded its profit.
While studying the statement of income it has been seen that Operating income in 2018
decreases by us dollar 166 million. The diminishing trend represent that PepsiCo cost of
tabler-icon-diamond-filled.svg

Paraphrase This Document

Need a fresh take? Get an instant paraphrase of this document with our AI Paraphraser
Document Page
5
operating activities also increases as compared to corresponding year 2017. Income which
accrued from interest by investment in different portfolio from interest has experienced a
trend which was above expectations by PepsiCo in 2018. The income accrued from interest
has experienced a growth rate of 25% in 2018. The income accrued before tax experienced a
diminishing trend in 2018. The income accrued before tax PepsiCo in 2017 was us dollar
9602 million and shown a fall down in the income amount in 2018. Total of 413 million US
dollar decreased in 2018. A fall down in the statistics of the income before tax in 2018 has
been noticed. The income before tax decreases by 4.3% in 2018.
Finding and analysis of Statement of outflow and inflow of Cash and statement of
financial position
PepsiCo
Statement of Financial position
(in millions
Particulars
2018 2017
us dollar us dollar
LIABILITIES & Equities of PepsiCo
PepsiCo Common Shareholders’ Equity 14518 11045
Preferred stock- Repurchase - (197)
Interest- Non-Controlling 84 92
Stock - preferred - 41
Total Equity of PepsiCo 14602 10981
Liabilities- long term 28295 33796
Other obligations 9114 11283
Document Page
6
Tax liabilities 3499 3242
40908 48321
Current Obligation/liabilities
Account payables 18112 15017
Obligation/liabilities- short term 4026 5485
22138 20502
TOTAL LIABILITIES and Equities 77648 79804
ASSETS
Equipment, plant and property 17589 17240
Intangibles
Intangibles which has been Amortized 1,644 1,268
Goodwill 14808 14744
assets which are intangible- lived assets 14,181 12,570
30633 28582
Investments 2409 2042
Taxes- Deferred 4364 -
Cash equivalent 8721 10461
Other kind of assets 760 913
Investments which are of short term 272 8,900
Cash of Restricted nature 1,997 -
Document Page
7
Other assets- current 633 1546
Account/Bill Receivables 7142 7024
Inventories/Stock 3128 2947
TOTAL ASSETS 77648 79804
PepsiCo is a world leading company in food and beverages industry. In the year 2013,
the revenue and earnings from food division were 52 percent and in the same year the
revenue and earnings from beverage division were 48 percent. A total of 66 US dollar billion
has been earned in that year from these two divisions. The sales or turnover of PepsiCo hah
increased rapidly when it was amalgamated with the snack company Frito Lay. PepsiCo
products which are perishable do not provide much revenue. PepsiCo sales its product in
schools, restaurants, stadiums, shops, mall, theatres, cinemas with the assistance of
intermediaries, dealers, distributors, salesman etc. The main segments from where the large
revenues of PepsiCo are derived are from: America’s beverages, middle-east, Asia and
Africa, Frito Lay division from America, Europe, and Quaker foods from North America.
The revenue from food division in 2017 was 53 percent and from beverages division the
revenue were 47 percent. The profit increased at a high rate when PepsiCo added in its
portfolio nutritional products.
PepsiCo
Statement of Cash Flows
tabler-icon-diamond-filled.svg

Paraphrase This Document

Need a fresh take? Get an instant paraphrase of this document with our AI Paraphraser
Document Page
8
(in millions)
Particulars
2018 2017
us
dollar
us
dollar
Net Income of PepsiCo 12559 4908
Depreciation from fixed assets 2399 2369
Other necessary Adjustments (6084) 3545
Changes:
balances of current liabilities 1215 (137)
Other assets-current 9 20
Accounts Receivables (253) (202)
Balances of Inventories (174) (168)
Other balances from operating activities (256) (305)
Cash outflow and inflow- operating Activities 9415 10030
Expenditure- capital nature (3282) (2969)
Other outflow and inflow of cash (556) 476
Cash outflow and inflow from investment 8402 (1910)
Total Cash outflow and inflow-Investing Activities 4,564 (4,403)
Outflow from Purchases of securities (1,721) (1,543)
Dividend outflow (4930) (4472)
Other activities related to financing (1745) (221)
Net amount of borrowings and loans 5373 2050
Total Cash outflow and inflow (13769) (4186)
Document Page
9
Increase in Cash Equivalents 210 1441
Profit and loss due to fluctuation in rate of exchange (98) 47
Restricted Cash - opening balances 10657 9169
Restricted cash equivalent- closing 10769 10657
As opined by Vats & Patel (2017), the cash which is generated and incurred from
three different activities such as from investing , operating , and from financing activities is
known as statement of cash flow. While studying cash outflow and inflow of PepsiCo, it has
been evaluated that net inflow of PepsiCo which has been accrued from operating activities
has shown a high growth in 2018. The outflow from depreciation on fixed assets of PepsiCo
has increased in 2018. In both2018 and 2017, balances of accounts receivables are negative.
This represents that PepsiCo has not hired any agency or experts to increase the receivables
balances. In both 2018 and 2017, the balances of inventories are negative. This negative
balance in inventories arises due to incorrect counting of inventories or due to timing
differences.
According to Buiter & Sibert (2018), expenditures which are of capital nature are
expenditures incurred to improve performance or capacity of plant, equipment or property.
The capital expenditure increased in 2018. This trend represent that PepsiCo has invest the
resources of the company to purchase new fixed assets for the company.
In 2018 the outflow of dividend was 4472 million dollar and in 2018 the outflow rises to
4472 million dollar. PepsiCo has distributed a large amount of dividend to its shareholders
and has not retained much of the portion of profits. In 2018 PepsiCo has utilized its idle cash
in purchase of securities. In 2017 the other outflow of financing activities was 221 million
dollars and in 2018 the outflow ware increased rapidly to 1745 million dollar.
Document Page
10
Evaluation and study of financial Ratios
PepsiCo
Analysis and evaluation of Financial Ratios
(in millions)
Particulars 2018 2017
Short-Term Solvency Ratios
Current Ratio 0.99 1.51
Stock turnover ratio 20.67 21.56
Turnover ratio- days 40.32 40.36
Solvent Ratios-long term
Coverage Ratio of interest 6.63 8.93
Cash flow to Total Liabilities 0.15 0.15
Return-Equity 0.86 0.45
Financial Leverage of PepsiCo 1.10 1.07
Finding and analysis of solvency- Long term
According to Vats, & Patel (2017), the solvency ratios which are of long term nature
can be evaluated by two ratios such as coverage ratios of interest and from operating flow of
cash to total liabilities. In 2017 the coverage ratios of interest were 8.93 and in 2018 it was
tabler-icon-diamond-filled.svg

Paraphrase This Document

Need a fresh take? Get an instant paraphrase of this document with our AI Paraphraser
Document Page
11
6.63. This diminishing trend represents that in 2018 PepsiCo ability to meet all its long term
obligations of interest decreases. The ability of PepsiCo to pay off the long term interest has
been lowered as compared to 2017. The financial leverage increased from 1.07 to 1.10 in
2018.
Finding and analysis of Sales ratio to inventory
Evaluation of Turnover and inventories
of PepsiCo
Net Turnover 64661 63525
Inventories balances 3128 2947
Turnover- Stock 20.67 21.56
Inventory turnover-
days
17.66 16.93
The ratio of inventory turnover in 2018 reduces to 20.56 . This represents that in 2018
the turnover of inventories reduces in 2018. In 2018 very less number of inventories has been
sold. The stock balances increases in 2018 due to weak sales of inventories.
Document Page
12
2018 2017
0
10000
20000
30000
40000
50000
60000
70000
Net revenue
Inventories
Findings and analysis of Sales to Account Receivables
Sales and Receivables
Net Sales 64661 63,525
Balances of Accounts
receivables from sales of products 905 904
Sales outstanding- days 4032 4036
Other accounts receivables 714 7024
chevron_up_icon
1 out of 18
circle_padding
hide_on_mobile
zoom_out_icon
[object Object]