Financial Analysis Report: Pizza Franchise Investment Decision
VerifiedAdded on  2021/06/14
|10
|1907
|21
Report
AI Summary
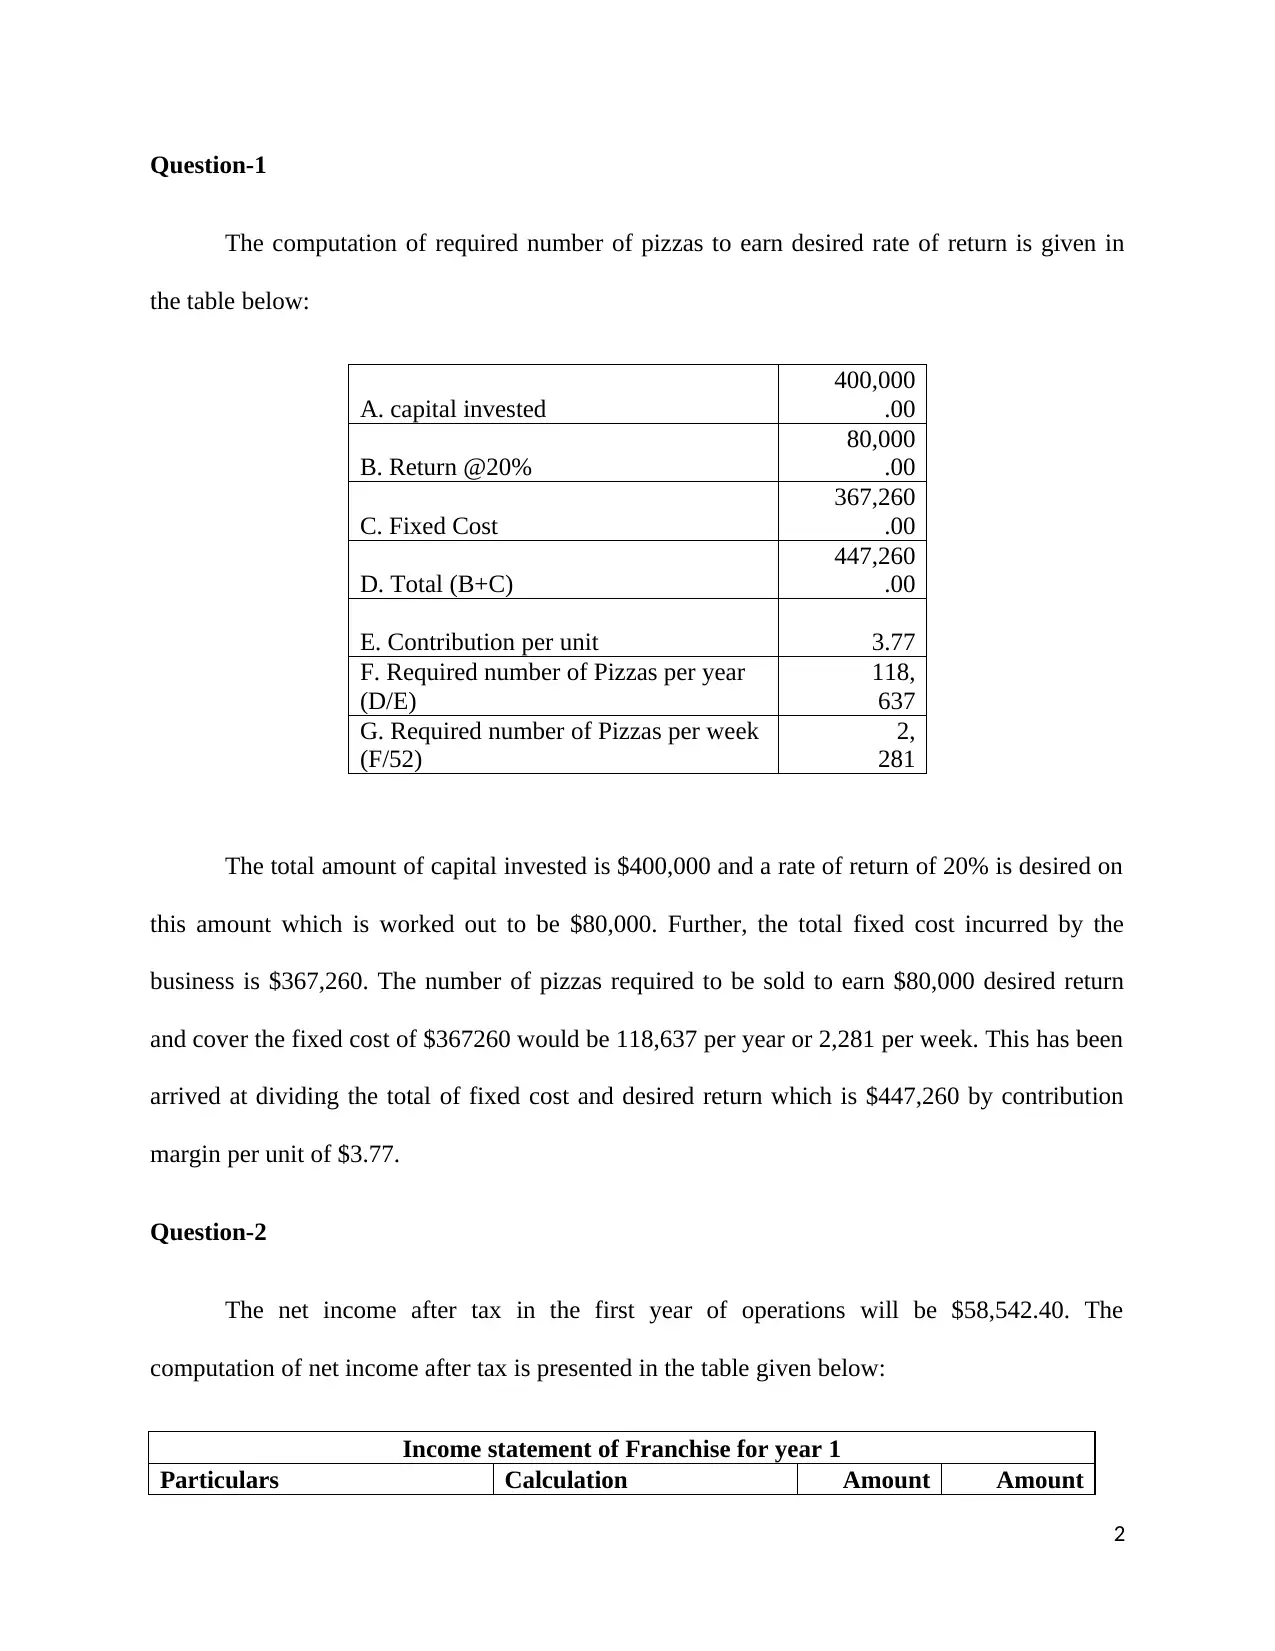
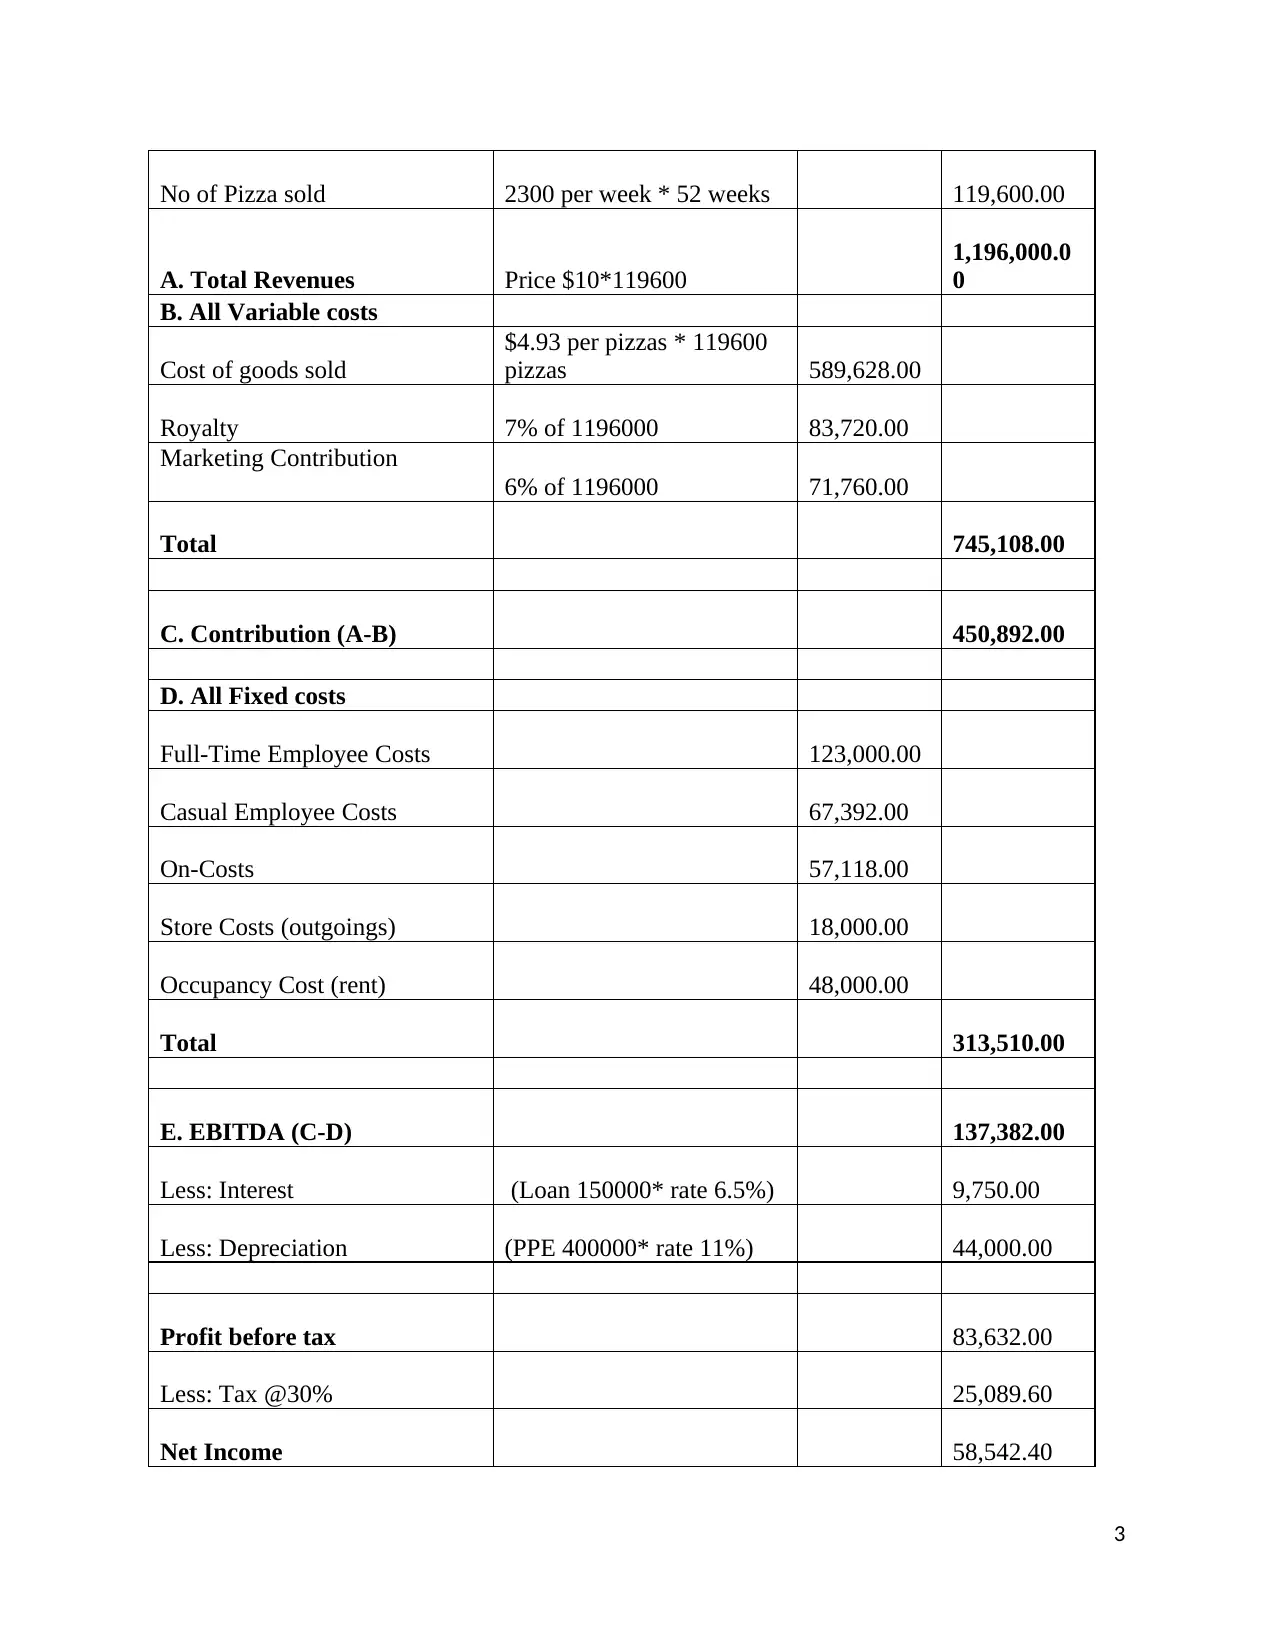
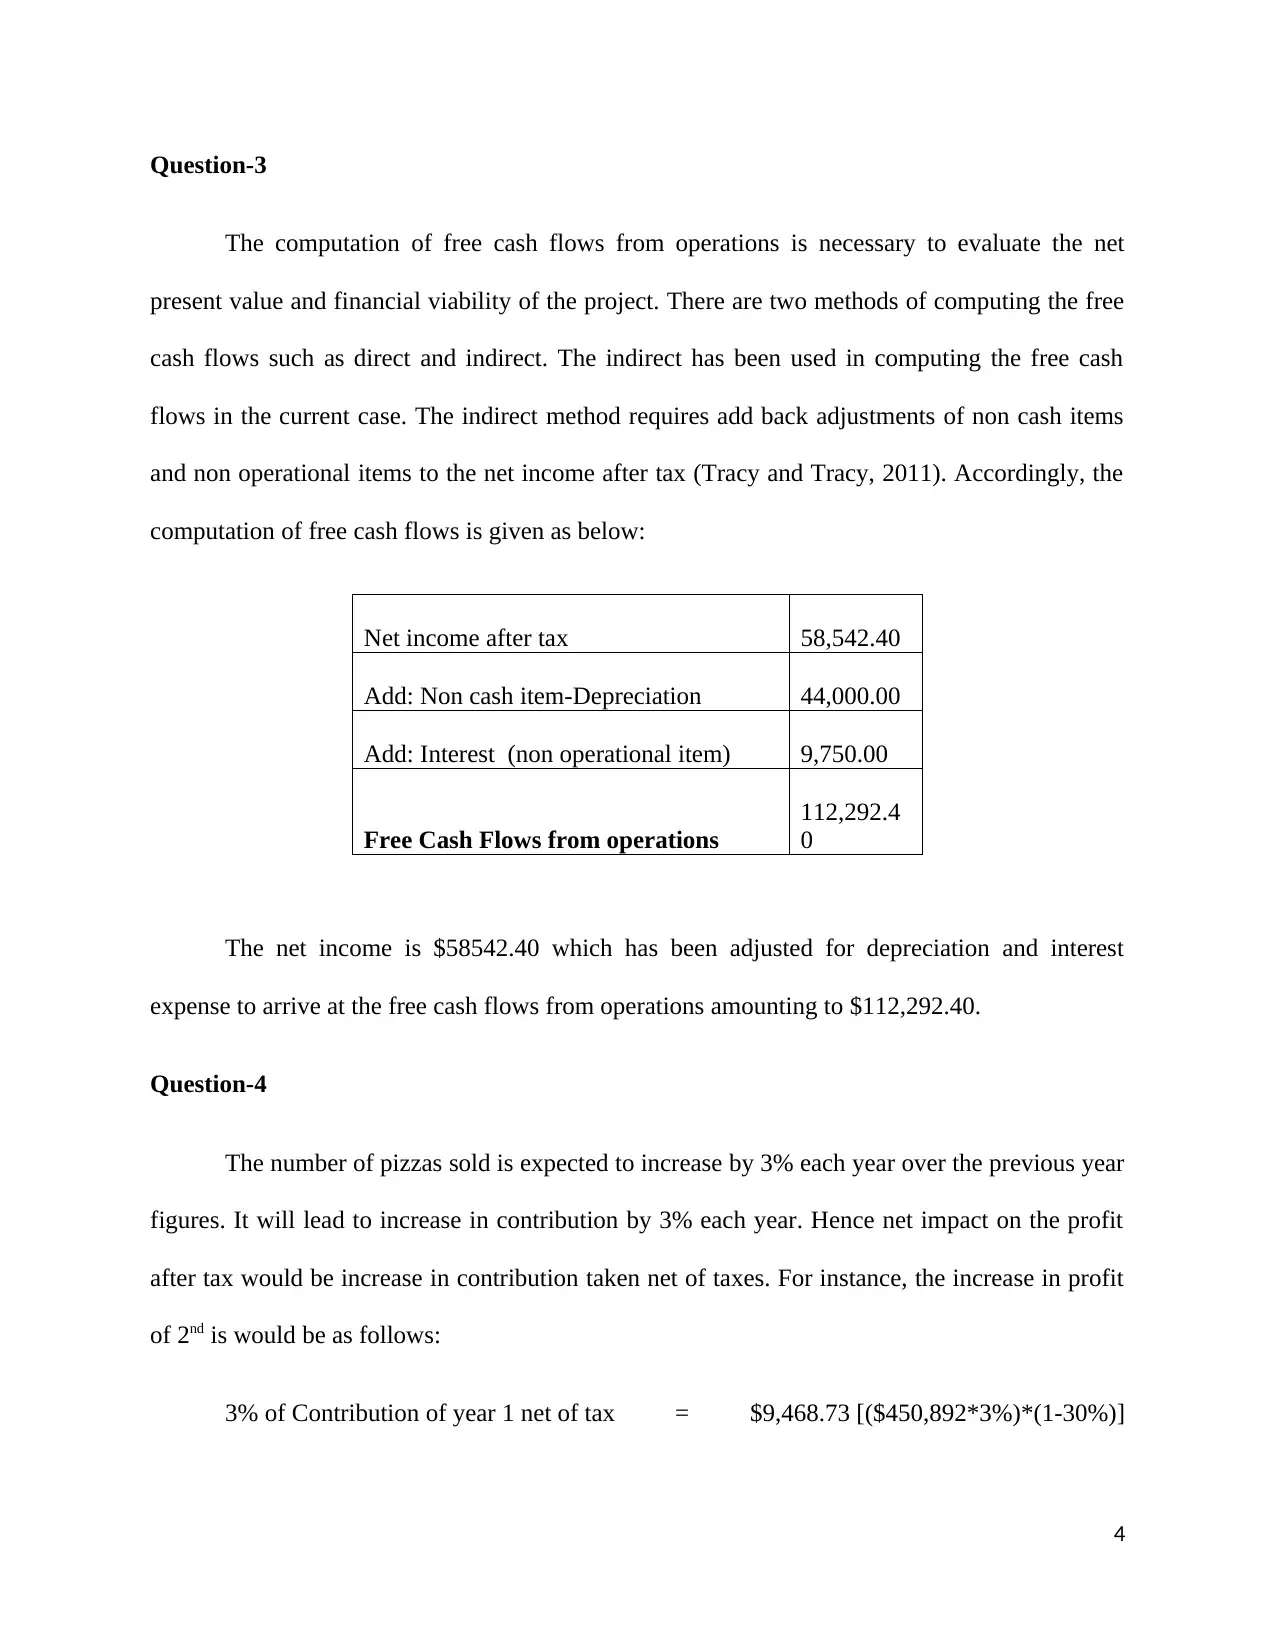
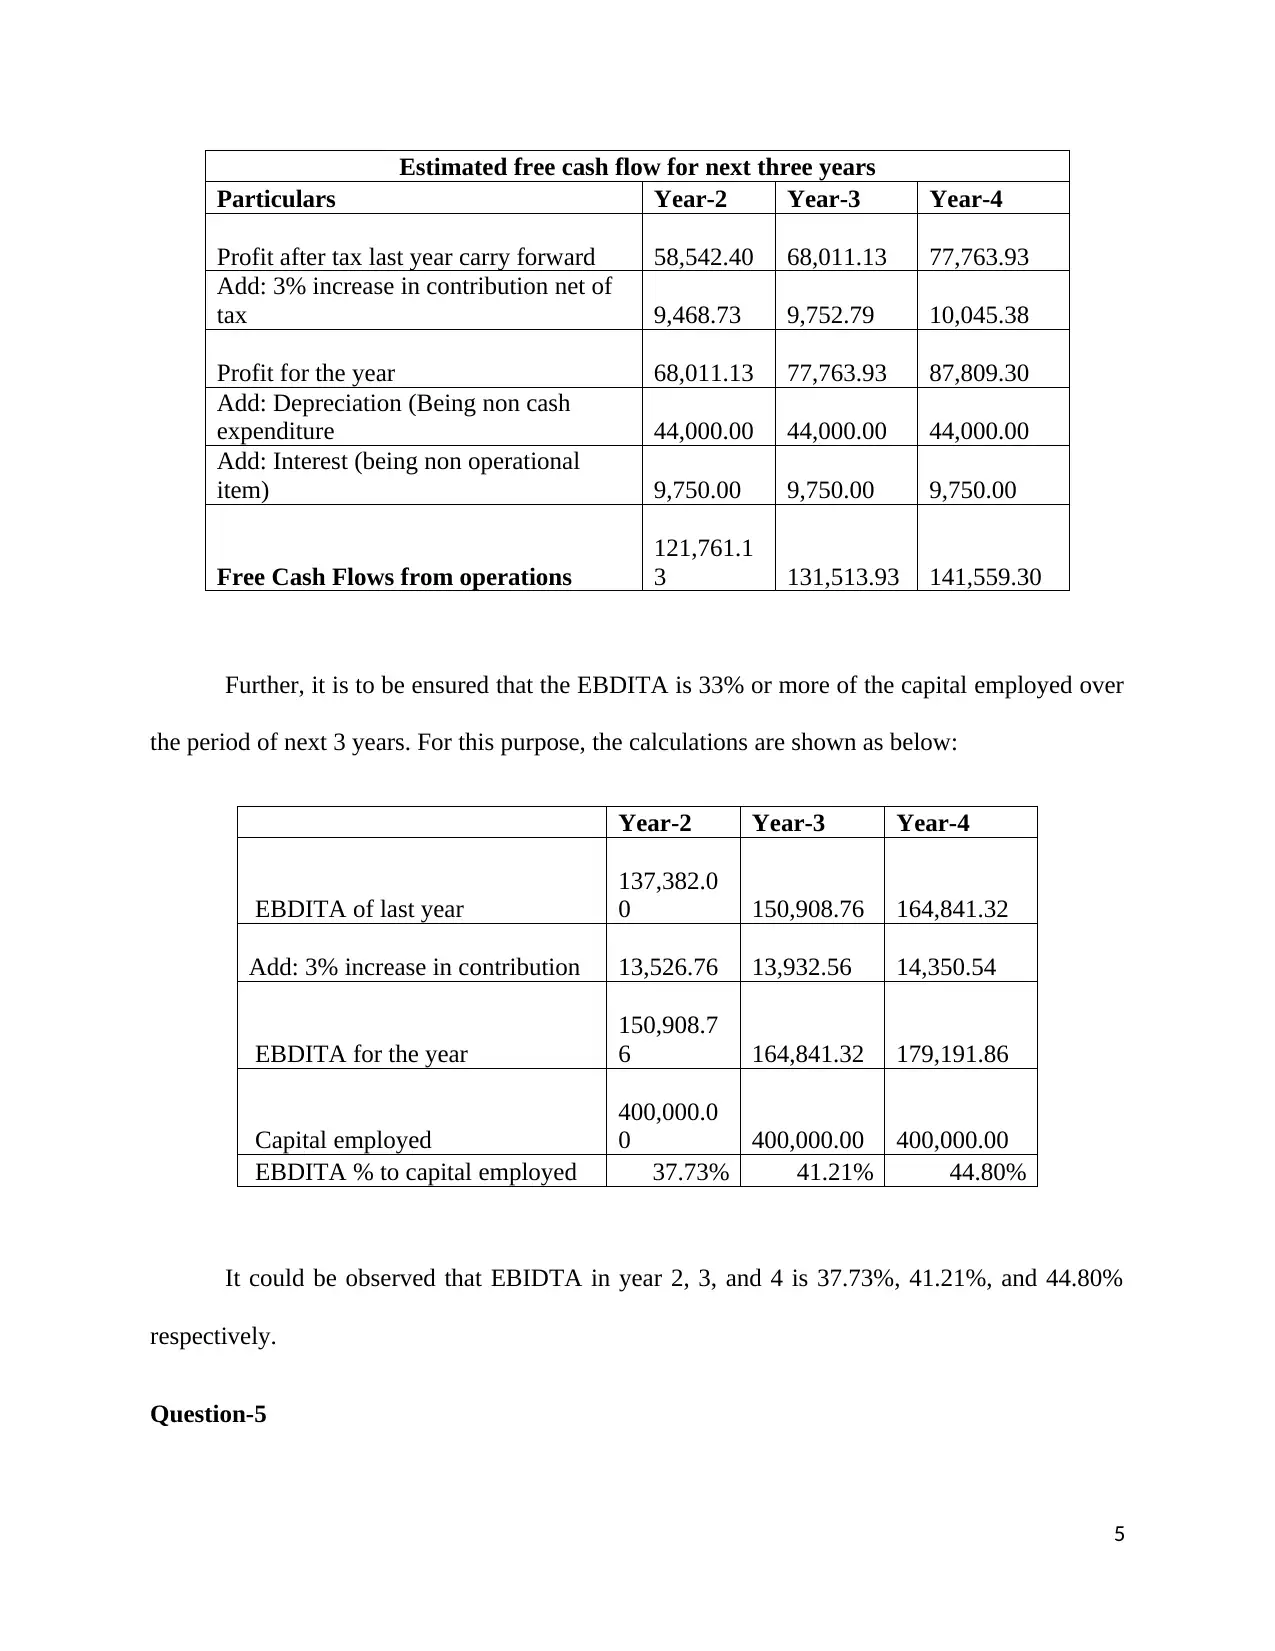
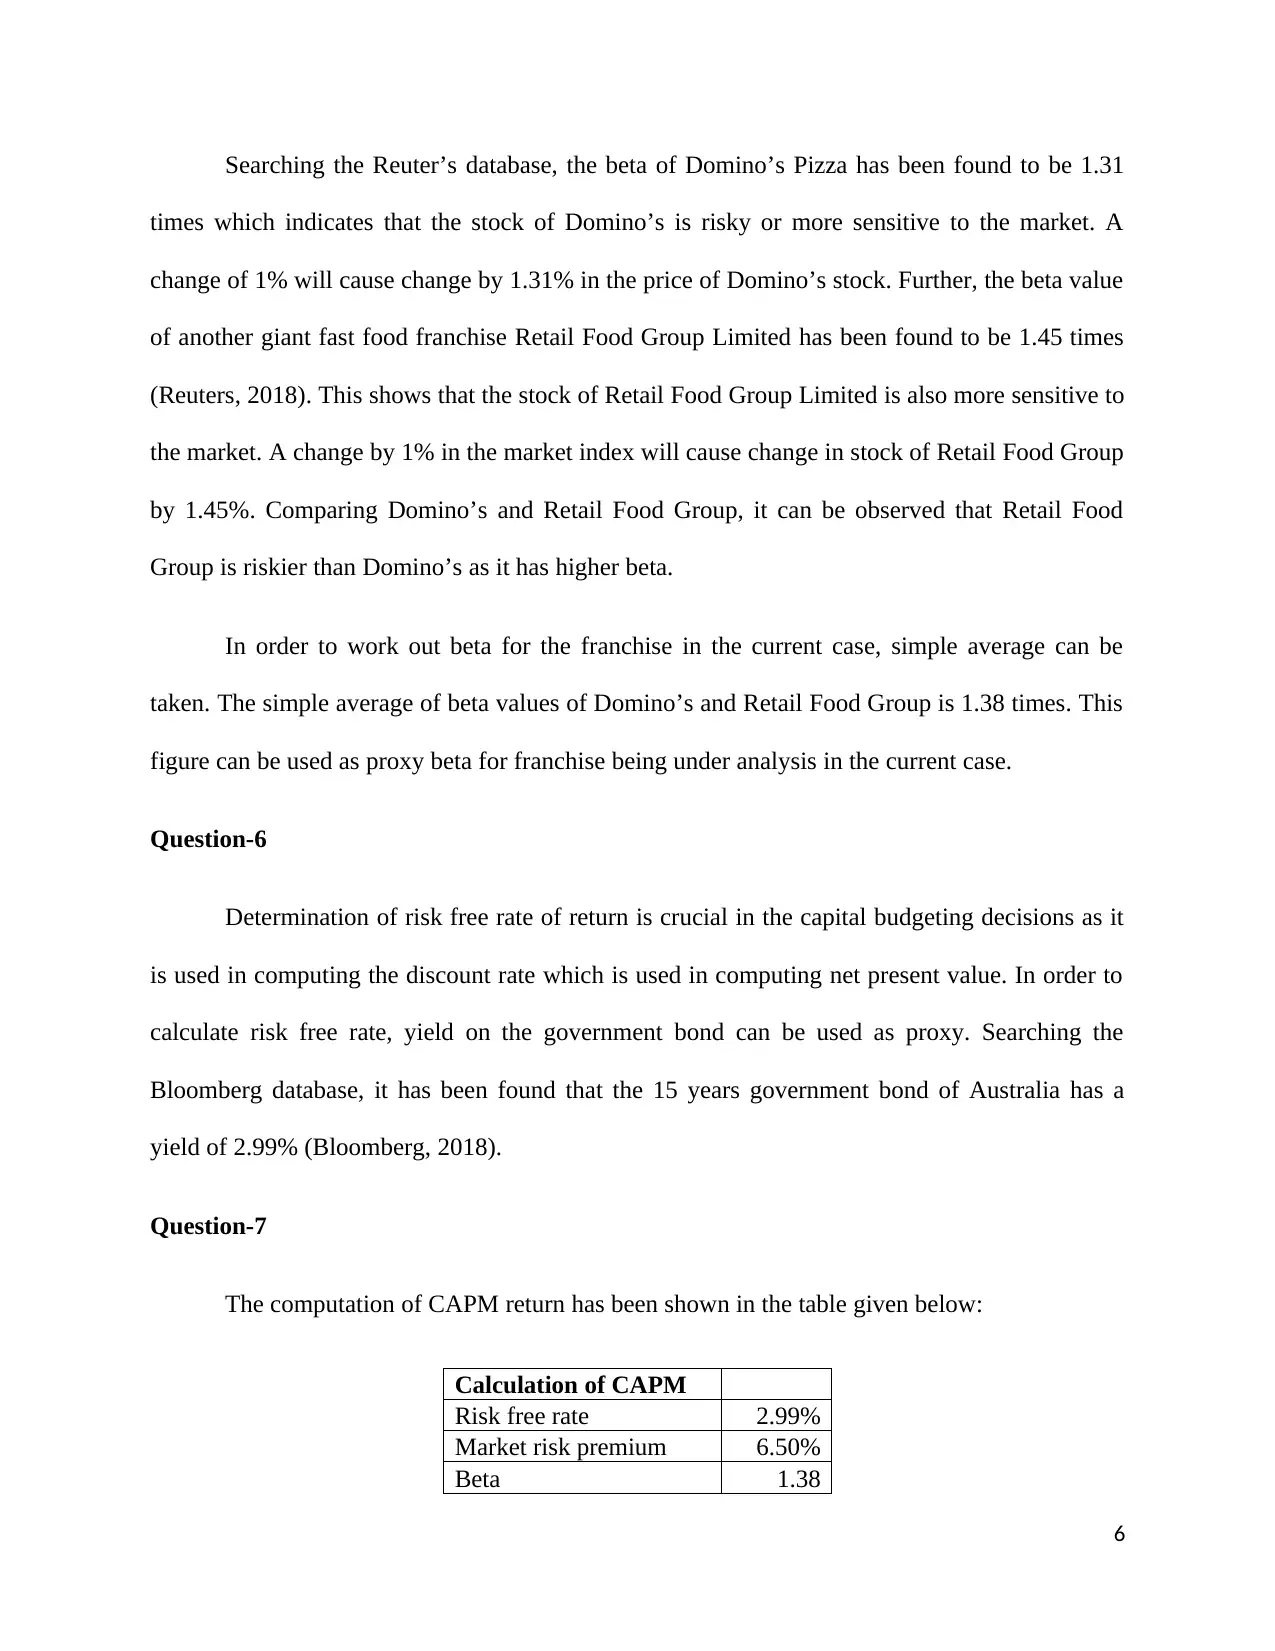
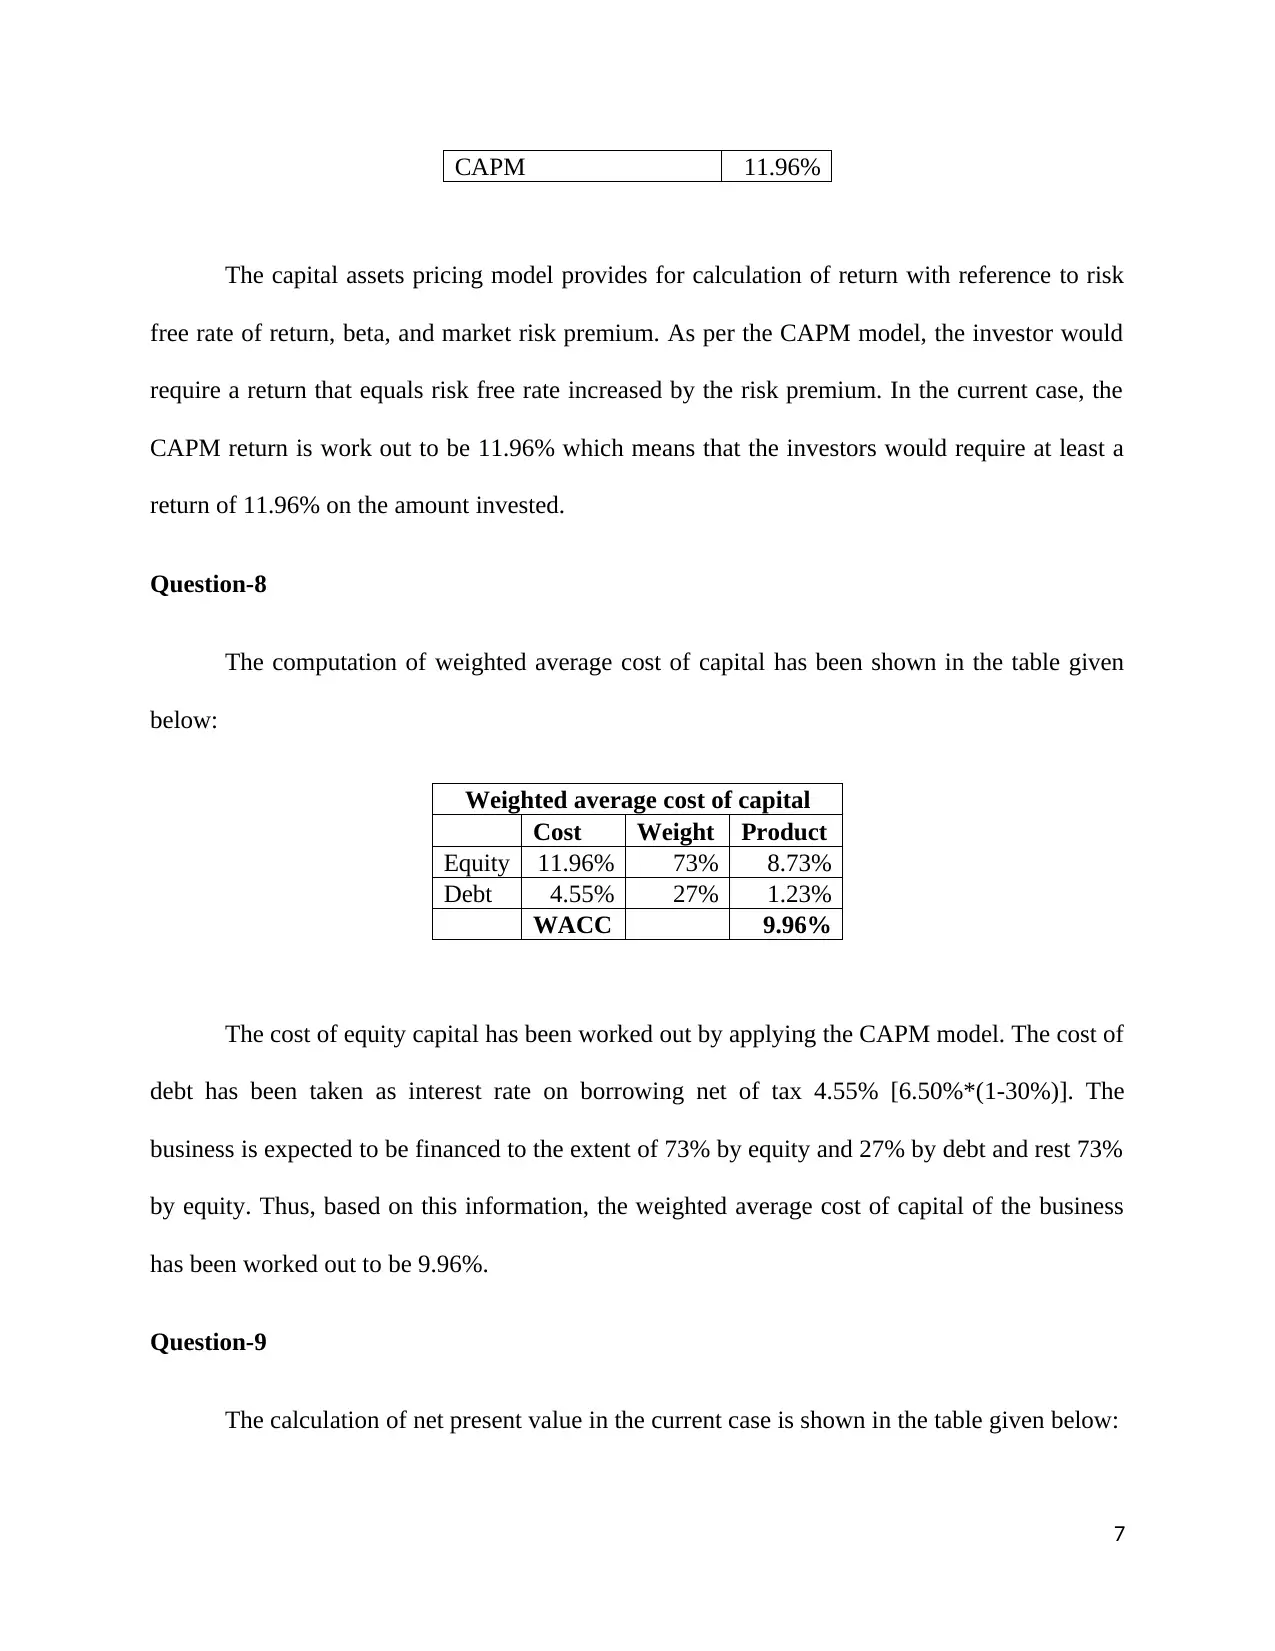
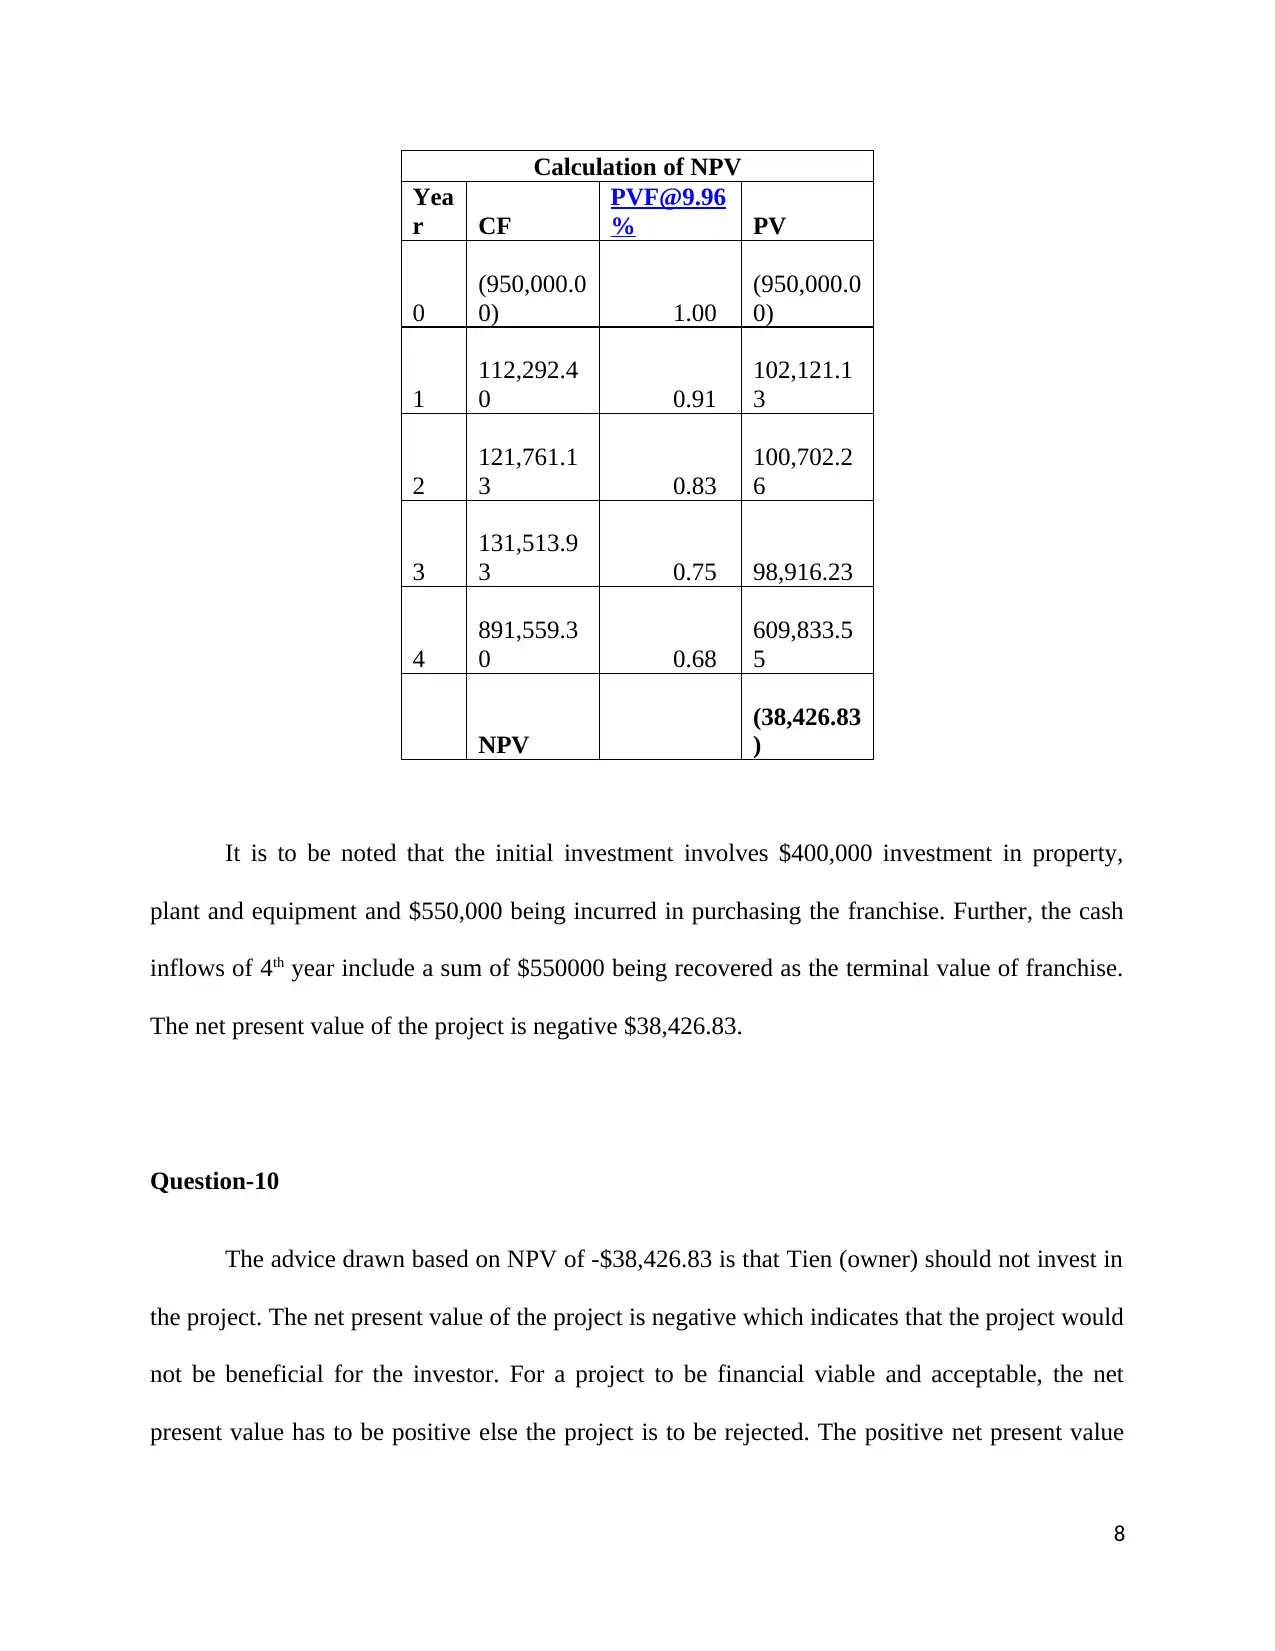
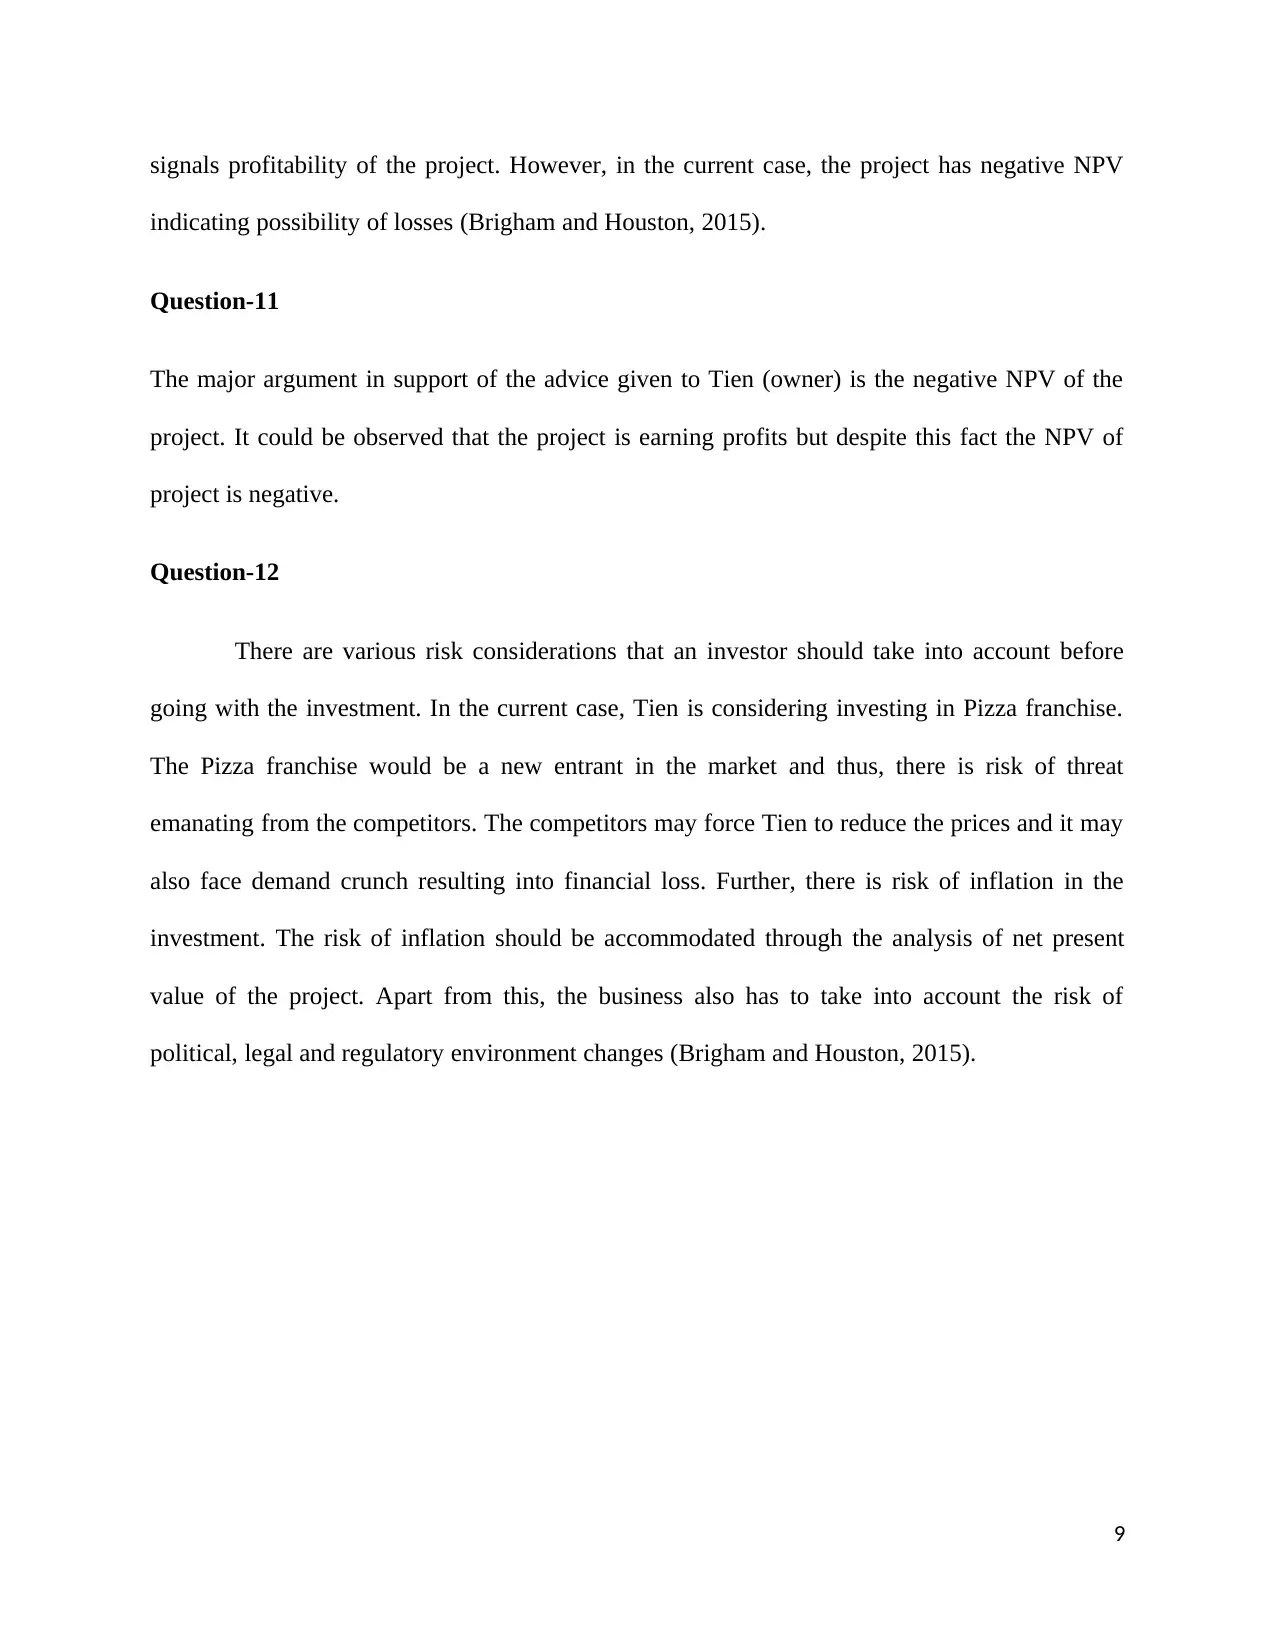
This report presents a comprehensive financial analysis of a proposed pizza franchise investment. It begins by calculating the required number of pizzas to achieve a desired rate of return, considering capital invested, fixed costs, and contribution margin. The report then projects the franchise's income statement for the first year, detailing revenues, variable costs, fixed costs, and net income after tax. Free cash flows from operations are computed using the indirect method, and projections are made for the subsequent three years, considering a 3% annual increase in pizza sales and contribution. The analysis also includes the determination of beta, risk-free rate, and market risk premium to calculate the Capital Asset Pricing Model (CAPM) return and Weighted Average Cost of Capital (WACC). Finally, the Net Present Value (NPV) of the project is calculated, leading to the conclusion that the investment should not be undertaken due to a negative NPV. The report also discusses various risk considerations and provides a list of references.

Accounting and Finance for Business
1
1
Paraphrase This Document
Need a fresh take? Get an instant paraphrase of this document with our AI Paraphraser

Question-1
The computation of required number of pizzas to earn desired rate of return is given in
the table below:
A. capital invested
400,000
.00
B. Return @20%
80,000
.00
C. Fixed Cost
367,260
.00
D. Total (B+C)
447,260
.00
E. Contribution per unit 3.77
F. Required number of Pizzas per year
(D/E)
118,
637
G. Required number of Pizzas per week
(F/52)
2,
281
The total amount of capital invested is $400,000 and a rate of return of 20% is desired on
this amount which is worked out to be $80,000. Further, the total fixed cost incurred by the
business is $367,260. The number of pizzas required to be sold to earn $80,000 desired return
and cover the fixed cost of $367260 would be 118,637 per year or 2,281 per week. This has been
arrived at dividing the total of fixed cost and desired return which is $447,260 by contribution
margin per unit of $3.77.
Question-2
The net income after tax in the first year of operations will be $58,542.40. The
computation of net income after tax is presented in the table given below:
Income statement of Franchise for year 1
Particulars Calculation Amount Amount
2

No of Pizza sold 2300 per week * 52 weeks 119,600.00
A. Total Revenues Price $10*119600
1,196,000.0
0
B. All Variable costs
Cost of goods sold
$4.93 per pizzas * 119600
pizzas 589,628.00
Royalty 7% of 1196000 83,720.00
Marketing Contribution
6% of 1196000 71,760.00
Total 745,108.00
C. Contribution (A-B) 450,892.00
D. All Fixed costs
Full-Time Employee Costs 123,000.00
Casual Employee Costs 67,392.00
On-Costs 57,118.00
Store Costs (outgoings) 18,000.00
Occupancy Cost (rent) 48,000.00
Total 313,510.00
E. EBITDA (C-D) 137,382.00
Less: Interest (Loan 150000* rate 6.5%) 9,750.00
Less: Depreciation (PPE 400000* rate 11%) 44,000.00
Profit before tax 83,632.00
Less: Tax @30% 25,089.60
Net Income 58,542.40
3
⊘ This is a preview!⊘
Do you want full access?
Subscribe today to unlock all pages.

Trusted by 1+ million students worldwide

Question-3
The computation of free cash flows from operations is necessary to evaluate the net
present value and financial viability of the project. There are two methods of computing the free
cash flows such as direct and indirect. The indirect has been used in computing the free cash
flows in the current case. The indirect method requires add back adjustments of non cash items
and non operational items to the net income after tax (Tracy and Tracy, 2011). Accordingly, the
computation of free cash flows is given as below:
Net income after tax 58,542.40
Add: Non cash item-Depreciation 44,000.00
Add: Interest (non operational item) 9,750.00
Free Cash Flows from operations
112,292.4
0
The net income is $58542.40 which has been adjusted for depreciation and interest
expense to arrive at the free cash flows from operations amounting to $112,292.40.
Question-4
The number of pizzas sold is expected to increase by 3% each year over the previous year
figures. It will lead to increase in contribution by 3% each year. Hence net impact on the profit
after tax would be increase in contribution taken net of taxes. For instance, the increase in profit
of 2nd is would be as follows:
3% of Contribution of year 1 net of tax = $9,468.73 [($450,892*3%)*(1-30%)]
4
Paraphrase This Document
Need a fresh take? Get an instant paraphrase of this document with our AI Paraphraser

Estimated free cash flow for next three years
Particulars Year-2 Year-3 Year-4
Profit after tax last year carry forward 58,542.40 68,011.13 77,763.93
Add: 3% increase in contribution net of
tax 9,468.73 9,752.79 10,045.38
Profit for the year 68,011.13 77,763.93 87,809.30
Add: Depreciation (Being non cash
expenditure 44,000.00 44,000.00 44,000.00
Add: Interest (being non operational
item) 9,750.00 9,750.00 9,750.00
Free Cash Flows from operations
121,761.1
3 131,513.93 141,559.30
Further, it is to be ensured that the EBDITA is 33% or more of the capital employed over
the period of next 3 years. For this purpose, the calculations are shown as below:
Year-2 Year-3 Year-4
EBDITA of last year
137,382.0
0 150,908.76 164,841.32
Add: 3% increase in contribution 13,526.76 13,932.56 14,350.54
EBDITA for the year
150,908.7
6 164,841.32 179,191.86
Capital employed
400,000.0
0 400,000.00 400,000.00
EBDITA % to capital employed 37.73% 41.21% 44.80%
It could be observed that EBIDTA in year 2, 3, and 4 is 37.73%, 41.21%, and 44.80%
respectively.
Question-5
5

Searching the Reuter’s database, the beta of Domino’s Pizza has been found to be 1.31
times which indicates that the stock of Domino’s is risky or more sensitive to the market. A
change of 1% will cause change by 1.31% in the price of Domino’s stock. Further, the beta value
of another giant fast food franchise Retail Food Group Limited has been found to be 1.45 times
(Reuters, 2018). This shows that the stock of Retail Food Group Limited is also more sensitive to
the market. A change by 1% in the market index will cause change in stock of Retail Food Group
by 1.45%. Comparing Domino’s and Retail Food Group, it can be observed that Retail Food
Group is riskier than Domino’s as it has higher beta.
In order to work out beta for the franchise in the current case, simple average can be
taken. The simple average of beta values of Domino’s and Retail Food Group is 1.38 times. This
figure can be used as proxy beta for franchise being under analysis in the current case.
Question-6
Determination of risk free rate of return is crucial in the capital budgeting decisions as it
is used in computing the discount rate which is used in computing net present value. In order to
calculate risk free rate, yield on the government bond can be used as proxy. Searching the
Bloomberg database, it has been found that the 15 years government bond of Australia has a
yield of 2.99% (Bloomberg, 2018).
Question-7
The computation of CAPM return has been shown in the table given below:
Calculation of CAPM
Risk free rate 2.99%
Market risk premium 6.50%
Beta 1.38
6
⊘ This is a preview!⊘
Do you want full access?
Subscribe today to unlock all pages.

Trusted by 1+ million students worldwide

CAPM 11.96%
The capital assets pricing model provides for calculation of return with reference to risk
free rate of return, beta, and market risk premium. As per the CAPM model, the investor would
require a return that equals risk free rate increased by the risk premium. In the current case, the
CAPM return is work out to be 11.96% which means that the investors would require at least a
return of 11.96% on the amount invested.
Question-8
The computation of weighted average cost of capital has been shown in the table given
below:
Weighted average cost of capital
Cost Weight Product
Equity 11.96% 73% 8.73%
Debt 4.55% 27% 1.23%
WACC 9.96%
The cost of equity capital has been worked out by applying the CAPM model. The cost of
debt has been taken as interest rate on borrowing net of tax 4.55% [6.50%*(1-30%)]. The
business is expected to be financed to the extent of 73% by equity and 27% by debt and rest 73%
by equity. Thus, based on this information, the weighted average cost of capital of the business
has been worked out to be 9.96%.
Question-9
The calculation of net present value in the current case is shown in the table given below:
7
Paraphrase This Document
Need a fresh take? Get an instant paraphrase of this document with our AI Paraphraser

Calculation of NPV
Yea
r CF
PVF@9.96
% PV
0
(950,000.0
0) 1.00
(950,000.0
0)
1
112,292.4
0 0.91
102,121.1
3
2
121,761.1
3 0.83
100,702.2
6
3
131,513.9
3 0.75 98,916.23
4
891,559.3
0 0.68
609,833.5
5
NPV
(38,426.83
)
It is to be noted that the initial investment involves $400,000 investment in property,
plant and equipment and $550,000 being incurred in purchasing the franchise. Further, the cash
inflows of 4th year include a sum of $550000 being recovered as the terminal value of franchise.
The net present value of the project is negative $38,426.83.
Question-10
The advice drawn based on NPV of -$38,426.83 is that Tien (owner) should not invest in
the project. The net present value of the project is negative which indicates that the project would
not be beneficial for the investor. For a project to be financial viable and acceptable, the net
present value has to be positive else the project is to be rejected. The positive net present value
8

signals profitability of the project. However, in the current case, the project has negative NPV
indicating possibility of losses (Brigham and Houston, 2015).
Question-11
The major argument in support of the advice given to Tien (owner) is the negative NPV of the
project. It could be observed that the project is earning profits but despite this fact the NPV of
project is negative.
Question-12
There are various risk considerations that an investor should take into account before
going with the investment. In the current case, Tien is considering investing in Pizza franchise.
The Pizza franchise would be a new entrant in the market and thus, there is risk of threat
emanating from the competitors. The competitors may force Tien to reduce the prices and it may
also face demand crunch resulting into financial loss. Further, there is risk of inflation in the
investment. The risk of inflation should be accommodated through the analysis of net present
value of the project. Apart from this, the business also has to take into account the risk of
political, legal and regulatory environment changes (Brigham and Houston, 2015).
9
⊘ This is a preview!⊘
Do you want full access?
Subscribe today to unlock all pages.

Trusted by 1+ million students worldwide

References
Abdullahi, S.R. and Sulaimon, B.A. 2017. Cost-Volume-Profit Analysis as a Management Tool
for Decision Making In Small Business Enterprise within Bayero University, Kano. Journal of
Business and Management, 19(2), pp. 40-45.
Bloomberg. 2018. Government Bond Yield. [Online]. Available at:
https://www.bloomberg.com/markets/rates-bonds/government-bonds/Australia [Accessed on:
May 16, 2018].
Brigham, E.F. and Houston, J.F. 2015. Fundamentals of Financial Management. Cengage
Learning.
Reuters. 2018. Domino's Pizza Enterprises Ltd (DMP.AX). [Online]. Available at:
https://www.reuters.com/finance/stocks/overview/DMP.AX [Accessed on: May 16, 2018].
Reuters. 2018. Domino's Pizza Enterprises Ltd (DMP.AX). [Online]. Available at:
https://www.reuters.com/finance/stocks/overview/RFG.AX [Accessed on: May 16, 2018].
Tracy, J.A. and Tracy, T. 2011. Cash Flow For Dummies. John Wiley & Sons.
10
1 out of 10
Related Documents

Your All-in-One AI-Powered Toolkit for Academic Success.
 +13062052269
info@desklib.com
Available 24*7 on WhatsApp / Email
Unlock your academic potential
© 2024  |  Zucol Services PVT LTD  |  All rights reserved.