Financial Analysis and Acquisition Impact: PPHE Hotel Group and ABHL
VerifiedAdded on 2023/04/20
|37
|6582
|453
Report
AI Summary
This report provides a comprehensive financial analysis of the proposed acquisition of Andrew Brownsword Hotel Group Ltd (ABHL) by PPHE Hotel Group Ltd. It begins with an executive summary, followed by an overview of the financial analysis, including competitor analysis, horizontal and vertical analysis of financial statements, and a detailed ratio analysis covering profitability, liquidity, and asset management. The report delves into the cost of capital for both PPHE and ABHL, including the weighted average cost of capital (WACC) and the capital structure rationale. Furthermore, it assesses the purchase price acquisition analysis, its potential impact on PPHE, and conducts a share valuation using the Free Cash Flow Model. The report concludes with an evaluation of the share price movement and the overall implications of the acquisition, supported by financial data presented in the appendix, offering valuable insights into the financial feasibility and strategic alignment of the acquisition.
Running head: ACQUISITION ANALYSIS
Acquisition Analysis
Name of the Student:
Name of the University:
Author’s Note:
Acquisition Analysis
Name of the Student:
Name of the University:
Author’s Note:
Paraphrase This Document
Need a fresh take? Get an instant paraphrase of this document with our AI Paraphraser
1FINANCIAL ANALYSIS
Table of Contents
Financial Analysis...........................................................................................................................4
Horizontal and Vertical Analysis.................................................................................................5
Ratio Analysis..............................................................................................................................7
Cost of Capital.................................................................................................................................9
PPHE Ltd Cost of Capital............................................................................................................9
ABHL Capital Cost....................................................................................................................10
Capital Structure Rationale........................................................................................................11
Purchase Price Acquisition Analysis.............................................................................................11
Acquisition Impact on PPHE Hotel Company Ltd........................................................................12
Share Valuation.............................................................................................................................14
Conclusion.....................................................................................................................................16
References......................................................................................................................................17
Appendix........................................................................................................................................19
2FINANCIAL ANALYSIS
Executive Summary
The financial acquisition analysis of the PPHE Hotel Group and Andrew Brownsword Hotel
group Ltd was done for the purpose of the analysis of the consolidation. The operations of both
the company was found to be identical with both the companies serving in the hotel and
hospitality industry. The financial analysis of the company including the analysis of the
profitability of the company and the various other factors that directly affects the operations of
the company were taken into consideration for the purpose of the analysis of the company.
Operations of the PPHE Hotel Group Ltd is spread globally in the leading cities of the Europe
where the company is having a £1.6 billion portfolio. The profitability condition, liquidity
aspects, asset management done by the company and the investor’s relation for the company
were some of the crucial aspect that were taken into consideration for the purpose of the analysis.
The Andrew Brownsword Hotel Group is a renowned hotel group company having a wide range
of collection of the various property in the property portfolio of the company was taken into
consideration for the company. The cost of capital for both the PPHE Hotel Group Company and
Andrew Brownsword Hotel was taken into consideration for the purpose of the analysis of the
company. The weighted average cost of capital or both the company was taken into
consideration for the company by including the weight of debt for the company and the weight of
equity for the company. The value of equity and debt for both the company was also considered
for the analysis of WACC. The CAPM equation was used for determining the cost of equity for
both the companies. ABHL is not a public company and the PPHE Hotel Group will be acquiring
the same for acquiring the company for the synergy that is analysed by the acquiring company.
The share price evaluation for the company was done for the company through the process of
evaluating the share price of the company with the Free Cash Flow Model and the per share
⊘ This is a preview!⊘
Do you want full access?
Subscribe today to unlock all pages.
Trusted by 1+ million students worldwide
3FINANCIAL ANALYSIS
valuation for the company. The effect on the financial statements of the PPHE Company was
also analysed for the company considering the consolidation of the financial statement for both
the company. The share price movement of the company was also evaluated for the company
considering the movement of the market share price of the company and the underlying value of
the PPHE.
Paraphrase This Document
Need a fresh take? Get an instant paraphrase of this document with our AI Paraphraser
4FINANCIAL ANALYSIS
Financial Analysis
The financial analysis of the company shows the process of evaluation of the business
projects, budgets and various bother business entities for assessing the performance of the
company and the sustainability of the various factors of the company. PPHE Hotel Group Ltd is
an international hospitality reals estate company having a £1.6 billion portfolio under the
property portfolio of the company. The operations of the company is primarily distributed in the
leading cities of Europe, urban market and resort destinations. The company was founded in the
year 1989 and is a listed public company in the London Stock Exchange with its ticker symbol
PPH. The revenue for the company was around £325.1 million in the year 2017 and the net
income in the same year was around £32.1 million. The company is having a wide base of
employee of around 2600 employees in the company. The property portfolio of the PPHE Hotel
Company consists of around 46 properties with approximately 8,800 rooms and around 6,000 of
campsite pitches. Andrew Brownsword Hotel owned and managed by the founders of the
company Andrew Brownsword and Christina. The company is having thirteen properties in the
countryside setting and city centre locations. Each of the property owned by the Andrew
Brownsword Hotel is unique property and having a distinctive characteristics embracing the
heritage property they have in their property portfolio.
The financial analysis of the company can be done with the help of the analysis of the
various companies operating in the same industry. The financial analysis of the company will be
conducted with the market cap of the company. The respective operating income of the company
or the Earnings before interest tax and depreciation for the companies (Appendix 2). The
Enterprise value/ EBITDA, Enterprise Value/Sales and Price to Earnings for the respective
Companies was performed for assessing the valuation of the company (Appendix 1). The trend
5FINANCIAL ANALYSIS
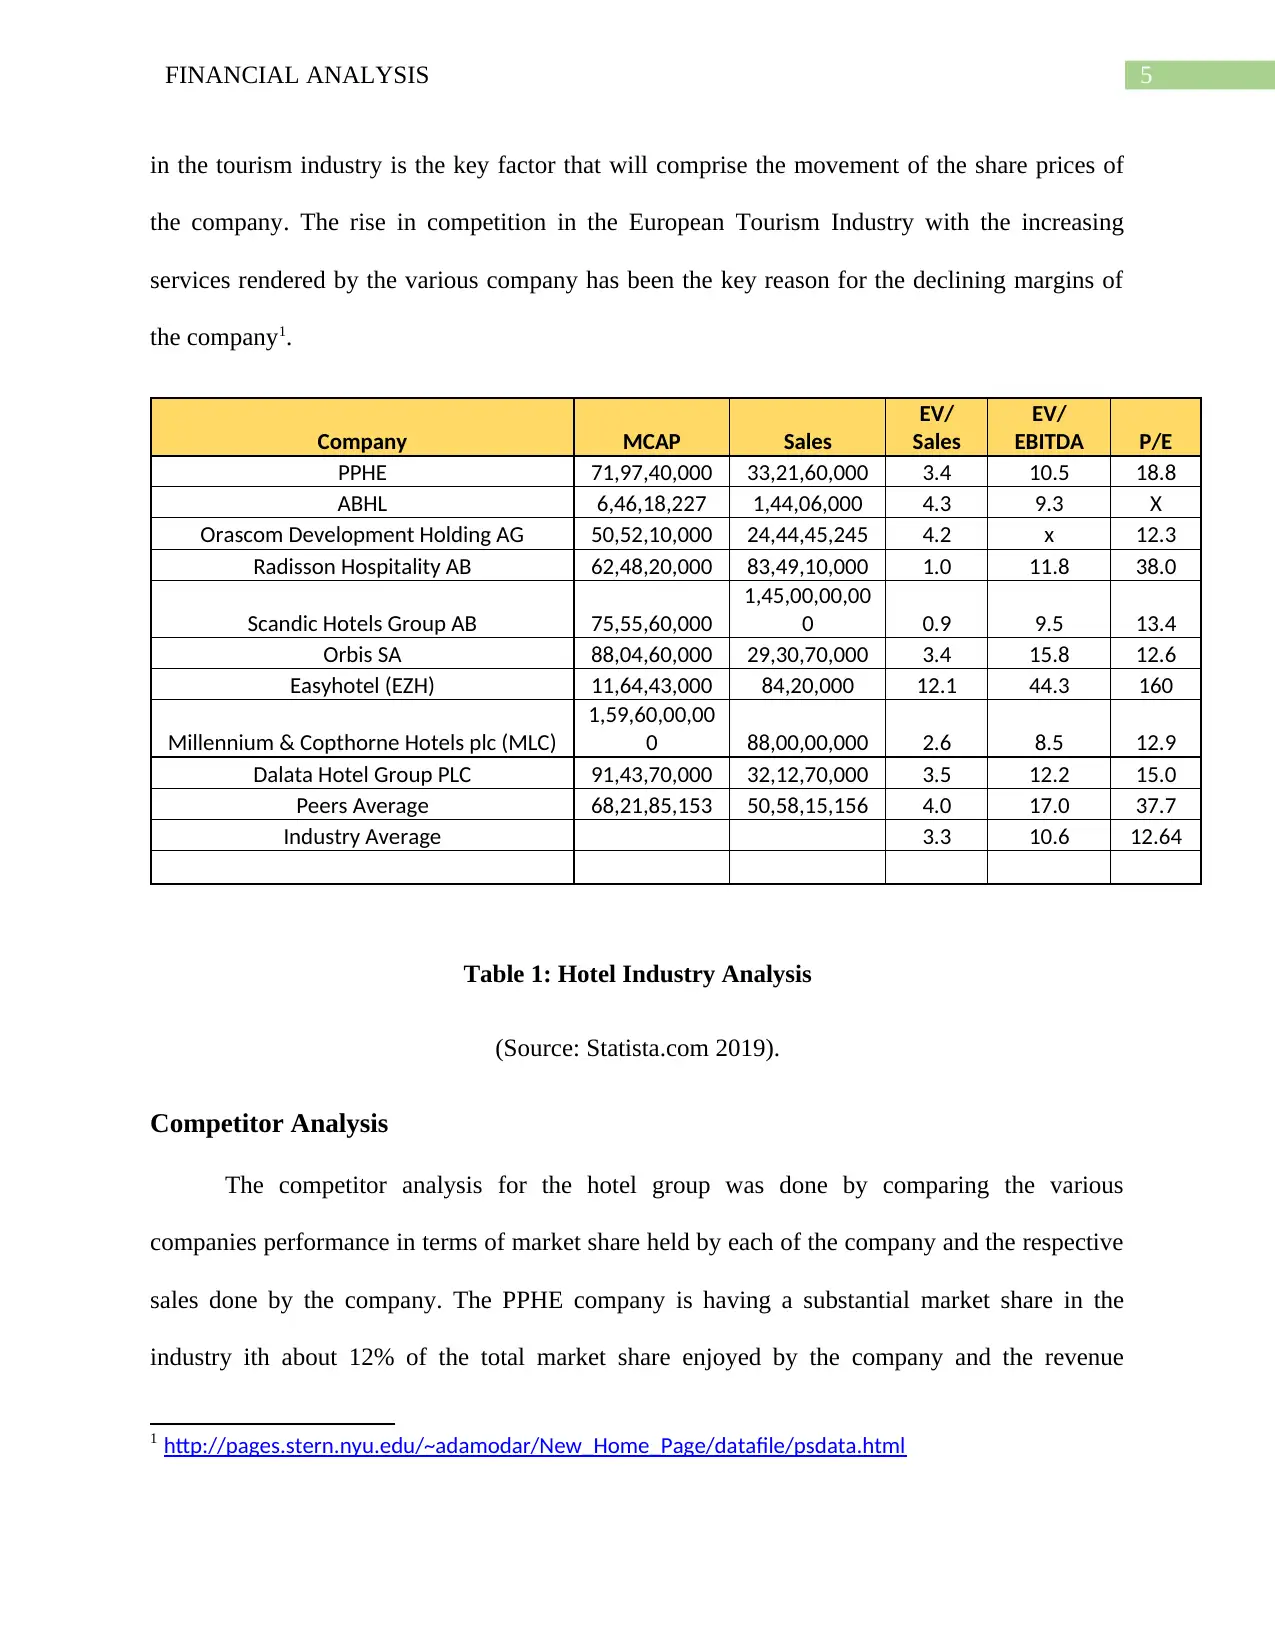
in the tourism industry is the key factor that will comprise the movement of the share prices of
the company. The rise in competition in the European Tourism Industry with the increasing
services rendered by the various company has been the key reason for the declining margins of
the company1.
Company MCAP Sales
EV/
Sales
EV/
EBITDA P/E
PPHE 71,97,40,000 33,21,60,000 3.4 10.5 18.8
ABHL 6,46,18,227 1,44,06,000 4.3 9.3 X
Orascom Development Holding AG 50,52,10,000 24,44,45,245 4.2 x 12.3
Radisson Hospitality AB 62,48,20,000 83,49,10,000 1.0 11.8 38.0
Scandic Hotels Group AB 75,55,60,000
1,45,00,00,00
0 0.9 9.5 13.4
Orbis SA 88,04,60,000 29,30,70,000 3.4 15.8 12.6
Easyhotel (EZH) 11,64,43,000 84,20,000 12.1 44.3 160
Millennium & Copthorne Hotels plc (MLC)
1,59,60,00,00
0 88,00,00,000 2.6 8.5 12.9
Dalata Hotel Group PLC 91,43,70,000 32,12,70,000 3.5 12.2 15.0
Peers Average 68,21,85,153 50,58,15,156 4.0 17.0 37.7
Industry Average 3.3 10.6 12.64
Table 1: Hotel Industry Analysis
(Source: Statista.com 2019).
Competitor Analysis
The competitor analysis for the hotel group was done by comparing the various
companies performance in terms of market share held by each of the company and the respective
sales done by the company. The PPHE company is having a substantial market share in the
industry ith about 12% of the total market share enjoyed by the company and the revenue
1 http://pages.stern.nyu.edu/~adamodar/New_Home_Page/datafile/psdata.html
⊘ This is a preview!⊘
Do you want full access?
Subscribe today to unlock all pages.
Trusted by 1+ million students worldwide
6FINANCIAL ANALYSIS
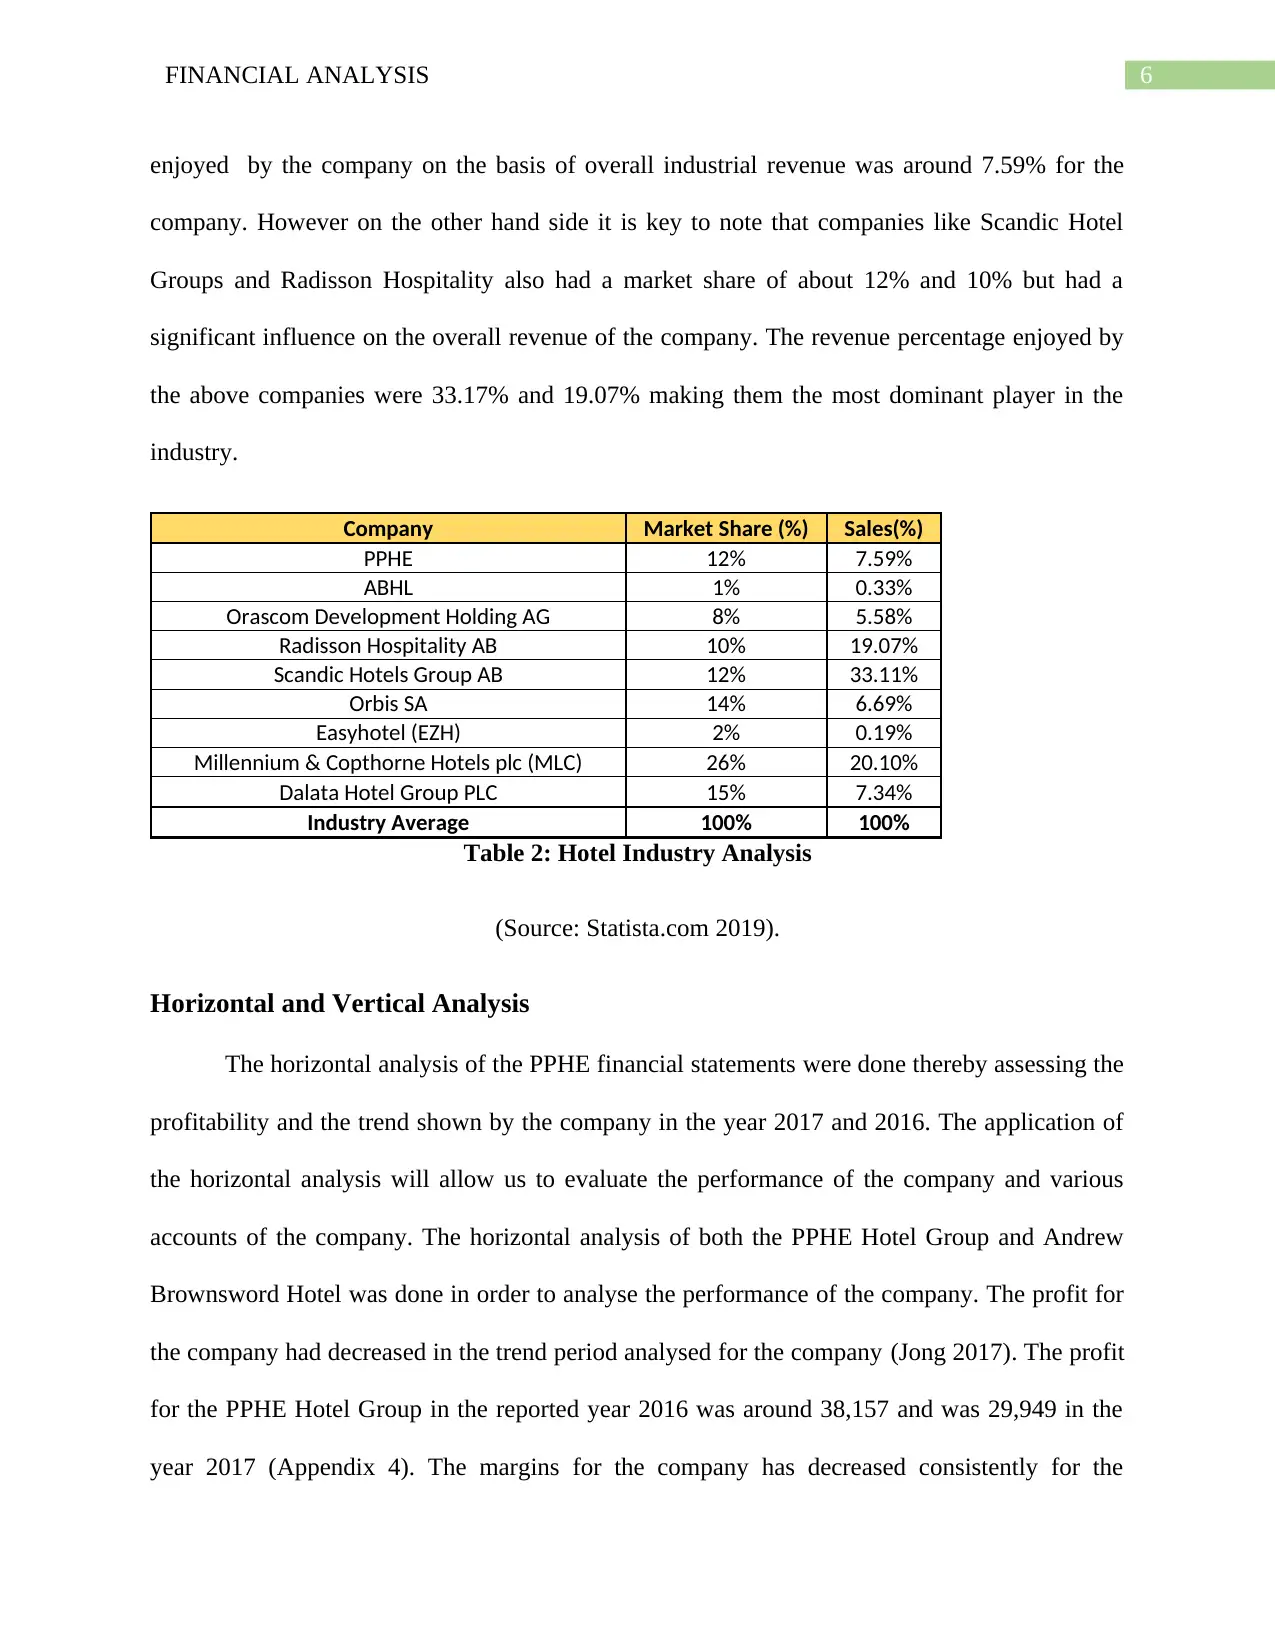
enjoyed by the company on the basis of overall industrial revenue was around 7.59% for the
company. However on the other hand side it is key to note that companies like Scandic Hotel
Groups and Radisson Hospitality also had a market share of about 12% and 10% but had a
significant influence on the overall revenue of the company. The revenue percentage enjoyed by
the above companies were 33.17% and 19.07% making them the most dominant player in the
industry.
Company Market Share (%) Sales(%)
PPHE 12% 7.59%
ABHL 1% 0.33%
Orascom Development Holding AG 8% 5.58%
Radisson Hospitality AB 10% 19.07%
Scandic Hotels Group AB 12% 33.11%
Orbis SA 14% 6.69%
Easyhotel (EZH) 2% 0.19%
Millennium & Copthorne Hotels plc (MLC) 26% 20.10%
Dalata Hotel Group PLC 15% 7.34%
Industry Average 100% 100%
Table 2: Hotel Industry Analysis
(Source: Statista.com 2019).
Horizontal and Vertical Analysis
The horizontal analysis of the PPHE financial statements were done thereby assessing the
profitability and the trend shown by the company in the year 2017 and 2016. The application of
the horizontal analysis will allow us to evaluate the performance of the company and various
accounts of the company. The horizontal analysis of both the PPHE Hotel Group and Andrew
Brownsword Hotel was done in order to analyse the performance of the company. The profit for
the company had decreased in the trend period analysed for the company (Jong 2017). The profit
for the PPHE Hotel Group in the reported year 2016 was around 38,157 and was 29,949 in the
year 2017 (Appendix 4). The margins for the company has decreased consistently for the
Paraphrase This Document
Need a fresh take? Get an instant paraphrase of this document with our AI Paraphraser
7FINANCIAL ANALYSIS
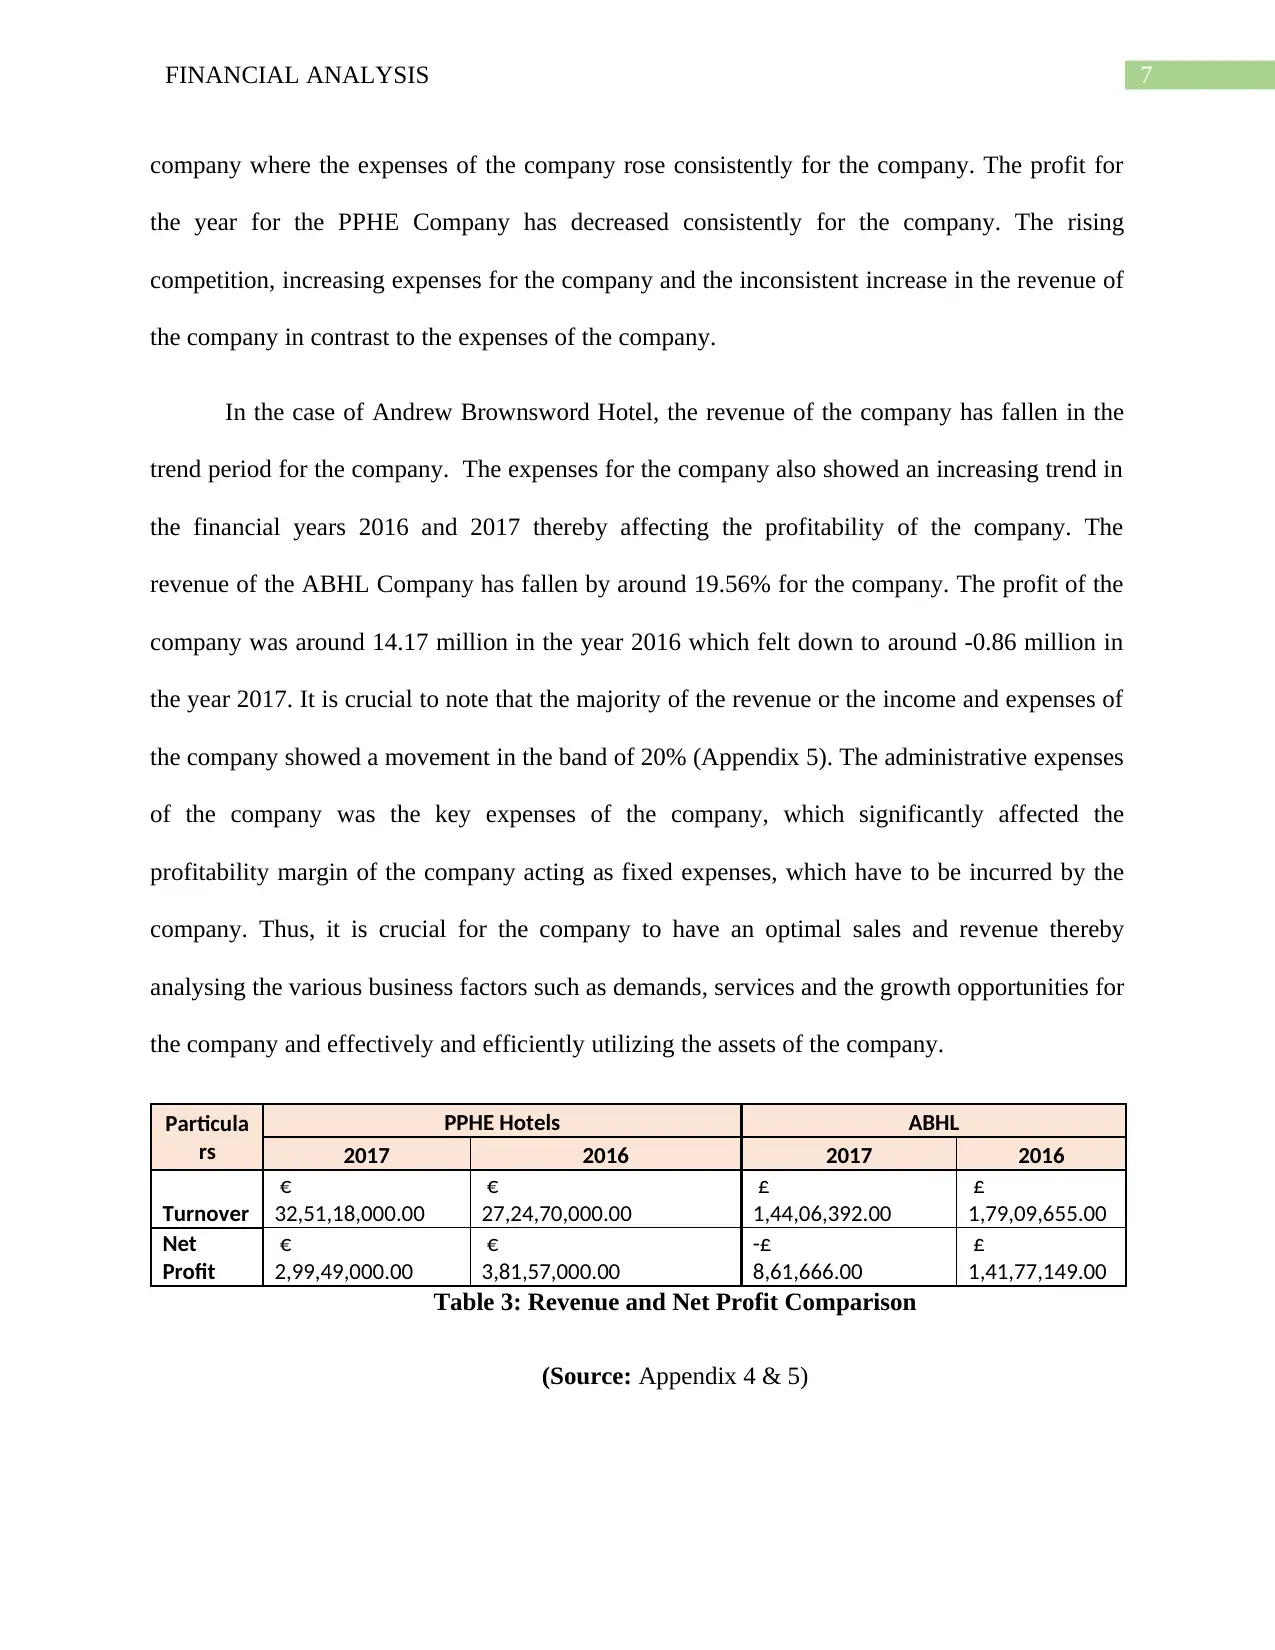
company where the expenses of the company rose consistently for the company. The profit for
the year for the PPHE Company has decreased consistently for the company. The rising
competition, increasing expenses for the company and the inconsistent increase in the revenue of
the company in contrast to the expenses of the company.
In the case of Andrew Brownsword Hotel, the revenue of the company has fallen in the
trend period for the company. The expenses for the company also showed an increasing trend in
the financial years 2016 and 2017 thereby affecting the profitability of the company. The
revenue of the ABHL Company has fallen by around 19.56% for the company. The profit of the
company was around 14.17 million in the year 2016 which felt down to around -0.86 million in
the year 2017. It is crucial to note that the majority of the revenue or the income and expenses of
the company showed a movement in the band of 20% (Appendix 5). The administrative expenses
of the company was the key expenses of the company, which significantly affected the
profitability margin of the company acting as fixed expenses, which have to be incurred by the
company. Thus, it is crucial for the company to have an optimal sales and revenue thereby
analysing the various business factors such as demands, services and the growth opportunities for
the company and effectively and efficiently utilizing the assets of the company.
Particula
rs
PPHE Hotels ABHL
2017 2016 2017 2016
Turnover
€
32,51,18,000.00
€
27,24,70,000.00
£
1,44,06,392.00
£
1,79,09,655.00
Net
Profit
€
2,99,49,000.00
€
3,81,57,000.00
-£
8,61,666.00
£
1,41,77,149.00
Table 3: Revenue and Net Profit Comparison
(Source: Appendix 4 & 5)

8FINANCIAL ANALYSIS
⊘ This is a preview!⊘
Do you want full access?
Subscribe today to unlock all pages.
Trusted by 1+ million students worldwide
9FINANCIAL ANALYSIS
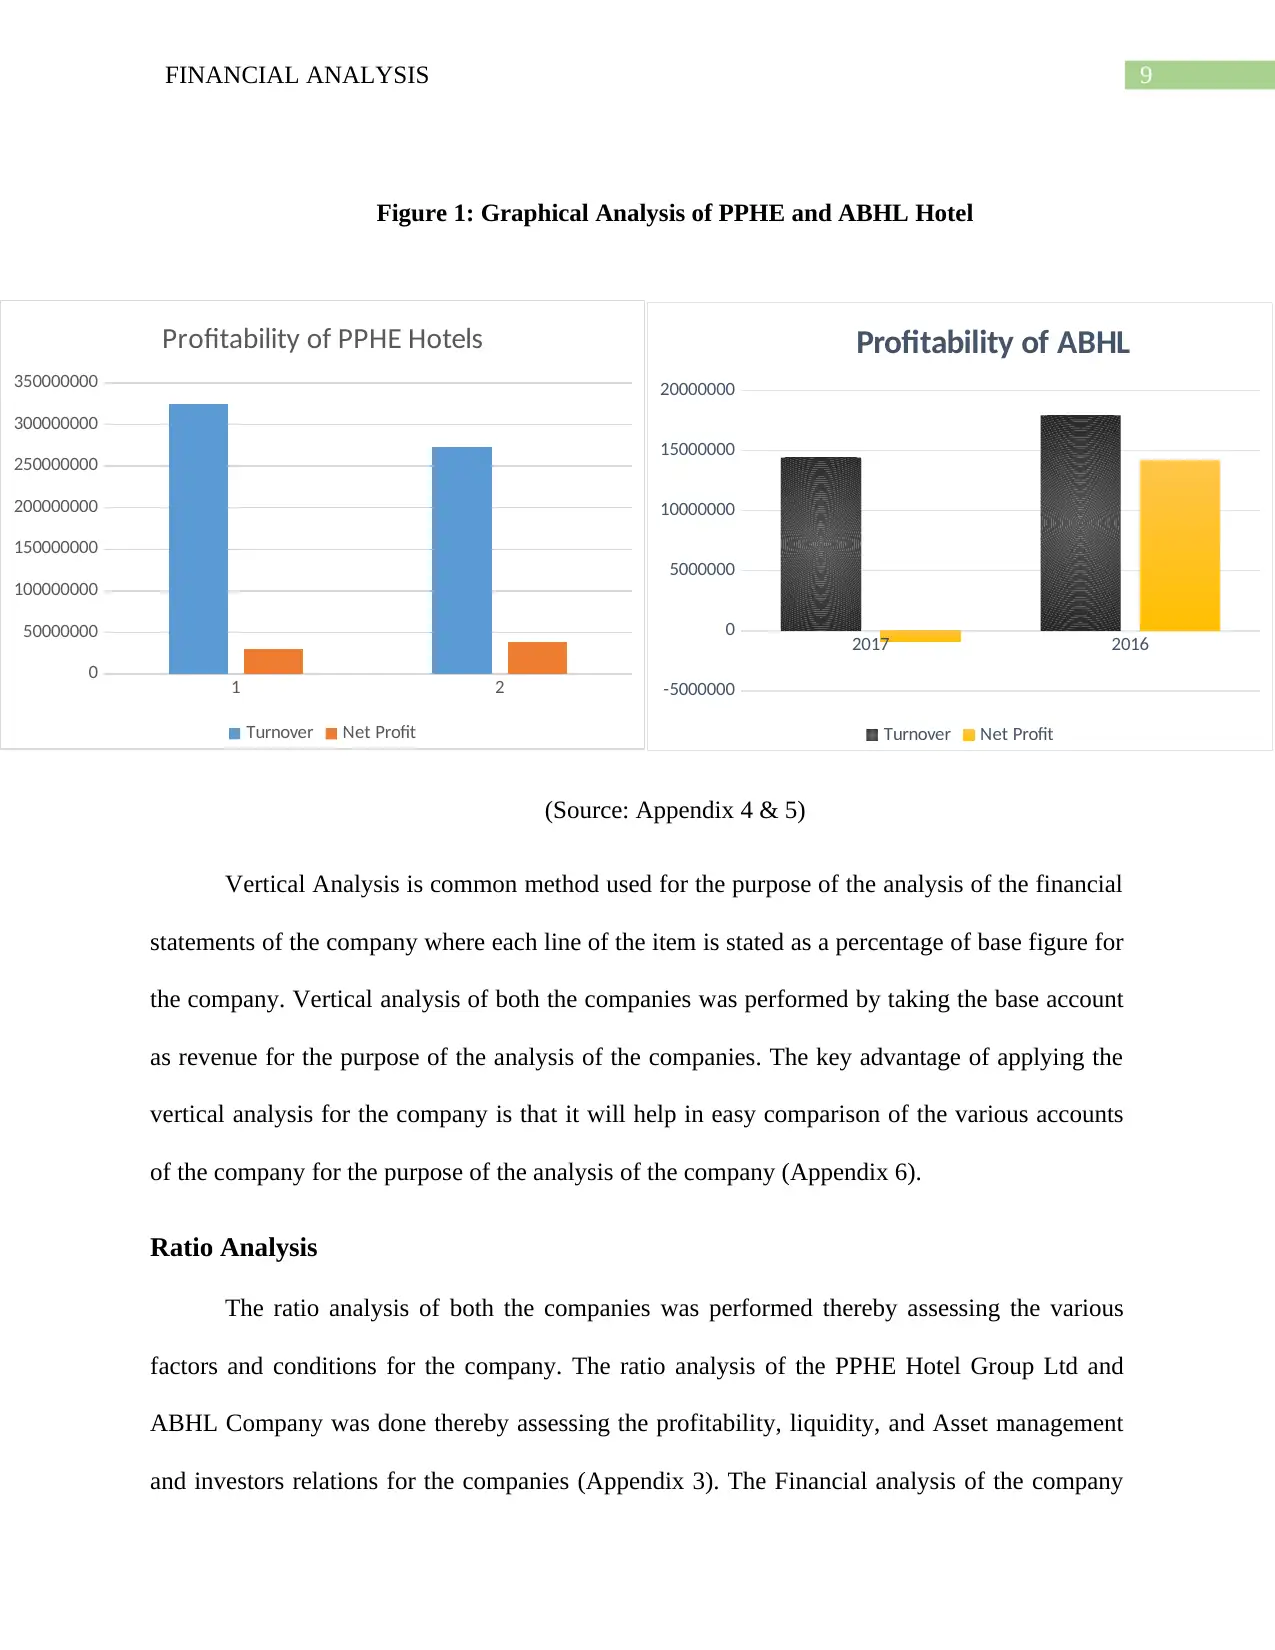
Figure 1: Graphical Analysis of PPHE and ABHL Hotel
(Source: Appendix 4 & 5)
Vertical Analysis is common method used for the purpose of the analysis of the financial
statements of the company where each line of the item is stated as a percentage of base figure for
the company. Vertical analysis of both the companies was performed by taking the base account
as revenue for the purpose of the analysis of the companies. The key advantage of applying the
vertical analysis for the company is that it will help in easy comparison of the various accounts
of the company for the purpose of the analysis of the company (Appendix 6).
Ratio Analysis
The ratio analysis of both the companies was performed thereby assessing the various
factors and conditions for the company. The ratio analysis of the PPHE Hotel Group Ltd and
ABHL Company was done thereby assessing the profitability, liquidity, and Asset management
and investors relations for the companies (Appendix 3). The Financial analysis of the company
1 2
0
50000000
100000000
150000000
200000000
250000000
300000000
350000000
Profitability of PPHE Hotels
Turnover Net Profit
2017 2016
-5000000
0
5000000
10000000
15000000
20000000
Profitability of ABHL
Turnover Net Profit
Paraphrase This Document
Need a fresh take? Get an instant paraphrase of this document with our AI Paraphraser
10FINANCIAL ANALYSIS
can be better conducted with the help of the ratio analysis where the key accounts of the
company will be taken into consideration for analysing the financial performance and the
financial positions of the companies (Ey.com 2019).
Profitability Ratios: The profitability of the company of the PPHE Hotel Group was done
thereby assessing the performance of the company in the trend period 2015-17. The gross profit
of the PPHE Company was around 40.47% in the year 2015, which saw a sharp decline in the
year 2016 and 2017 falling to about 37.79% and 35.69% for the company. The net profit of the
company has fallen down from 13.37% to 9.21% in the year 2015-17. The operating profit of the
company has also fallen down from 27.93% in the year 2015 to 22.46% (Appendix 8). The
revenue for the company has increased for the company in the financial trend period but the rise
in expenses for the company has been much larger than the rise in expenses for the company. On
the other hand, the gross profit margin of the ABHL Company was around 48.71% in the year
2015, which increased to around 50.33% in the year 2017. However, the net profit and operating
profit margin for the company has fallen for the company in the trend period analysed for the
company. The fall in the profitability could be well attributed to the falling revenue of the
company (Appendix 9).
Efficiency Ratios: The efficiency ratio shows the efficiency shown by the management of the
companies for the management of the various assets and resources of the company. The total
asset turnover ratio and inventory turnover ratio for the PPHE Company in the trend period
declined slightly indicating that the management of the company may not be utilizing the assets
of the company to their full extent (Appendix 8). The debtor turnover ratio for the PPHE
Company on the other side showed a consistent increase reflecting better collection of
outstanding amount by the companies. On the other hand, side the activity ratio for the ABHL
11FINANCIAL ANALYSIS
Company declined sharply for the company but the inventory turnover ratio for the company
showed a consistent improvement for the ABHL Company (Appendix 9).
Liquidity Ratio: The liquidity condition for both the company was assessed to be improving for
the both the companies (Appendix 9). The improving liquidity ratio for the companies shows that
the companies are maintaining sufficient current asset in contrast to the current obligations of the
company (Appendix 8).
Cost of Capital
PPHE Ltd Cost of Capital
The cost of capital for the PPHE Company was derived using the CAPM equation where
CAPM: Risk Free Rate of Return+ Beta*(Return on Market-Risk Free Rate of Return). The risk
free rate of return taken for the analysis was around 1.17% for the company. The expected return
on market for the company was taken at 5.55%. The country risk premium of 1.2% for the
investment in the UK region was also considered while evaluating the cost of capital for the
company (FT 2016). The beta of the company was around 0.52 times for the company indicating
a less volatile stock with respect to the benchmark index. The cost of equity for the company was
evaluated to be around 6.0% (Appendix 1).
The weighted average cost of capital for the company was evaluated after taking the
value of debt and the value of equity for the company and the respective cost associated for the
company. The taxation rate was also evaluated for both the companies, which was applied for
determining the weighted average cost of capital for the company. The weighted average cost of
capital for the PPHE Company in accordance with the Dividend Growth model was also taken
into consideration for the company where the growth rate of the revenue was taken into
⊘ This is a preview!⊘
Do you want full access?
Subscribe today to unlock all pages.
Trusted by 1+ million students worldwide
1 out of 37
Related Documents


Your All-in-One AI-Powered Toolkit for Academic Success.
+13062052269
info@desklib.com
Available 24*7 on WhatsApp / Email
![[object Object]](/_next/static/media/star-bottom.7253800d.svg)
Unlock your academic potential
Copyright © 2020–2026 A2Z Services. All Rights Reserved. Developed and managed by ZUCOL.