Project Analysis and Financial Valuation Report: Finance Module
VerifiedAdded on  2022/09/02
|13
|1633
|18
Report
AI Summary
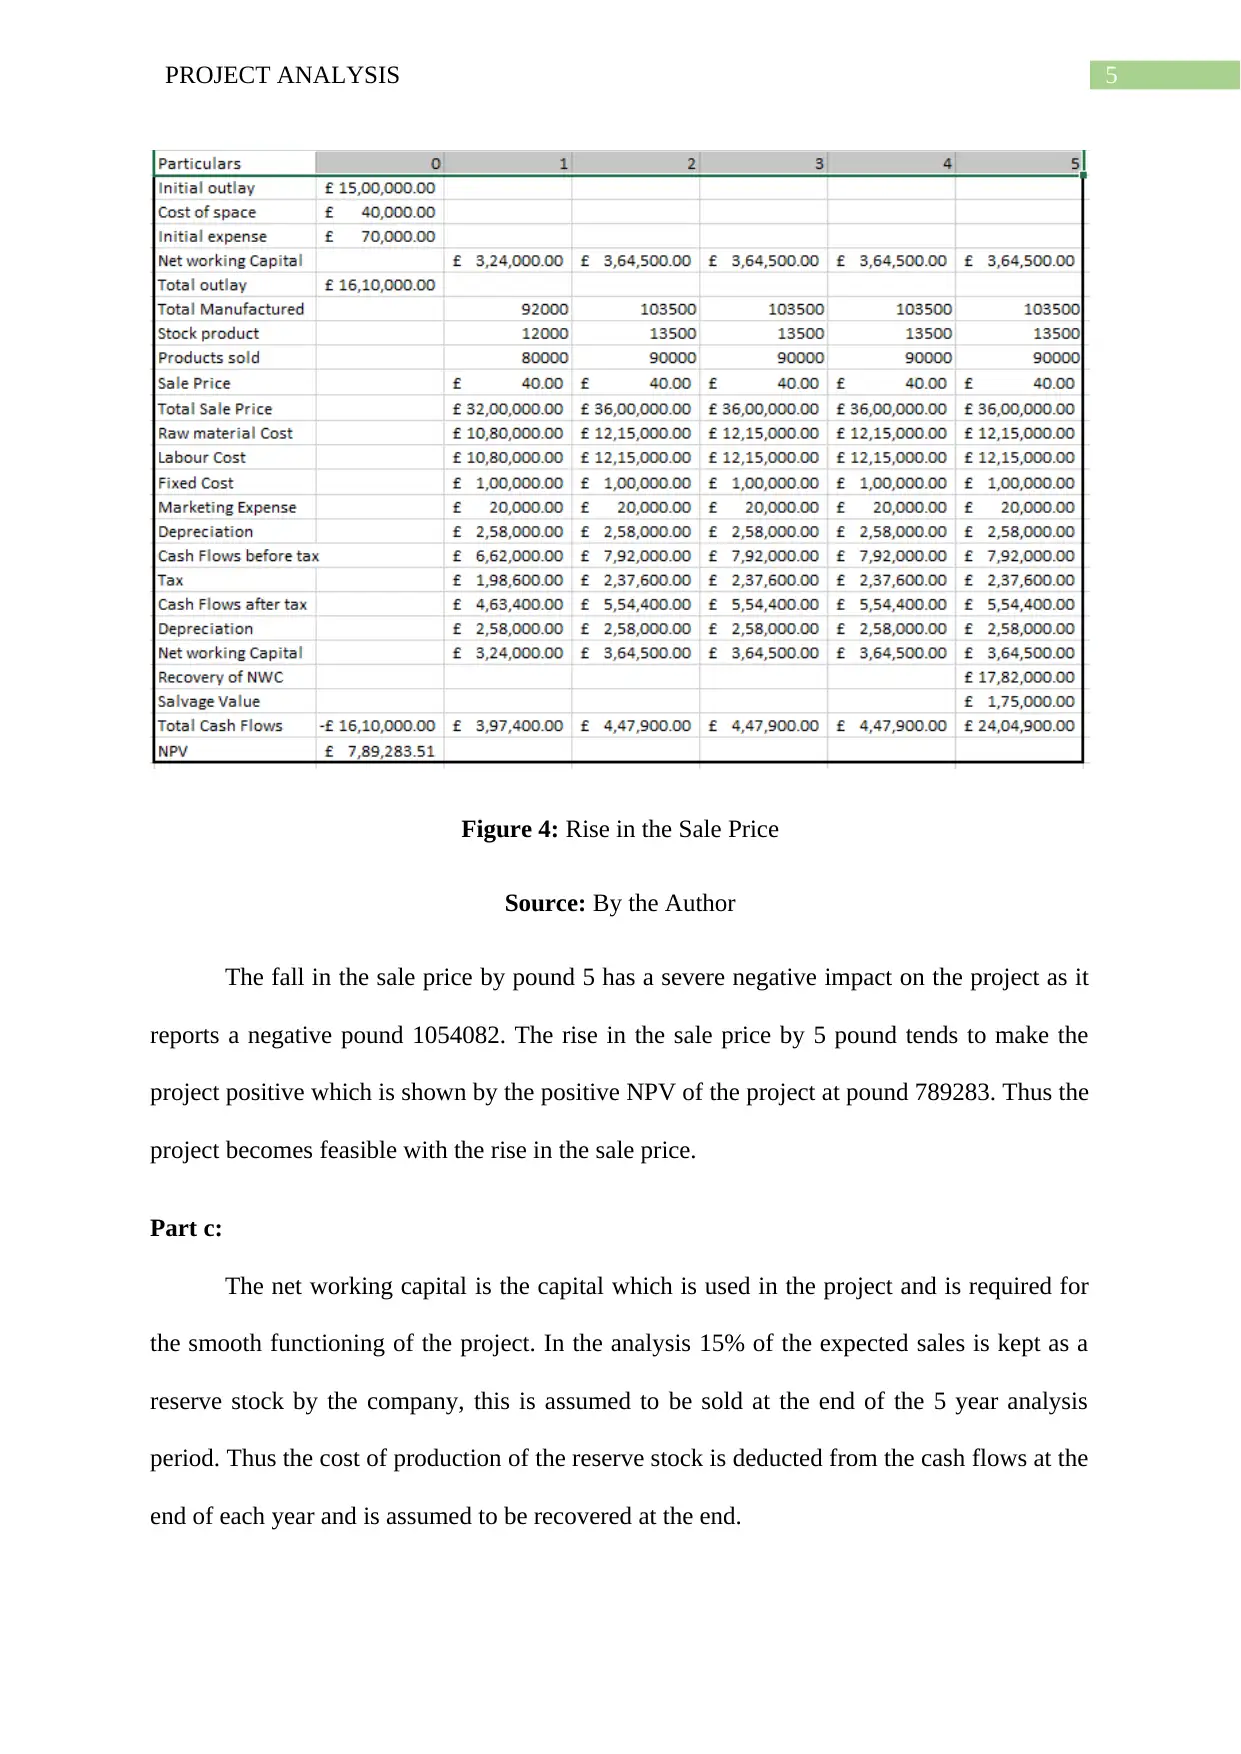
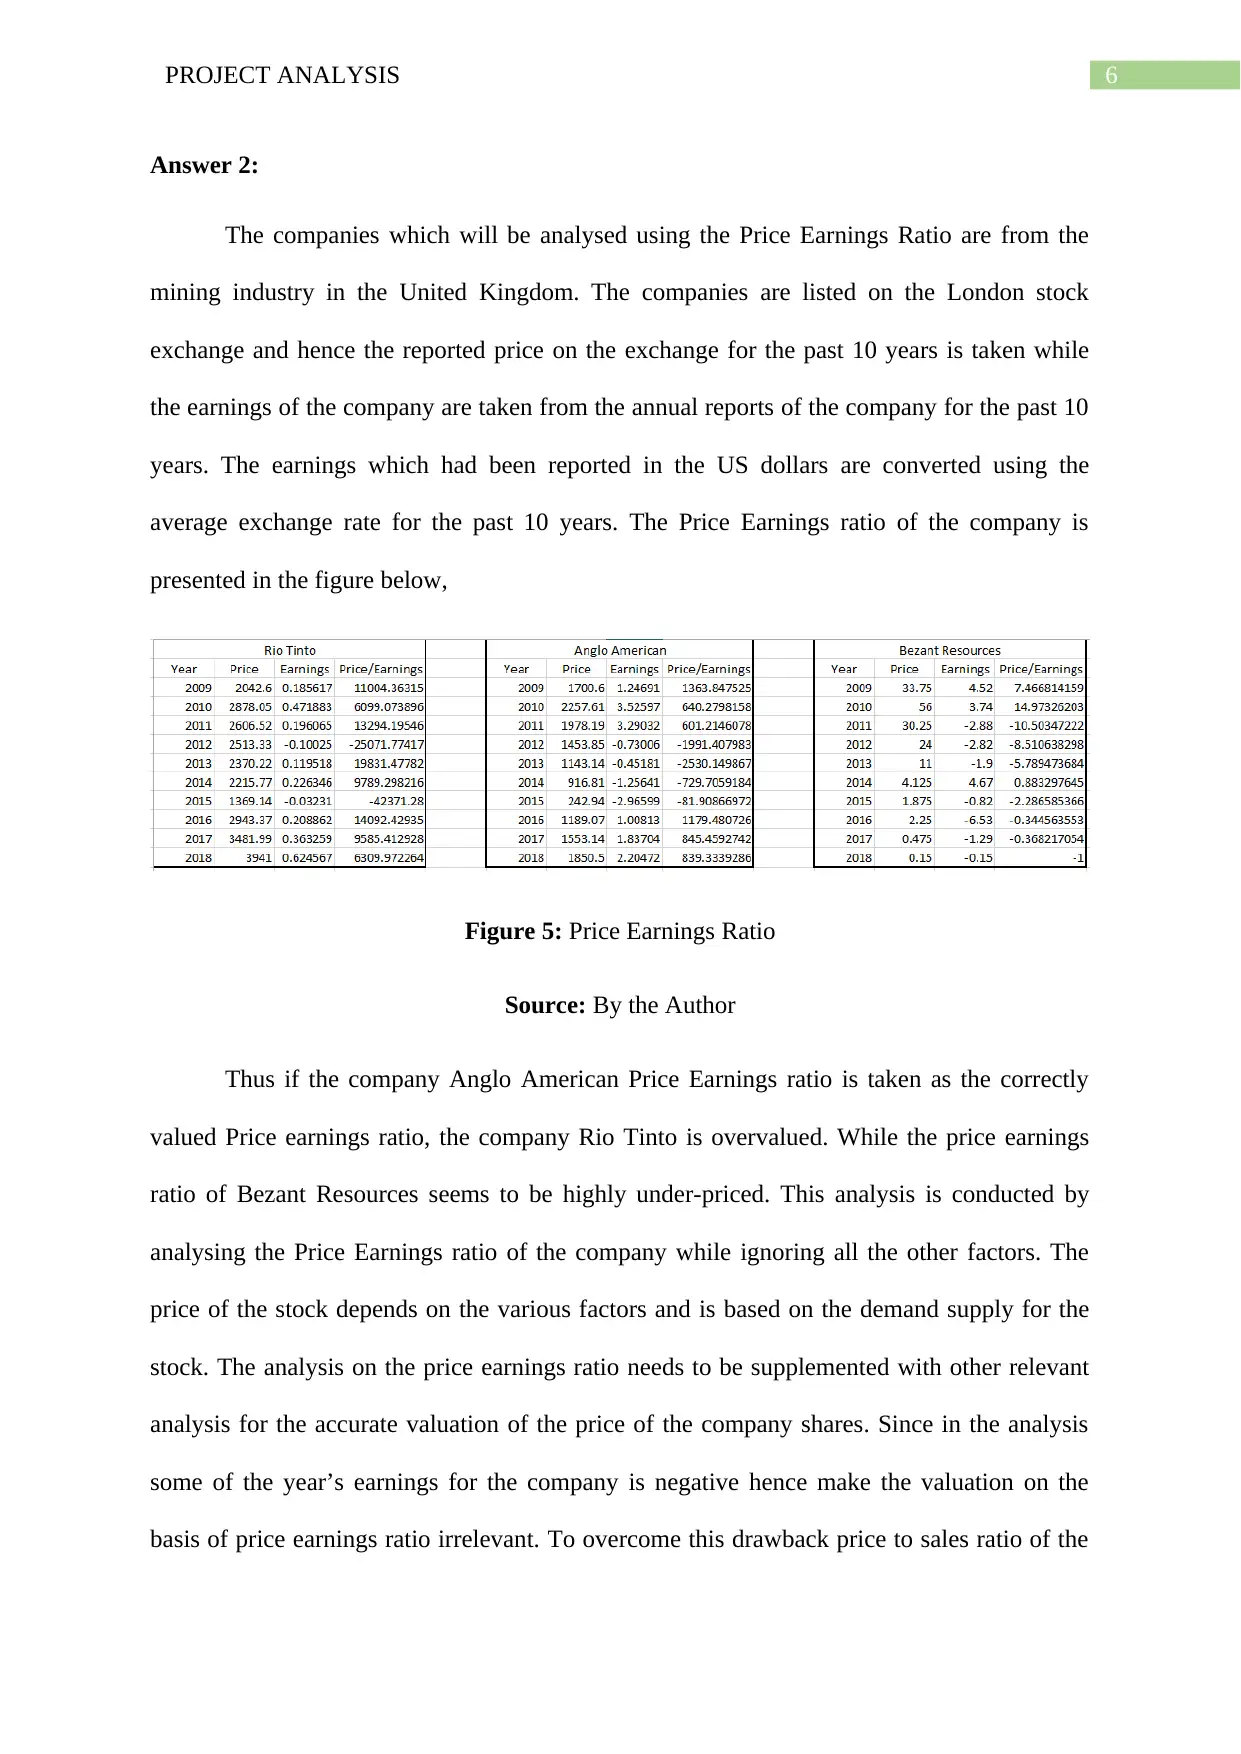
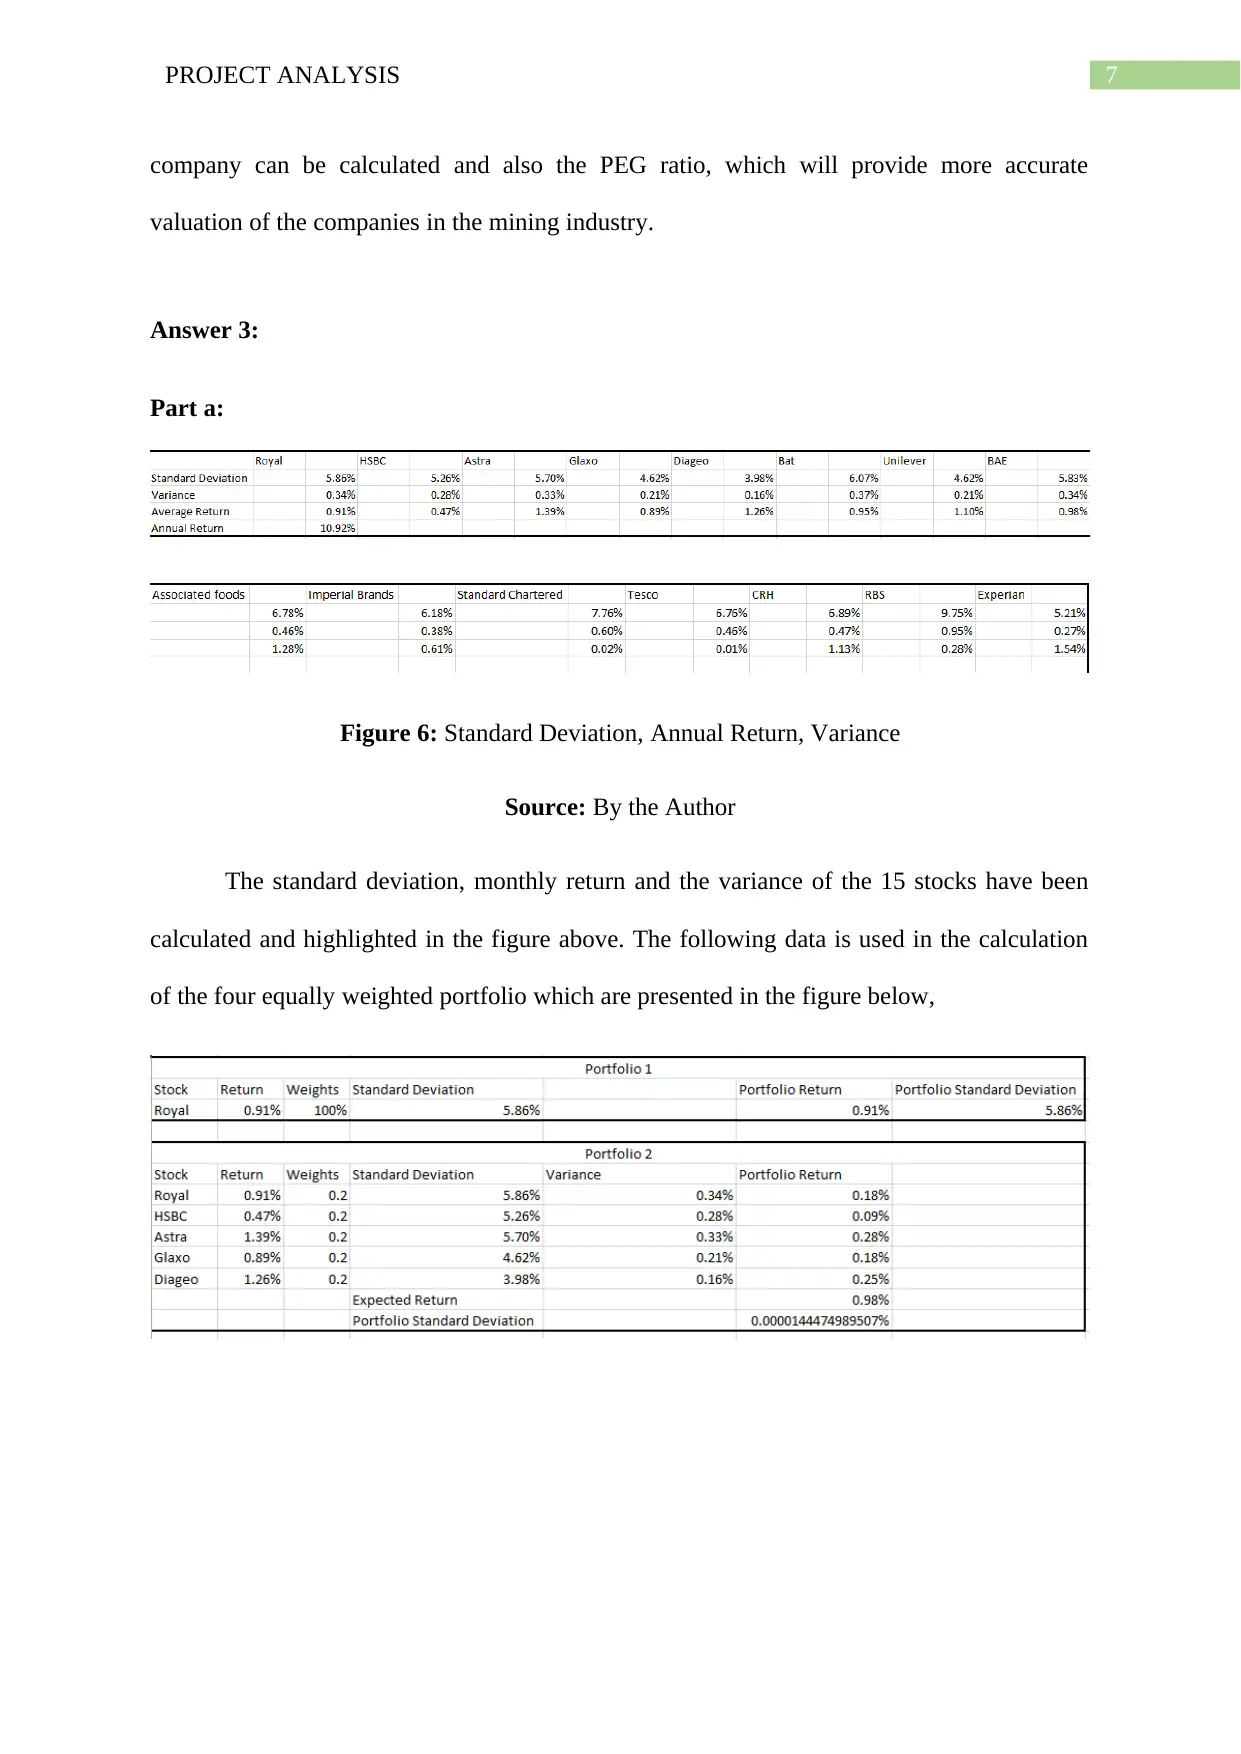
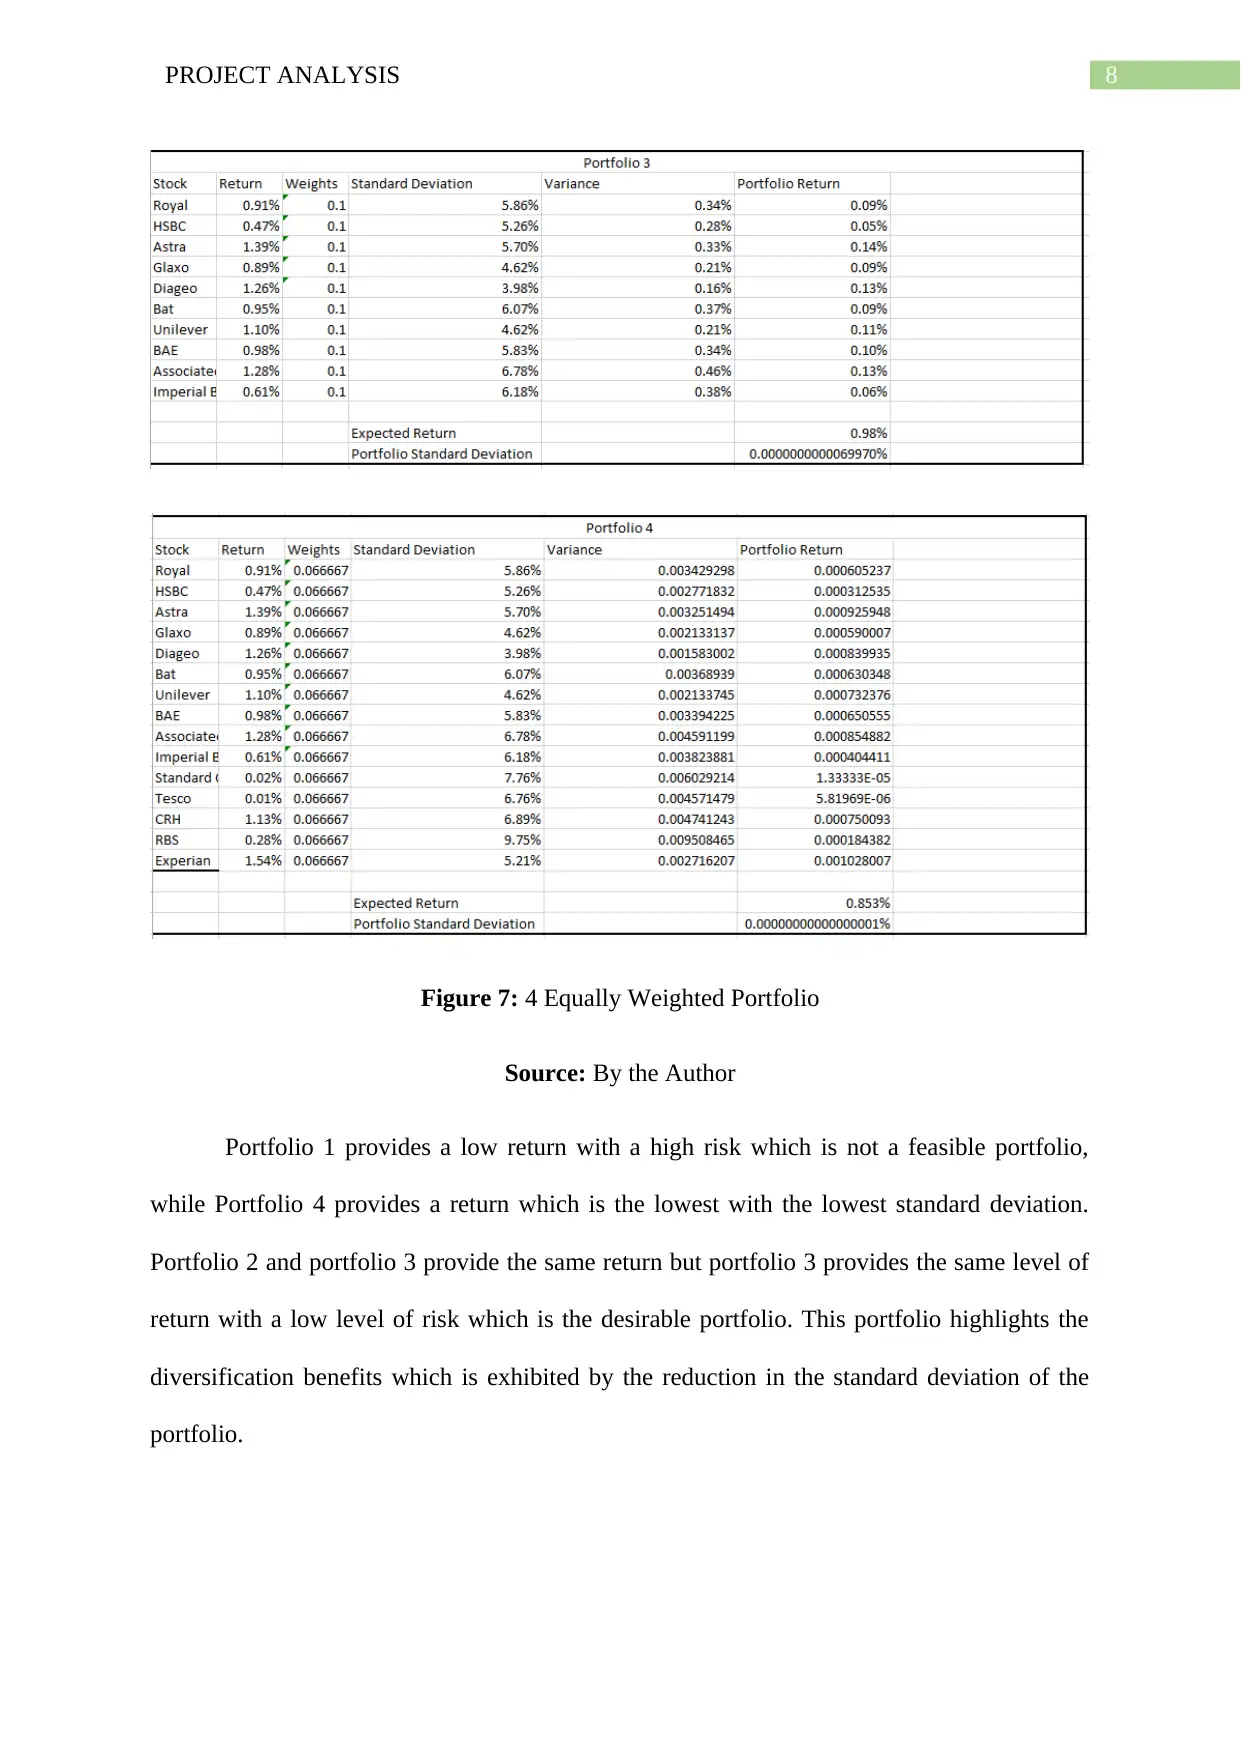
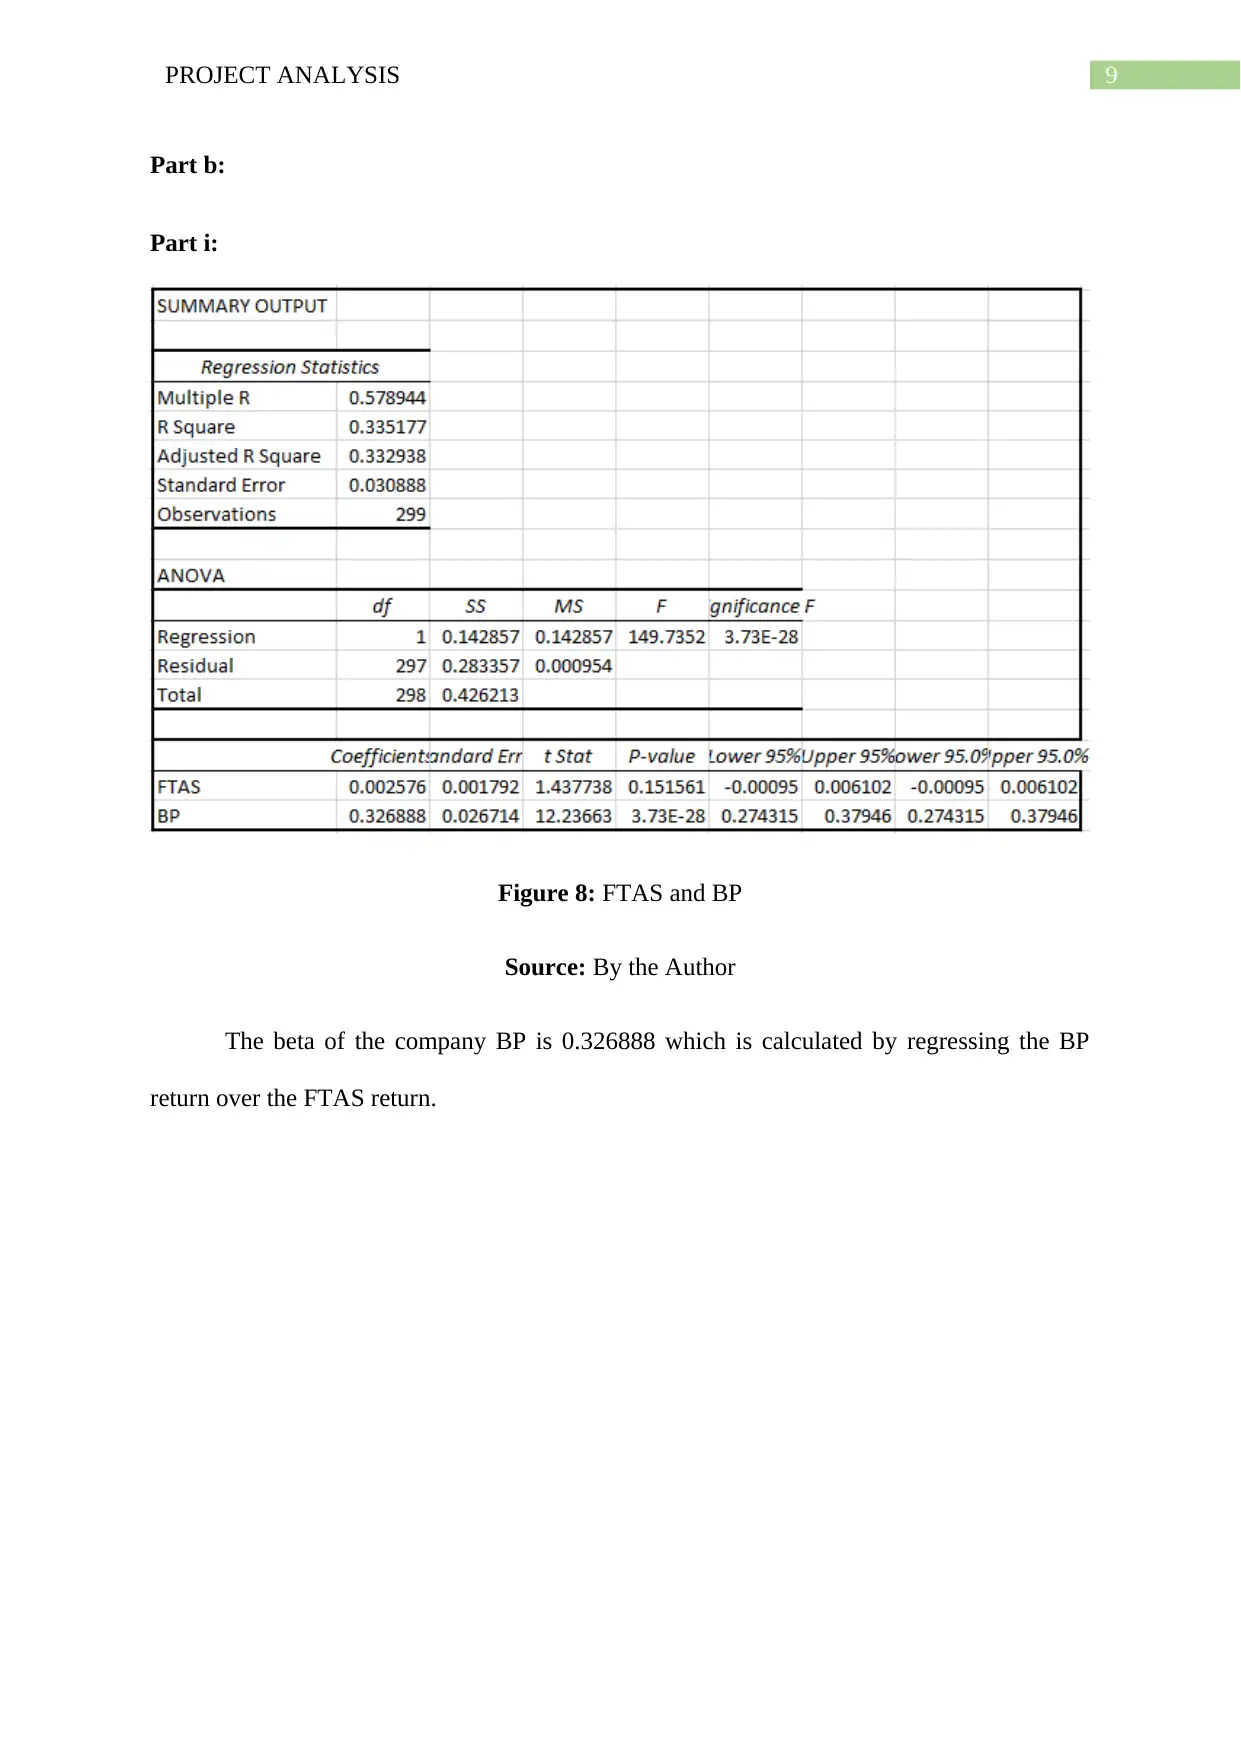
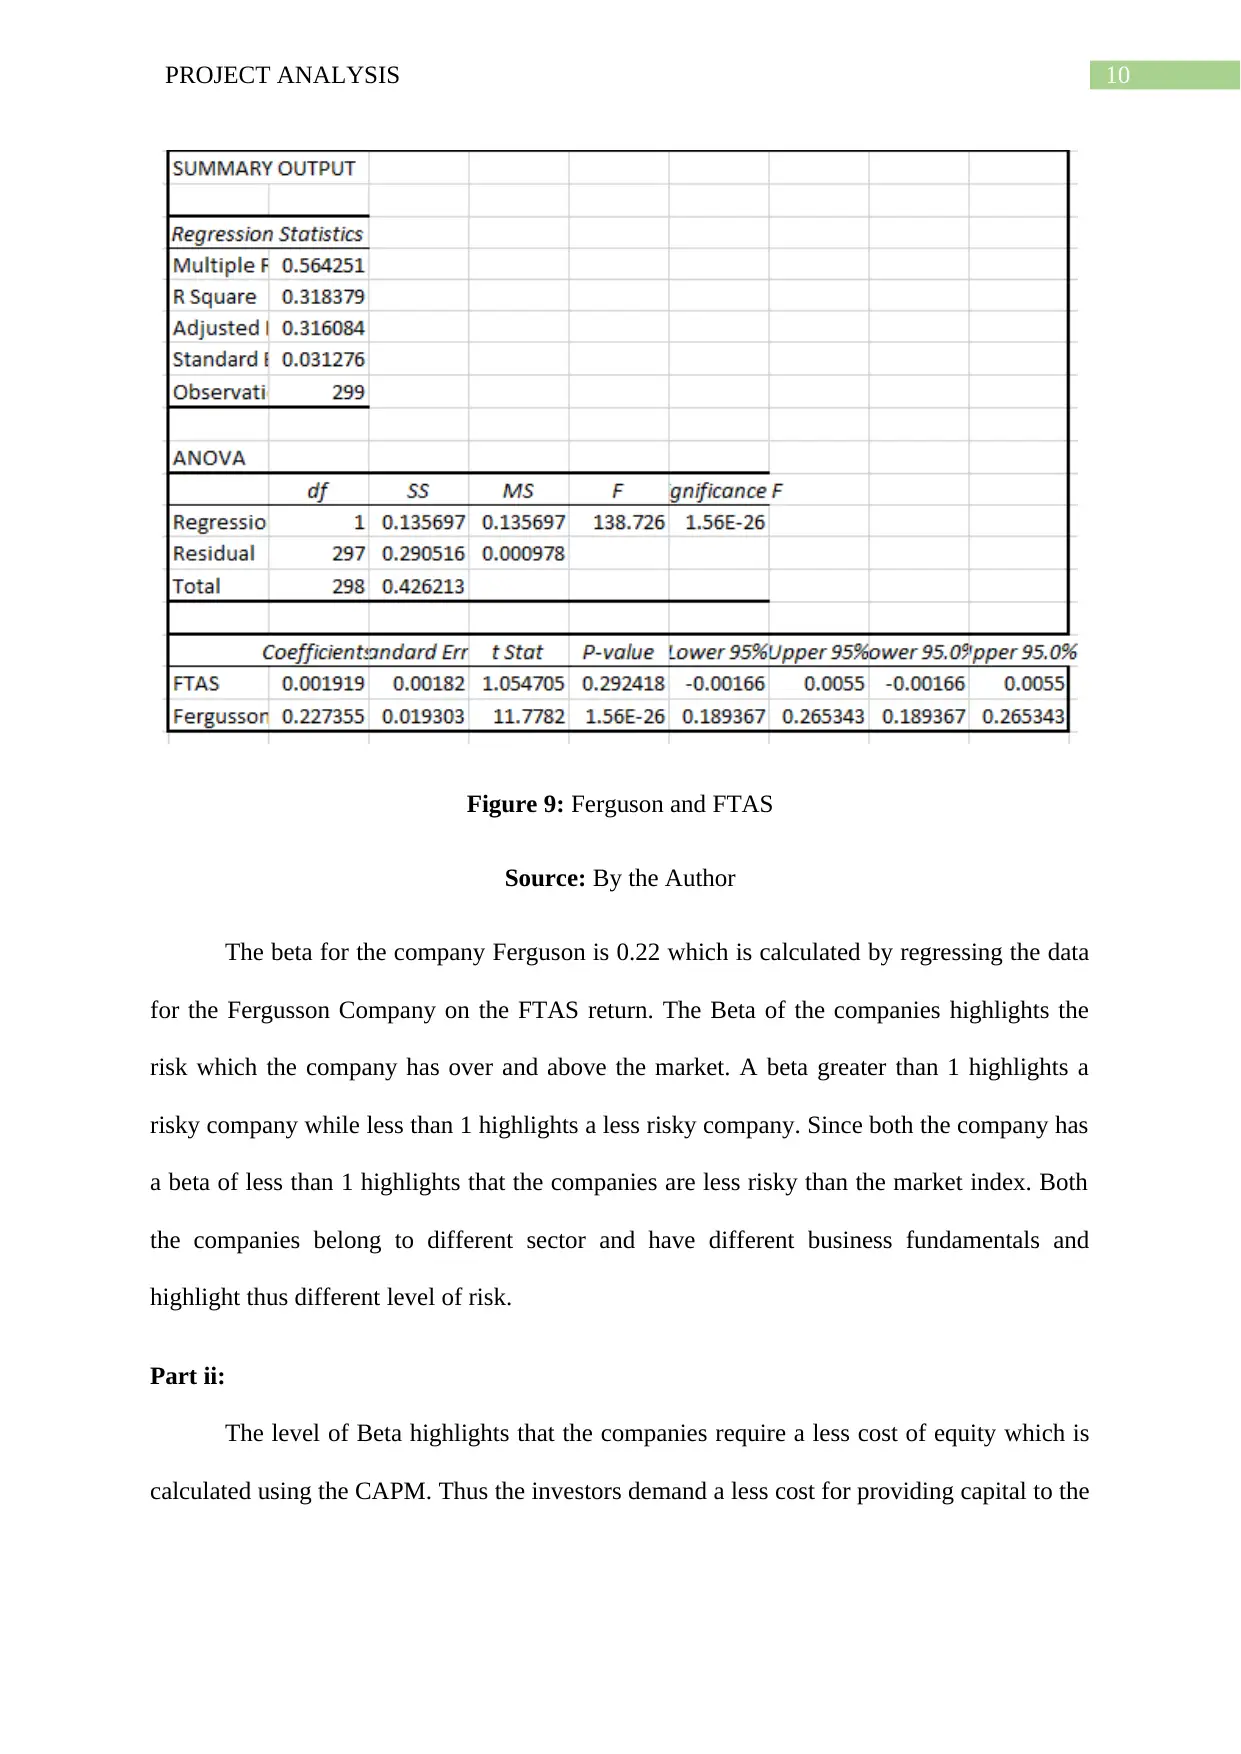
This report presents a comprehensive project analysis, encompassing financial valuation, sensitivity analysis, and portfolio management. The analysis begins with the calculation of Net Present Value (NPV) for a project, considering various data inputs and assumptions. A sensitivity analysis is performed to assess the impact of changes in sale price on the project's NPV. The report then explores the use of Price-Earnings (P/E) ratios for valuation of companies in the mining industry, acknowledging the limitations and suggesting alternative metrics like price-to-sales and PEG ratios. Finally, the report delves into portfolio analysis, calculating standard deviation, returns, and variance for various portfolios. Beta calculations are performed for two companies, and the implications of beta on cost of equity are discussed. The report concludes with a bibliography of relevant sources.
Contribute Materials
Your contribution can guide someone’s learning journey. Share your
documents today.

Running head: PROJECT ANALYSIS
Project Analysis
Name of the Student:
Name of the University:
Author Note:
Project Analysis
Name of the Student:
Name of the University:
Author Note:
Secure Best Marks with AI Grader
Need help grading? Try our AI Grader for instant feedback on your assignments.

1PROJECT ANALYSIS
Table of Contents
Answer 1:...................................................................................................................................2
Part a:.....................................................................................................................................2
Part b:.....................................................................................................................................4
Part c:.....................................................................................................................................5
Answer 2:...................................................................................................................................6
Answer 3:...................................................................................................................................7
Part a:.....................................................................................................................................7
Part b:.....................................................................................................................................9
Part i:..................................................................................................................................9
Part ii:...............................................................................................................................10
Bibliographies:.........................................................................................................................12

2PROJECT ANALYSIS
Answer 1:
Part a:
The net present value of the project requires the following data inputs which would be
required in the calculation of the feasibility of the project which is highlighted in the figure
below,
Figure 1: Data Inputs
Source: By the Author
The following data inputs are used in the calculation of the net present value of the
project. Hence the cash flows which is generated from the project and the resultant net
present value of the project is calculated in the figure below,

3PROJECT ANALYSIS
Figure 2: Net Present Value
Source: By the Author
Thus the assumption in the calculation of the net present value is the accumulation of
the stocks which is 15% greater than the expected sales. The manufacturing cost of the stock
held is taken as net working capital and is reduced from the Net cash flows. Also the Net
Working Capital is assumed to be collected at the end of the analysis period.
The cost of the space which is used by the machinery is taken as a part of the initial
outlay and is used in the calculation of the net present value. The sunk cost is ignored in the
calculations while the 8% overhead to recover R&D expense and the head office expense is
ignored as they form a part of the sunk cost.
Thus the net present value which is calculated from the project is Pound 132399
which is negative. Hence highlighting that the Project is generating negative NPV at the
current level of sale price.
Secure Best Marks with AI Grader
Need help grading? Try our AI Grader for instant feedback on your assignments.

4PROJECT ANALYSIS
Part b:
Sensitivity Analysis of the project is the impact on the project which is analysed by a
change in one of the variables of the project. It highlights the change in the project with a
change in one of the variables of the project in either an adverse direction or favourable
direction. Thus for the sensitivity analysis of the project all the variables are kept constant
while the sale price is reduced and increased by 5 pounds. The impact on the projects NPV is
highlighted in the figure below by the change in the sale price.
Figure 3: Fall in the Sale Price
Source: By the Author

5PROJECT ANALYSIS
Figure 4: Rise in the Sale Price
Source: By the Author
The fall in the sale price by pound 5 has a severe negative impact on the project as it
reports a negative pound 1054082. The rise in the sale price by 5 pound tends to make the
project positive which is shown by the positive NPV of the project at pound 789283. Thus the
project becomes feasible with the rise in the sale price.
Part c:
The net working capital is the capital which is used in the project and is required for
the smooth functioning of the project. In the analysis 15% of the expected sales is kept as a
reserve stock by the company, this is assumed to be sold at the end of the 5 year analysis
period. Thus the cost of production of the reserve stock is deducted from the cash flows at the
end of each year and is assumed to be recovered at the end.

6PROJECT ANALYSIS
Answer 2:
The companies which will be analysed using the Price Earnings Ratio are from the
mining industry in the United Kingdom. The companies are listed on the London stock
exchange and hence the reported price on the exchange for the past 10 years is taken while
the earnings of the company are taken from the annual reports of the company for the past 10
years. The earnings which had been reported in the US dollars are converted using the
average exchange rate for the past 10 years. The Price Earnings ratio of the company is
presented in the figure below,
Figure 5: Price Earnings Ratio
Source: By the Author
Thus if the company Anglo American Price Earnings ratio is taken as the correctly
valued Price earnings ratio, the company Rio Tinto is overvalued. While the price earnings
ratio of Bezant Resources seems to be highly under-priced. This analysis is conducted by
analysing the Price Earnings ratio of the company while ignoring all the other factors. The
price of the stock depends on the various factors and is based on the demand supply for the
stock. The analysis on the price earnings ratio needs to be supplemented with other relevant
analysis for the accurate valuation of the price of the company shares. Since in the analysis
some of the year’s earnings for the company is negative hence make the valuation on the
basis of price earnings ratio irrelevant. To overcome this drawback price to sales ratio of the
Paraphrase This Document
Need a fresh take? Get an instant paraphrase of this document with our AI Paraphraser

7PROJECT ANALYSIS
company can be calculated and also the PEG ratio, which will provide more accurate
valuation of the companies in the mining industry.
Answer 3:
Part a:
Figure 6: Standard Deviation, Annual Return, Variance
Source: By the Author
The standard deviation, monthly return and the variance of the 15 stocks have been
calculated and highlighted in the figure above. The following data is used in the calculation
of the four equally weighted portfolio which are presented in the figure below,

8PROJECT ANALYSIS
Figure 7: 4 Equally Weighted Portfolio
Source: By the Author
Portfolio 1 provides a low return with a high risk which is not a feasible portfolio,
while Portfolio 4 provides a return which is the lowest with the lowest standard deviation.
Portfolio 2 and portfolio 3 provide the same return but portfolio 3 provides the same level of
return with a low level of risk which is the desirable portfolio. This portfolio highlights the
diversification benefits which is exhibited by the reduction in the standard deviation of the
portfolio.

9PROJECT ANALYSIS
Part b:
Part i:
Figure 8: FTAS and BP
Source: By the Author
The beta of the company BP is 0.326888 which is calculated by regressing the BP
return over the FTAS return.
Part b:
Part i:
Figure 8: FTAS and BP
Source: By the Author
The beta of the company BP is 0.326888 which is calculated by regressing the BP
return over the FTAS return.
Secure Best Marks with AI Grader
Need help grading? Try our AI Grader for instant feedback on your assignments.

10PROJECT ANALYSIS
Figure 9: Ferguson and FTAS
Source: By the Author
The beta for the company Ferguson is 0.22 which is calculated by regressing the data
for the Fergusson Company on the FTAS return. The Beta of the companies highlights the
risk which the company has over and above the market. A beta greater than 1 highlights a
risky company while less than 1 highlights a less risky company. Since both the company has
a beta of less than 1 highlights that the companies are less risky than the market index. Both
the companies belong to different sector and have different business fundamentals and
highlight thus different level of risk.
Part ii:
The level of Beta highlights that the companies require a less cost of equity which is
calculated using the CAPM. Thus the investors demand a less cost for providing capital to the

11PROJECT ANALYSIS
company. Thus the cost of capital of the company is reduced as the company is perceived as a
less risky due to the low level of Beta.
company. Thus the cost of capital of the company is reduced as the company is perceived as a
less risky due to the low level of Beta.

12PROJECT ANALYSIS
Bibliographies:
Agarwal, S., Ben-David, I. and Yao, V., 2017. Systematic mistakes in the mortgage market
and lack of financial sophistication. Journal of Financial Economics, 123(1), pp.42-58.
Fard, H.V. and Falah, A.B., 2015. A New Modified CAPM Model: The Two Beta
CAPM. Jurnal UMP Social Sciences and Technology Management Vol, 3(1).
Jackowicz, K., Mielcarz, P. and Wnuczak, P., 2017. Fair value, equity cash flow and project
finance valuation: ambiguities and a solution. Managerial Finance, 43(8), pp.914-927.
Jain, S., Mitra, A., Haidary, M. and Tiwari, A., 2017. CALCULATION OF BETA OF
PRIVATE COMPANY USING MODIFIED CAPM FORMULA.
Mehta, S. and Afzelius, D., 2017. Gotta CAPM'All: An Empirical Study on the Validity of
the CAPM Against Four Unique Assets. Available at SSRN 2995585.
Waugh, J., Hooper, R., Lamb, E., Robson, S., Shennan, A., Milne, F., Price, C.,
Thangaratinam, S., Berdunov, V. and Bingham, J., 2017. Spot protein-creatinine ratio and
spot albumin-creatinine ratio in the assessment of pre-eclampsia: a diagnostic accuracy study
with decision-analytic model-based economic evaluation and acceptability analysis. Health
technology assessment (Winchester, England), 21(61), p.1.
Xu, L., 2018. Empirical Analysis of the Relationship Between Price-Earnings Ratio and the
Development of the Capital Markets. Economic Management Journal, 7(2).
Zografidou, E., Petridis, K., Petridis, N.E. and Arabatzis, G., 2017. A financial approach to
renewable energy production in Greece using goal programming. Renewable energy, 108,
pp.37-51.
1 out of 13
Related Documents

Your All-in-One AI-Powered Toolkit for Academic Success.
 +13062052269
info@desklib.com
Available 24*7 on WhatsApp / Email
Unlock your academic potential
© 2024  |  Zucol Services PVT LTD  |  All rights reserved.