Financial Analysis Project: Finance Concepts and Valuation Techniques

Verified

Added on  2020/01/23

|7
|1693
|83
Project
AI Summary
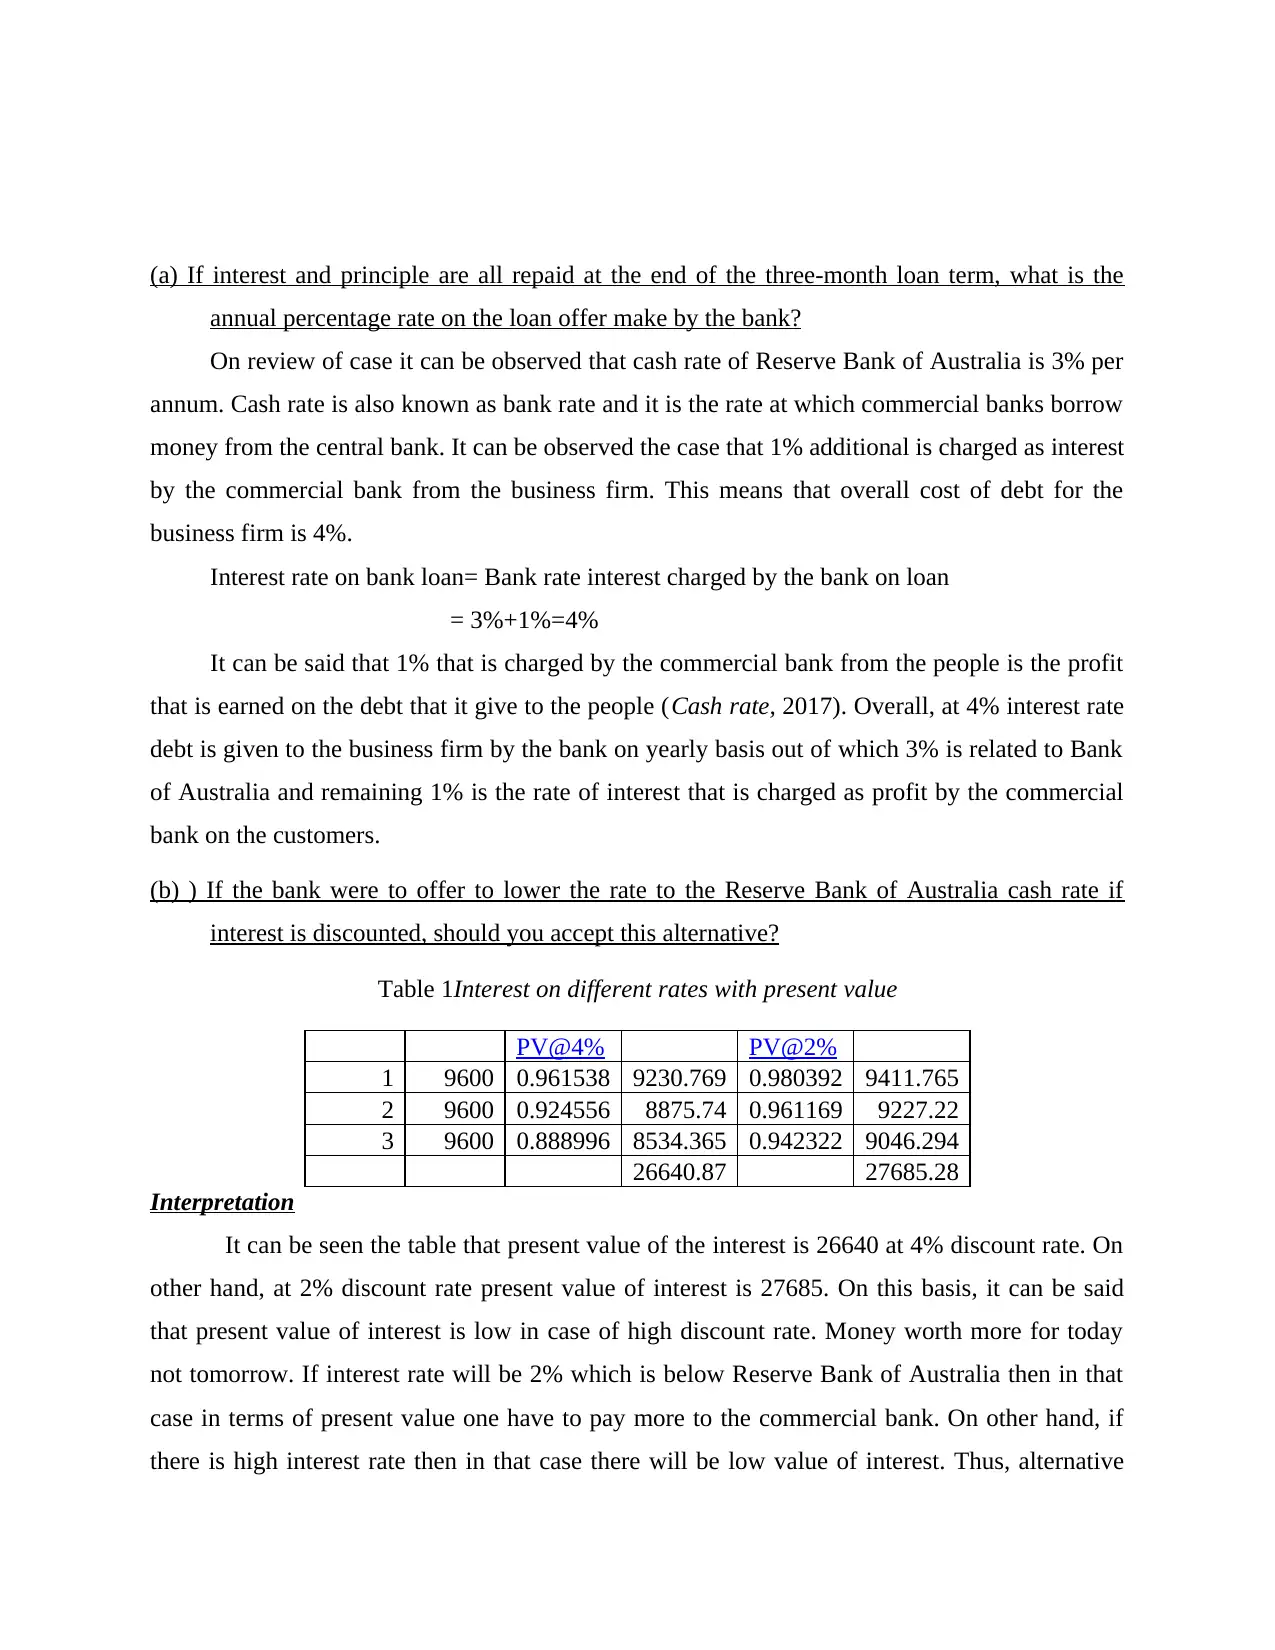
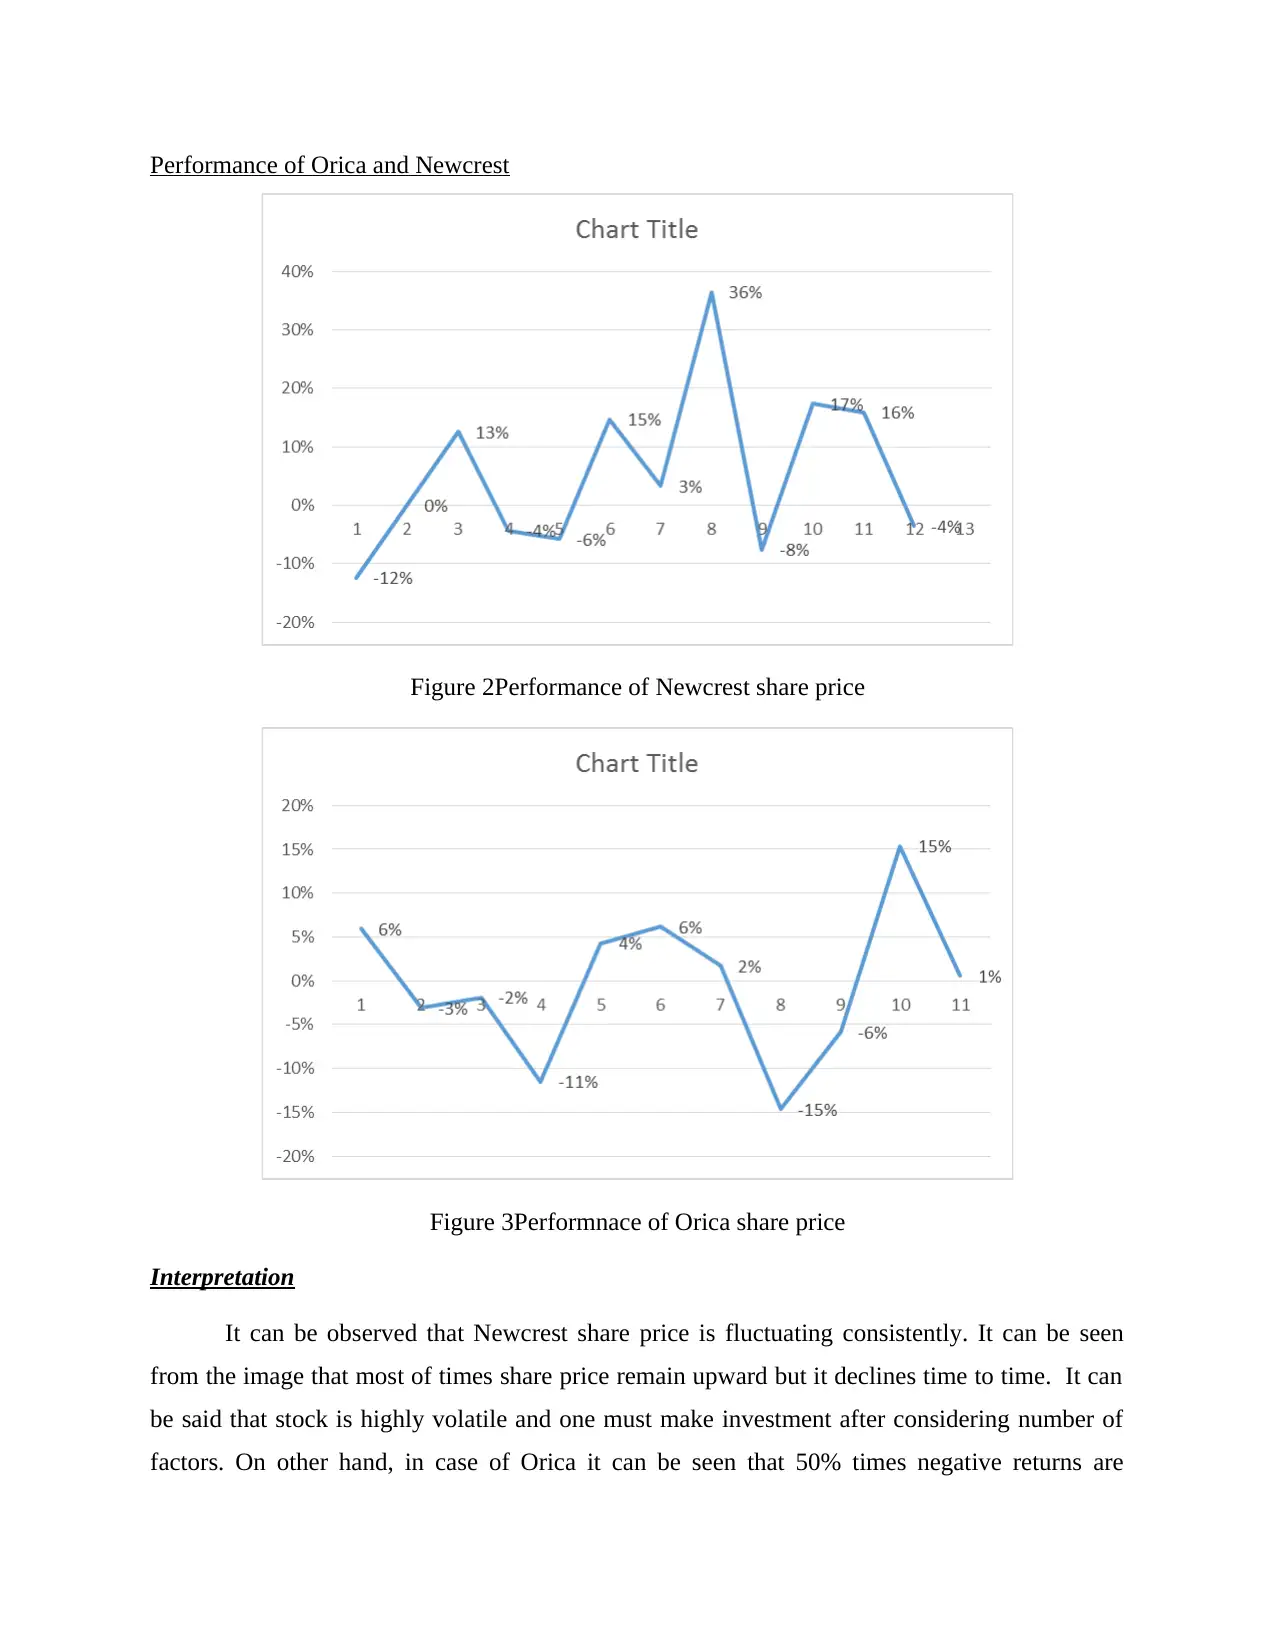
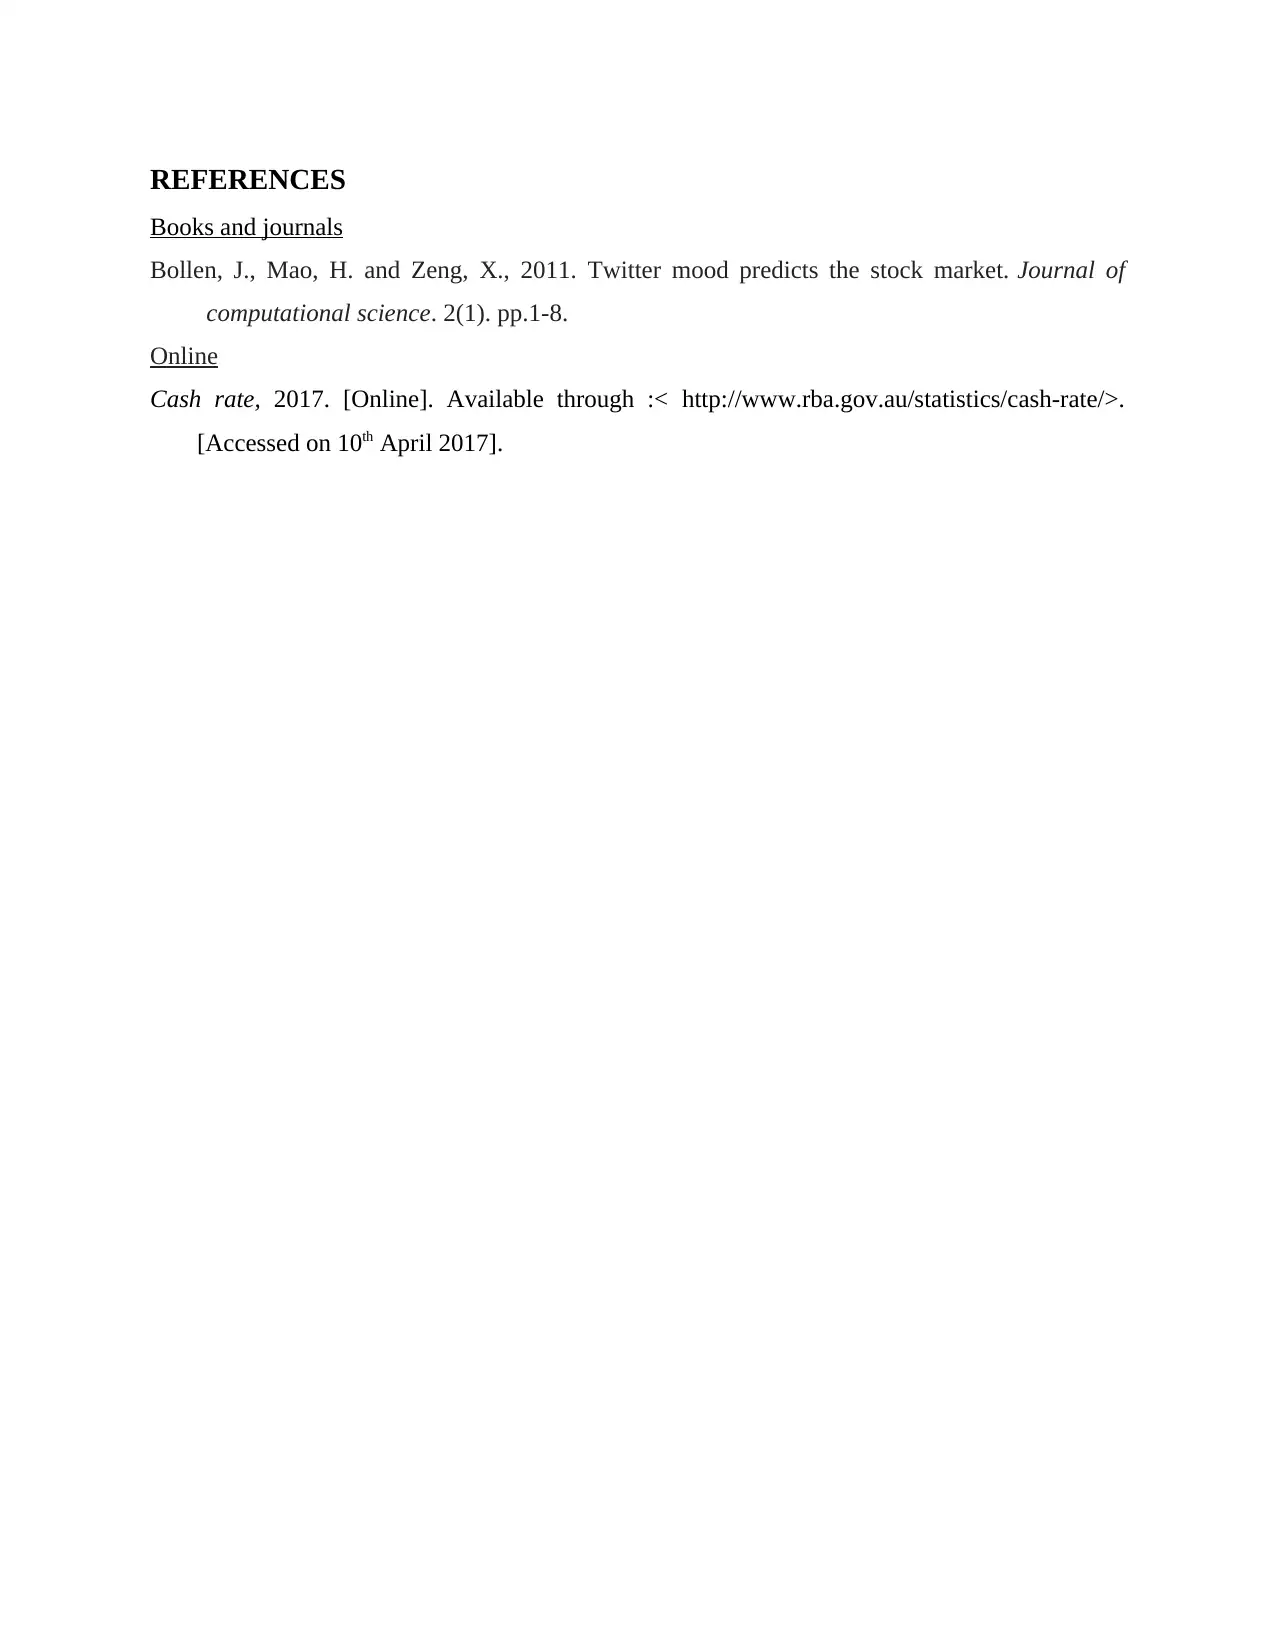
This project analyzes several financial concepts. Part A focuses on a loan scenario, calculating the annual percentage rate (APR) and evaluating an alternative interest rate offer. Part B delves into portfolio analysis, computing the expected return and beta of a portfolio, and interpreting the security market line to assess stock performance. Part C applies the Capital Asset Pricing Model (CAPM) to determine required rates of return for two companies, followed by a valuation using the constant dividend growth model. The project concludes with a comparison of the performance of two stocks, Newcrest and Orica, based on their share price fluctuations over time. The analysis utilizes tables, calculations, and graphical representations to support the findings, offering insights into financial decision-making and investment strategies. The provided solution is available on Desklib, a platform offering AI-based study tools.
Document Page
(a) If interest and principle are all repaid at the end of the three-month loan term, what is the
annual percentage rate on the loan offer make by the bank?
On review of case it can be observed that cash rate of Reserve Bank of Australia is 3% per
annum. Cash rate is also known as bank rate and it is the rate at which commercial banks borrow
money from the central bank. It can be observed the case that 1% additional is charged as interest
by the commercial bank from the business firm. This means that overall cost of debt for the
business firm is 4%.
Interest rate on bank loan= Bank rate interest charged by the bank on loan
= 3%+1%=4%
It can be said that 1% that is charged by the commercial bank from the people is the profit
that is earned on the debt that it give to the people (Cash rate, 2017). Overall, at 4% interest rate
debt is given to the business firm by the bank on yearly basis out of which 3% is related to Bank
of Australia and remaining 1% is the rate of interest that is charged as profit by the commercial
bank on the customers.
(b) ) If the bank were to offer to lower the rate to the Reserve Bank of Australia cash rate if
interest is discounted, should you accept this alternative?
Table 1Interest on different rates with present value
PV@4% PV@2%
1 9600 0.961538 9230.769 0.980392 9411.765
2 9600 0.924556 8875.74 0.961169 9227.22
3 9600 0.888996 8534.365 0.942322 9046.294
26640.87 27685.28
Interpretation
It can be seen the table that present value of the interest is 26640 at 4% discount rate. On
other hand, at 2% discount rate present value of interest is 27685. On this basis, it can be said
that present value of interest is low in case of high discount rate. Money worth more for today
not tomorrow. If interest rate will be 2% which is below Reserve Bank of Australia then in that
case in terms of present value one have to pay more to the commercial bank. On other hand, if
there is high interest rate then in that case there will be low value of interest. Thus, alternative
tabler-icon-diamond-filled.svg

Paraphrase This Document

Need a fresh take? Get an instant paraphrase of this document with our AI Paraphraser
Document Page
that is given cannot be accepted. On can make investment in any specific avenue and can earn
huge amount of profit on investment. If we observe and ignore present value method then in that
case higher amount of interest one have to pay on 4% interest rate. Thus, in order to offset this
point one can make investment of some proportion of debt in any security like equity and can
good amount of return.
Part B
(a)Expected return on the portfolio
Expected return on the portfolio is 15.80%. This means that it is expected that in the
upcoming time period return of 15.80% can be earned on the investment that is made on the
portfolio. In order to compute the expected return systematic process is followed and under this
expected return percentage is multiplied by weight that is related to the specific company. In
other words, it can be said that for computing expected return for the specific stock which
Harvey Norman holding limited in the portfolio its expected return 16% is multiplied to weight
which is 20%. Same thing is done in case of all other stocks in the portfolio. By adding expected
return for all stock portfolio return is computed which is 15.80%. It can be said that sufficient
amount of return can be earned on the invested amount in the portfolio. It can be said that for the
risk that is taken on the investment sufficient amount of return is generated. It can be seen that
there are four stocks out of 5 on which there is heavy risk as indicated by higher beta value
which is 1 or above.
(b) Calculation of portfolio beta
In order to compute portfolio beta return on same is multiplied to stock beta. For example in
the table that is given in the appendix it can be observed that expected portfolio return is 15.80%
and same is multiplied to the beta value of Harvey Norman holding limited, National Australia
bank, Qantas airways limited, Origin energy ltd and BHP Billiton Limited. Computed value is
added and in this way portfolio beta is calculated. It can be observed that portfolio beta value is
0.82 which reflects that there is a very heavy risk on the investment that is made on the portfolio.
Thus, it can be said that with slight change in the market big variation can be observed in the
portfolio return. There is a high beta value of the portfolio because its components beta value is
very high. Hence, one need to follow cautious approach while making investment in the
portfolio.
Document Page
© Security market line
Figure 1Security market line
Security market line refers to the chart under which graphical representation of CAPM or capital
asset pricing model is done on the chart. In the chart factors like systematic risk which is also
known as market risk is taken to consideration for computing values of CAPM model. In the
security market line chart expected return are plotted against the market return and extent to
which specific stock perform well or bad is identified. It can be said that security market line is
the one of the main tool that is used to make stock related decisions (Bollen, Mao and Zeng,
2011). It can be observed from the image given above that return of the stocks which are Harvey
Norman holding limited, National Australia bank, Qantas airways limited, Origin energy ltd and
BHP Billiton Limited is lower than market return. It can be said that stocks are performing below
market in terms of return. However, in some stocks gap is reduced between both lines and this
means that in case of some stocks return nearby to market return can be obtained.
(d) Winners and losers in security market line
It can be seen from the chart given above that there are no winners and all are losers. This is
because there is no stock in the security market line that is beating the standard market return. It
can be said that that all stocks are generating return below market which means that there is no
winner in the security marker line.
Document Page
(e) Consideration of conclusion to be less certain
The conclusion that is prepared is less certain because market conditions keeps on changing
consistently. There is a very high beta value of most of stocks and in future value of same can
increase which will lead to change in position of stock and some shares can come in position of
winner in the portfolio. It can be said that that conclusion that is formed above is less certain to
happen really.
Part C
Required rate of return on CAPM model
Required rate of return is computed by using capital asset pricing model in case of Newcrest
and Orica. It can be observed from the table that beta value of Newcrest is -0.03 and same for
Orica is 0.65. This means that with change in the index value stock change by -0.03 percentage.
On other hand, in case of Orica beta value is 0.65 which reflects that there is moderate risk on
the investment that is made on the Orica. It can be observed from the above given value that
required rate of return in case of Newcrest is 0.33 and same in case of Orica is 10.08. This means
that required rate of return is higher in case of Orica then Newcrest.
Valuation by using constant dividend growth model
Dividend growth model is one of model in which value of shares is computed. It can be seen
from the table that fair value of share of Orica is 0.032 and same of Newcrest is 0.29. This
reflects that both firms shares are overvalued in comparison to market price. It can be said that
one can make investment in both firms.
tabler-icon-diamond-filled.svg

Paraphrase This Document

Need a fresh take? Get an instant paraphrase of this document with our AI Paraphraser
Document Page
Performance of Orica and Newcrest
Figure 2Performance of Newcrest share price
Figure 3Performnace of Orica share price
Interpretation
It can be observed that Newcrest share price is fluctuating consistently. It can be seen
from the image that most of times share price remain upward but it declines time to time. It can
be said that stock is highly volatile and one must make investment after considering number of
factors. On other hand, in case of Orica it can be seen that 50% times negative returns are
Document Page
generated by shares in the stock market on month basis. Hence, one must not make investment in
Orica. In case of Newcrest only in one or two months negative return is observed. Hence, one
can make investment in mentioned firm at place of Orica.
Document Page
REFERENCES
Books and journals
Bollen, J., Mao, H. and Zeng, X., 2011. Twitter mood predicts the stock market. Journal of
computational science. 2(1). pp.1-8.
Online
Cash rate, 2017. [Online]. Available through :< http://www.rba.gov.au/statistics/cash-rate/>.
[Accessed on 10th April 2017].
chevron_up_icon
1 out of 7
circle_padding
hide_on_mobile
zoom_out_icon
[object Object]