Financial Analysis Project: Analysis of Financial Statements
VerifiedAdded on  2021/12/12
|18
|2316
|253
Report
AI Summary
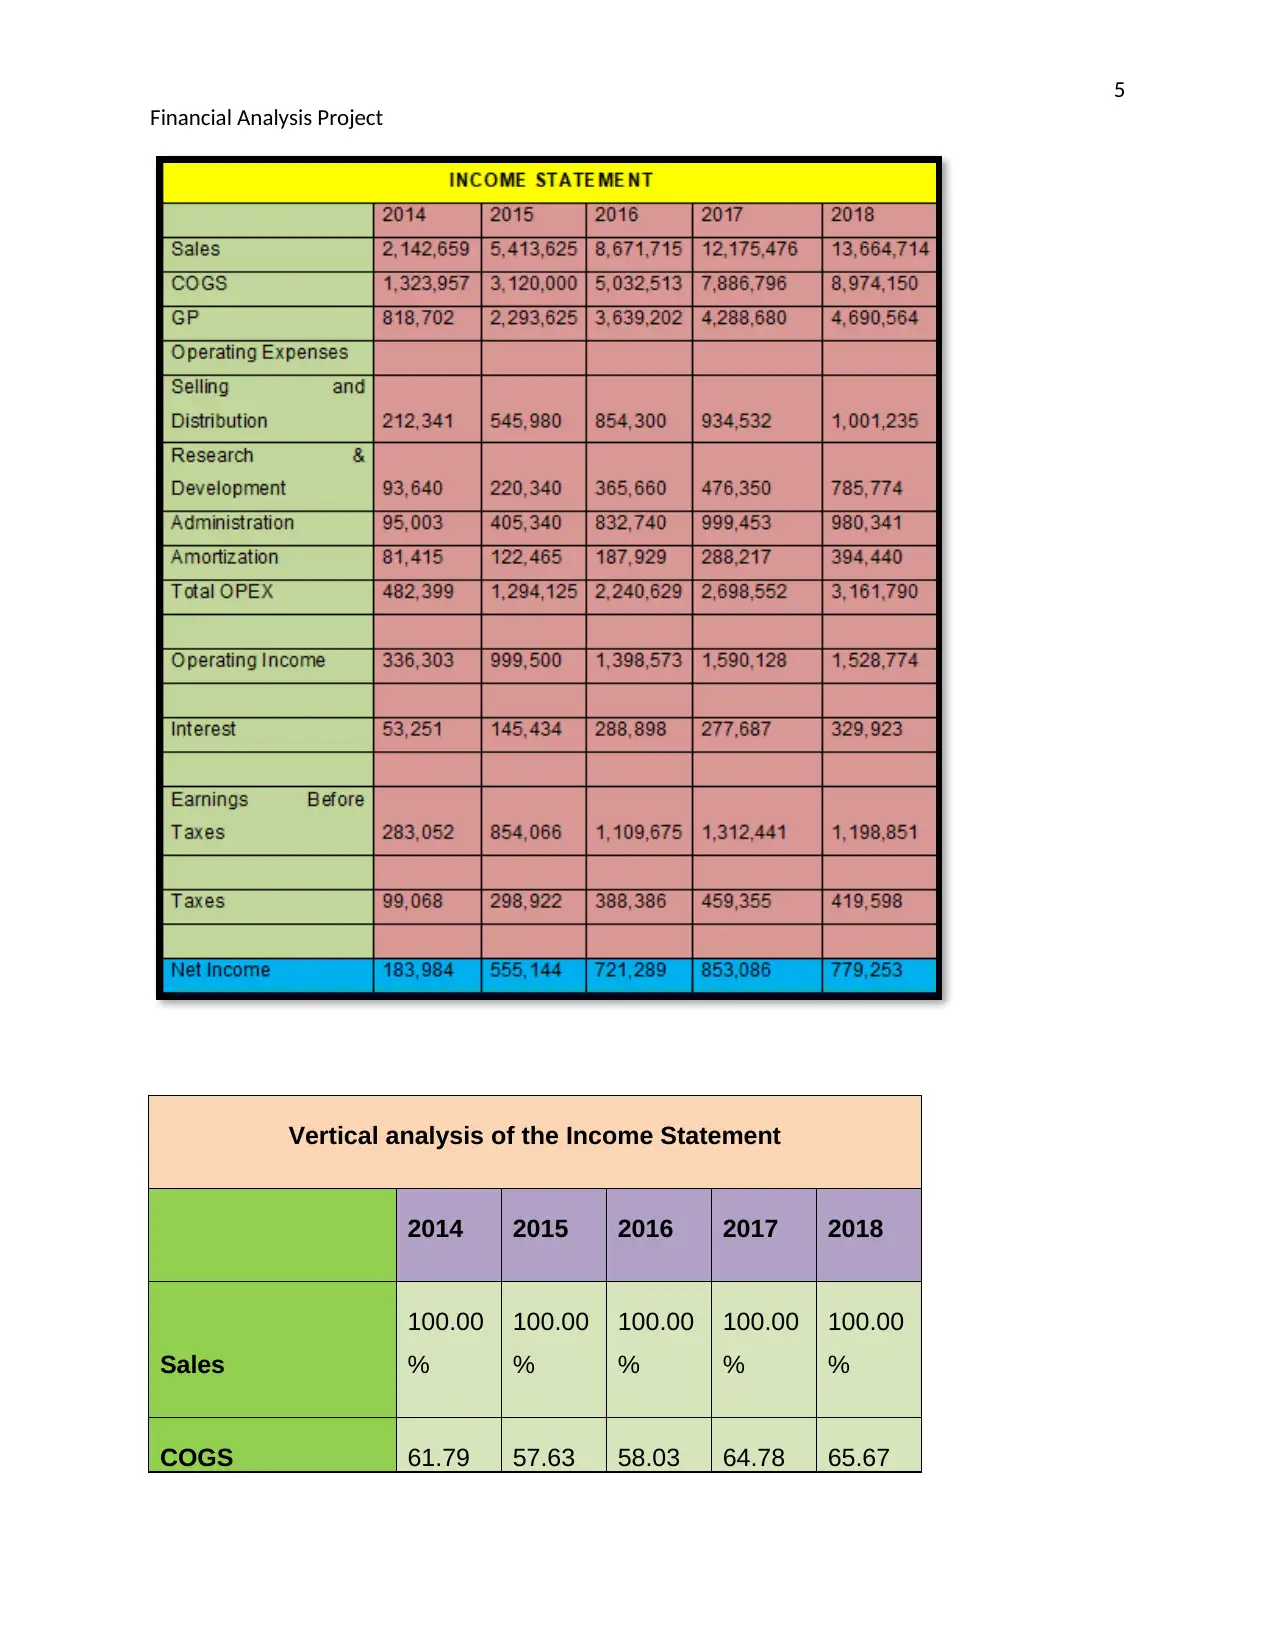
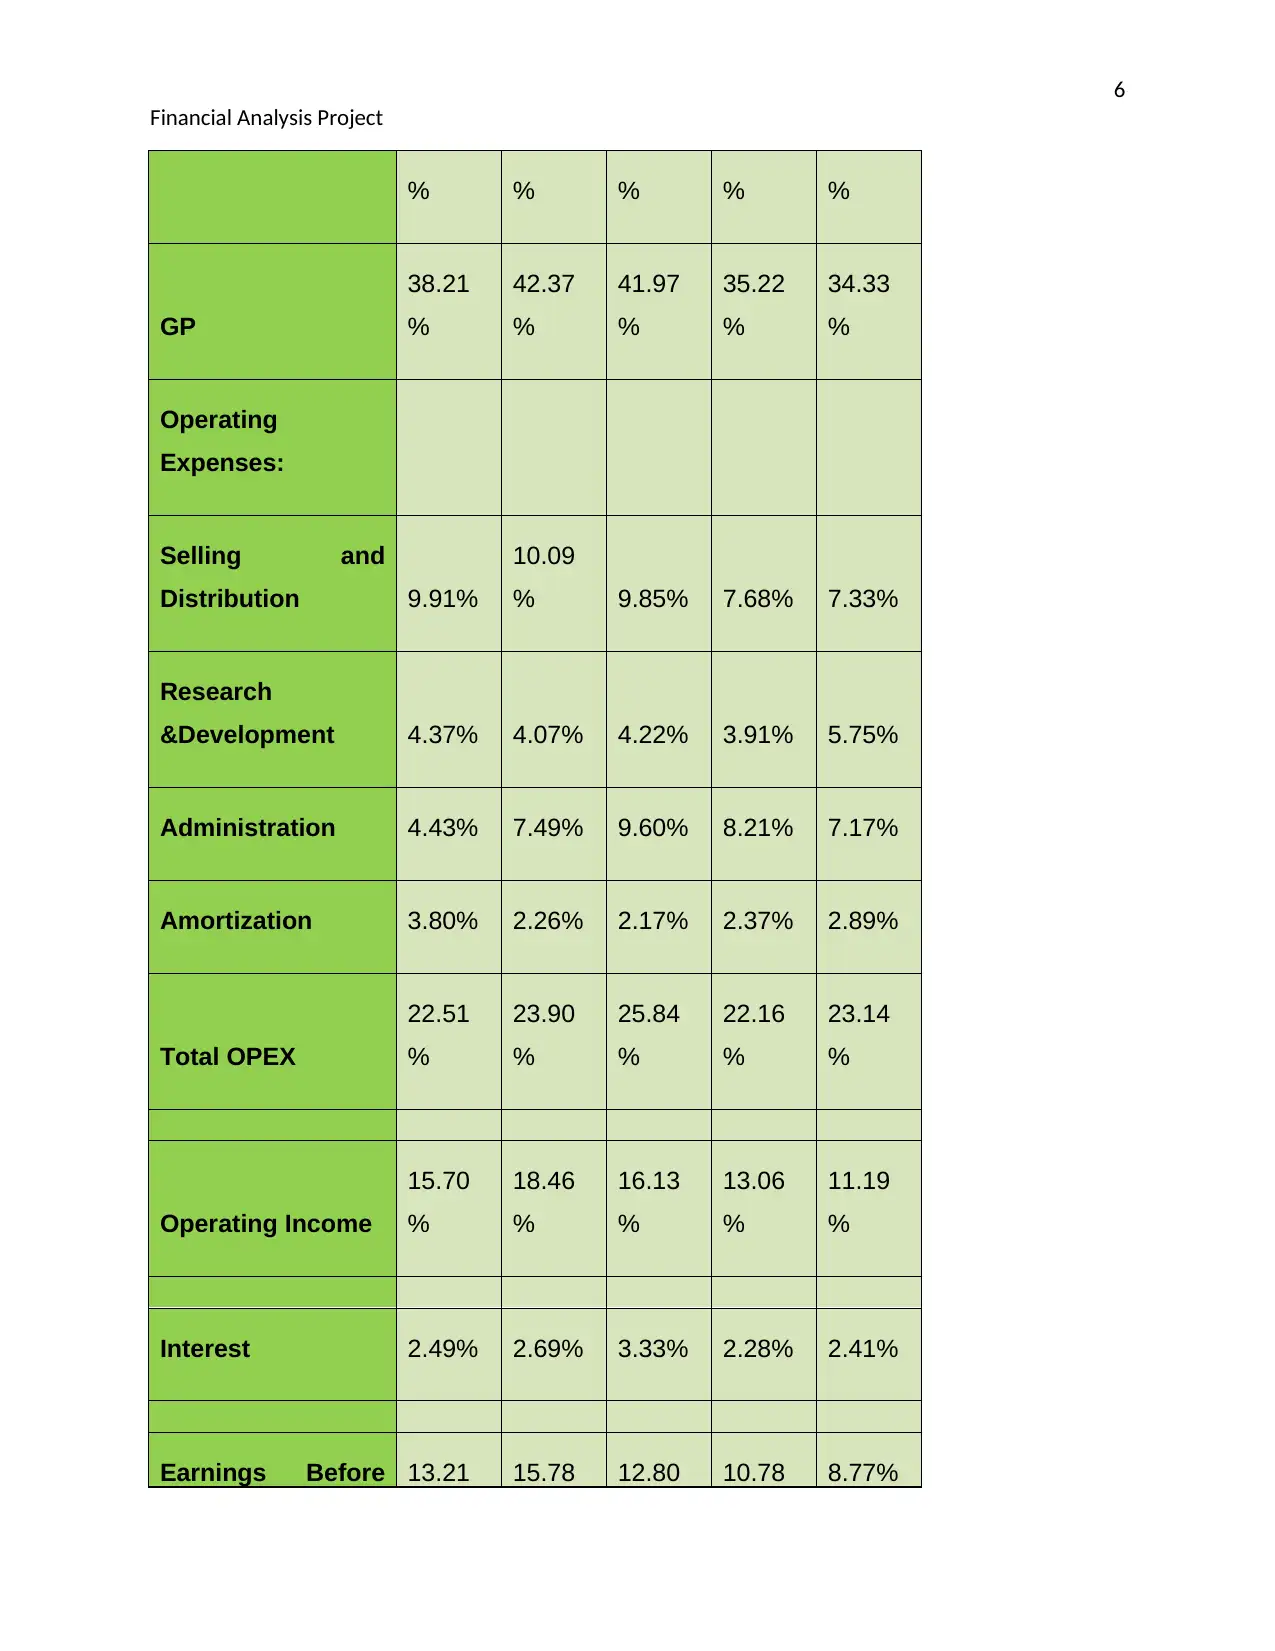
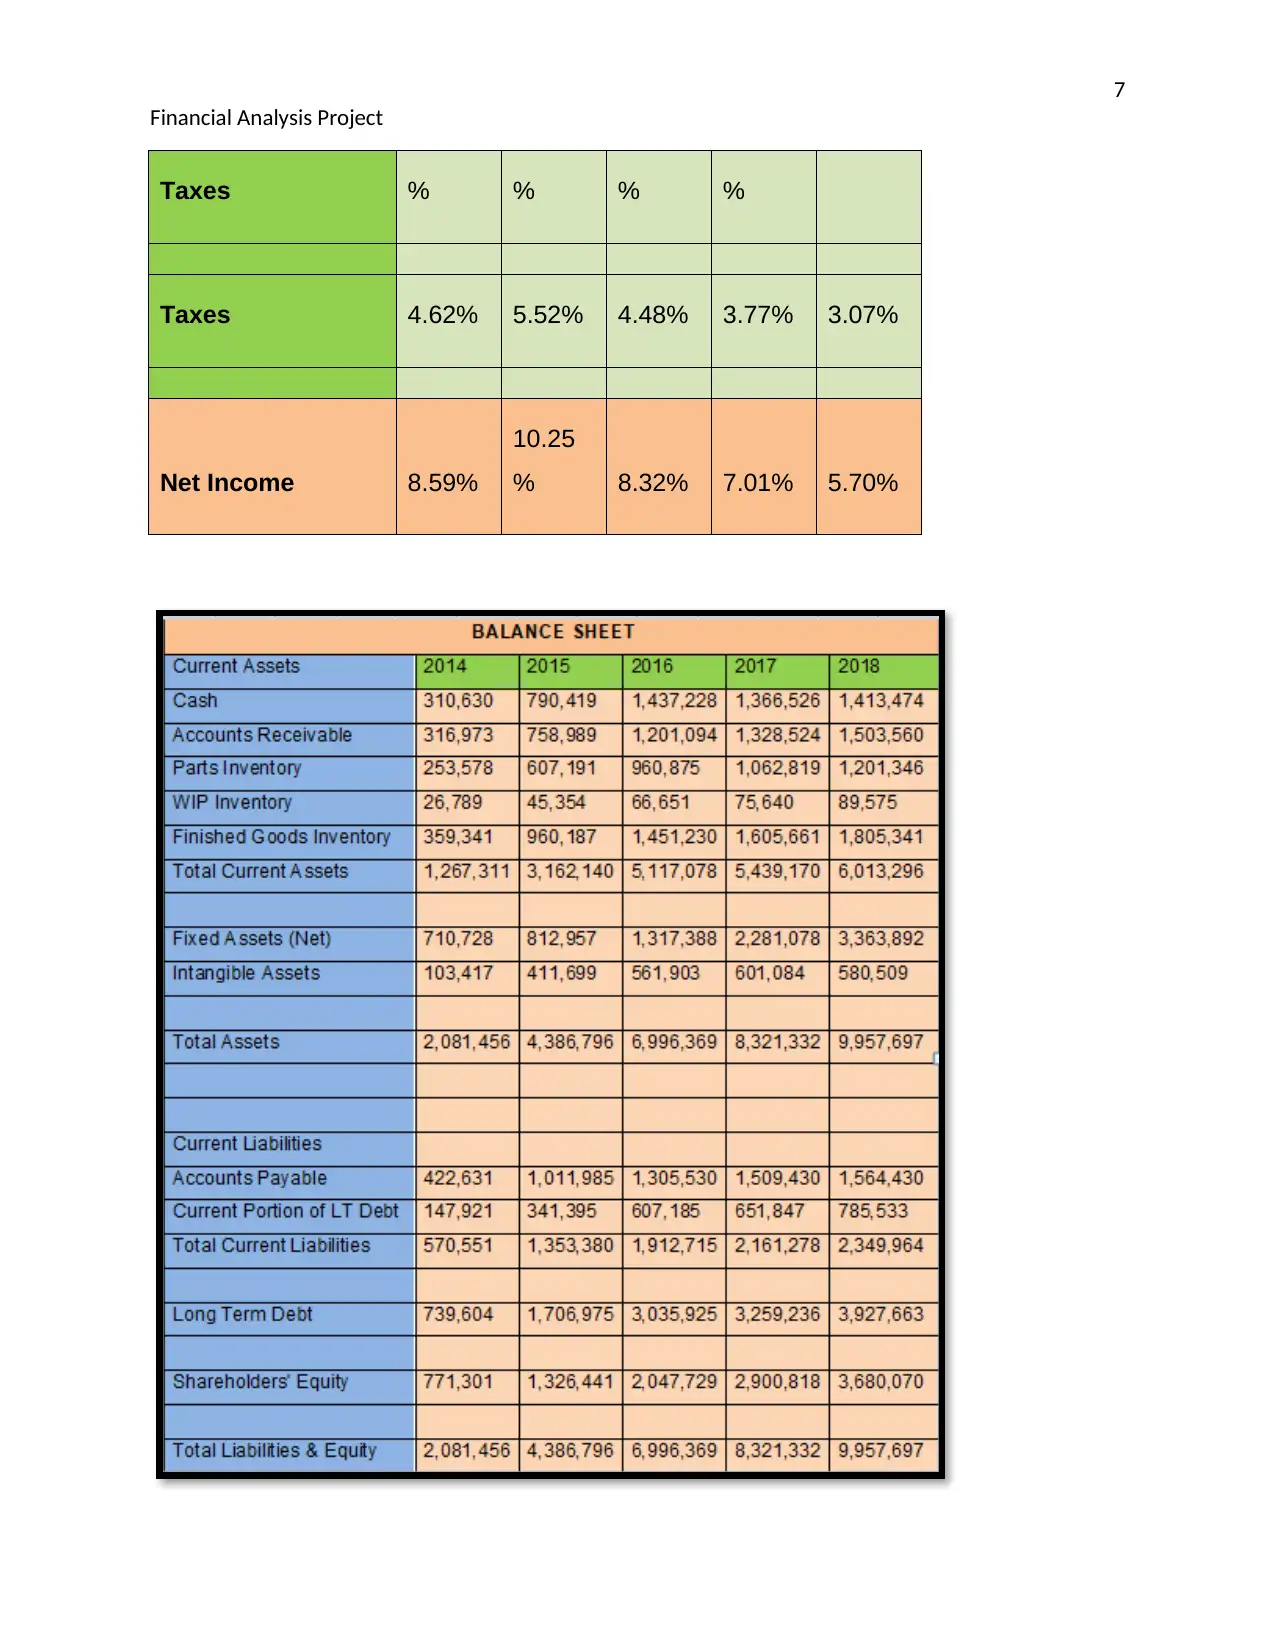
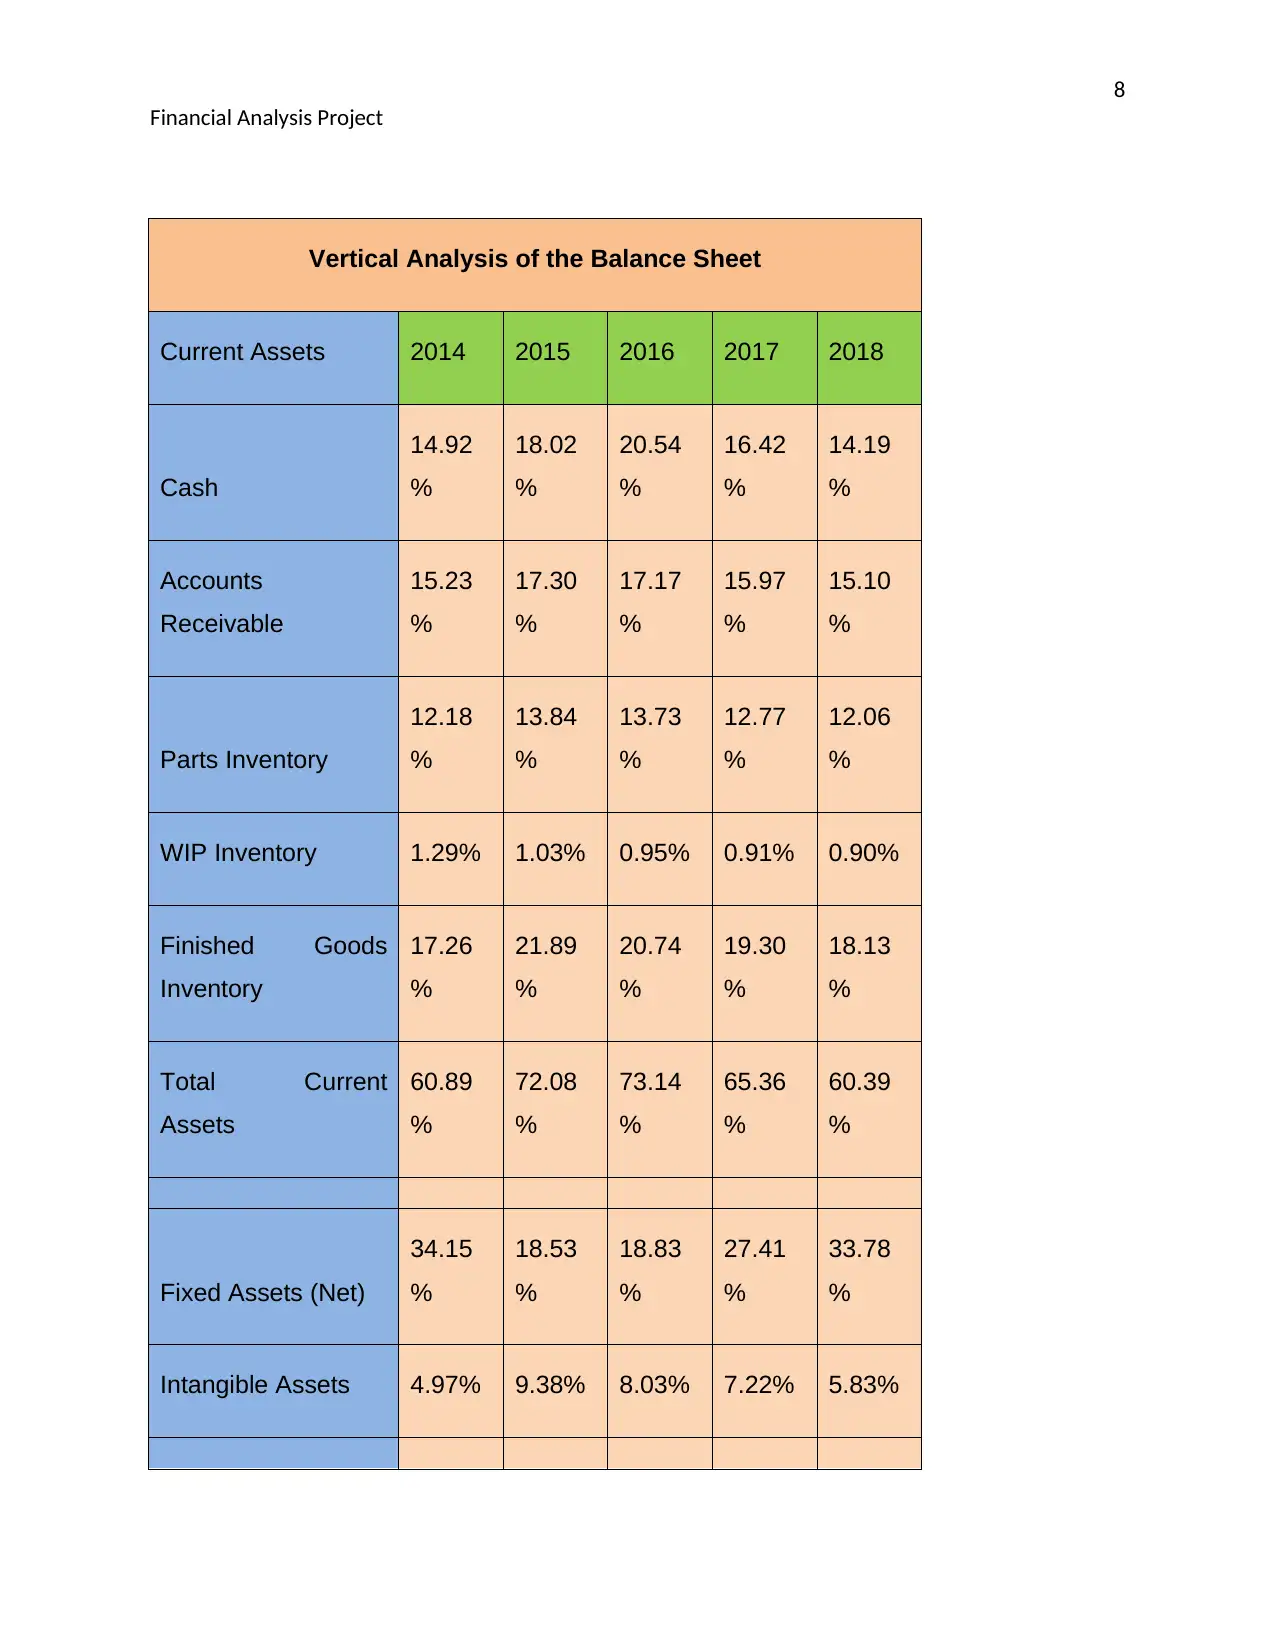
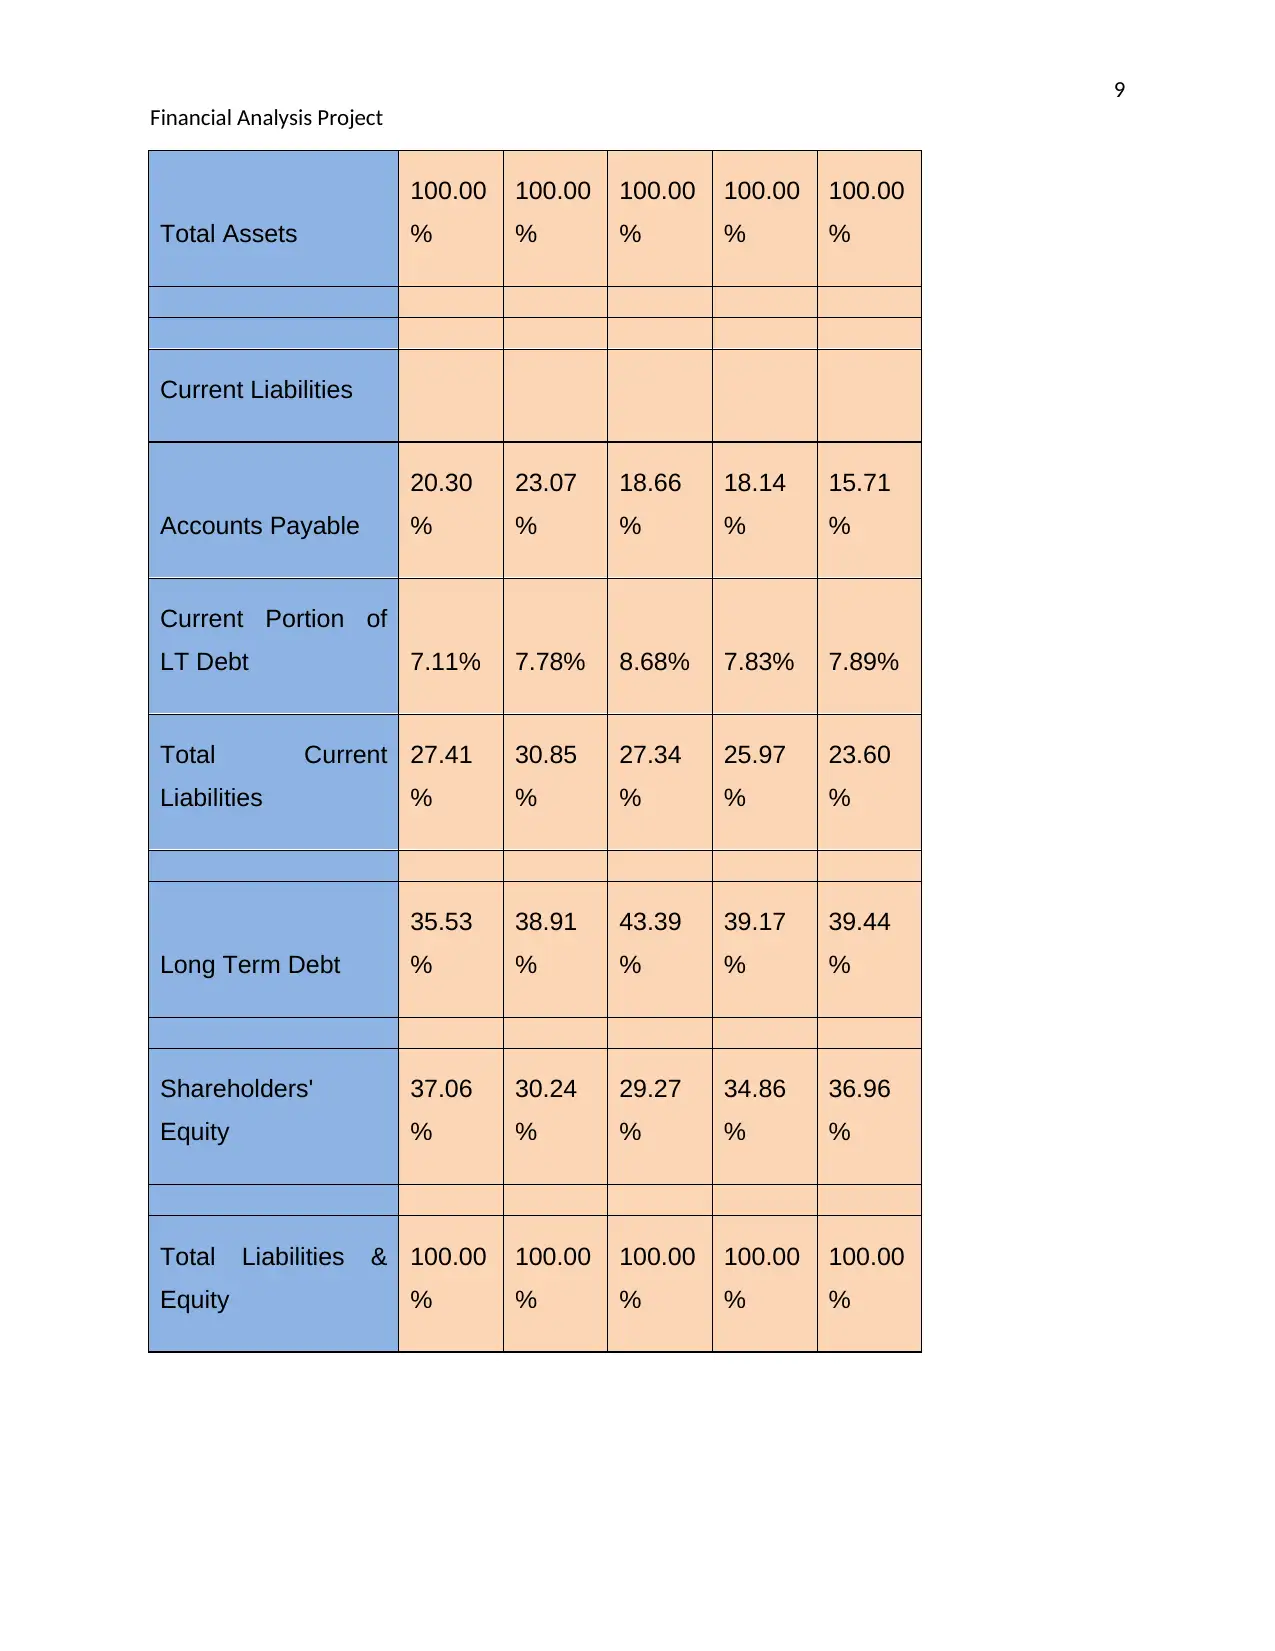
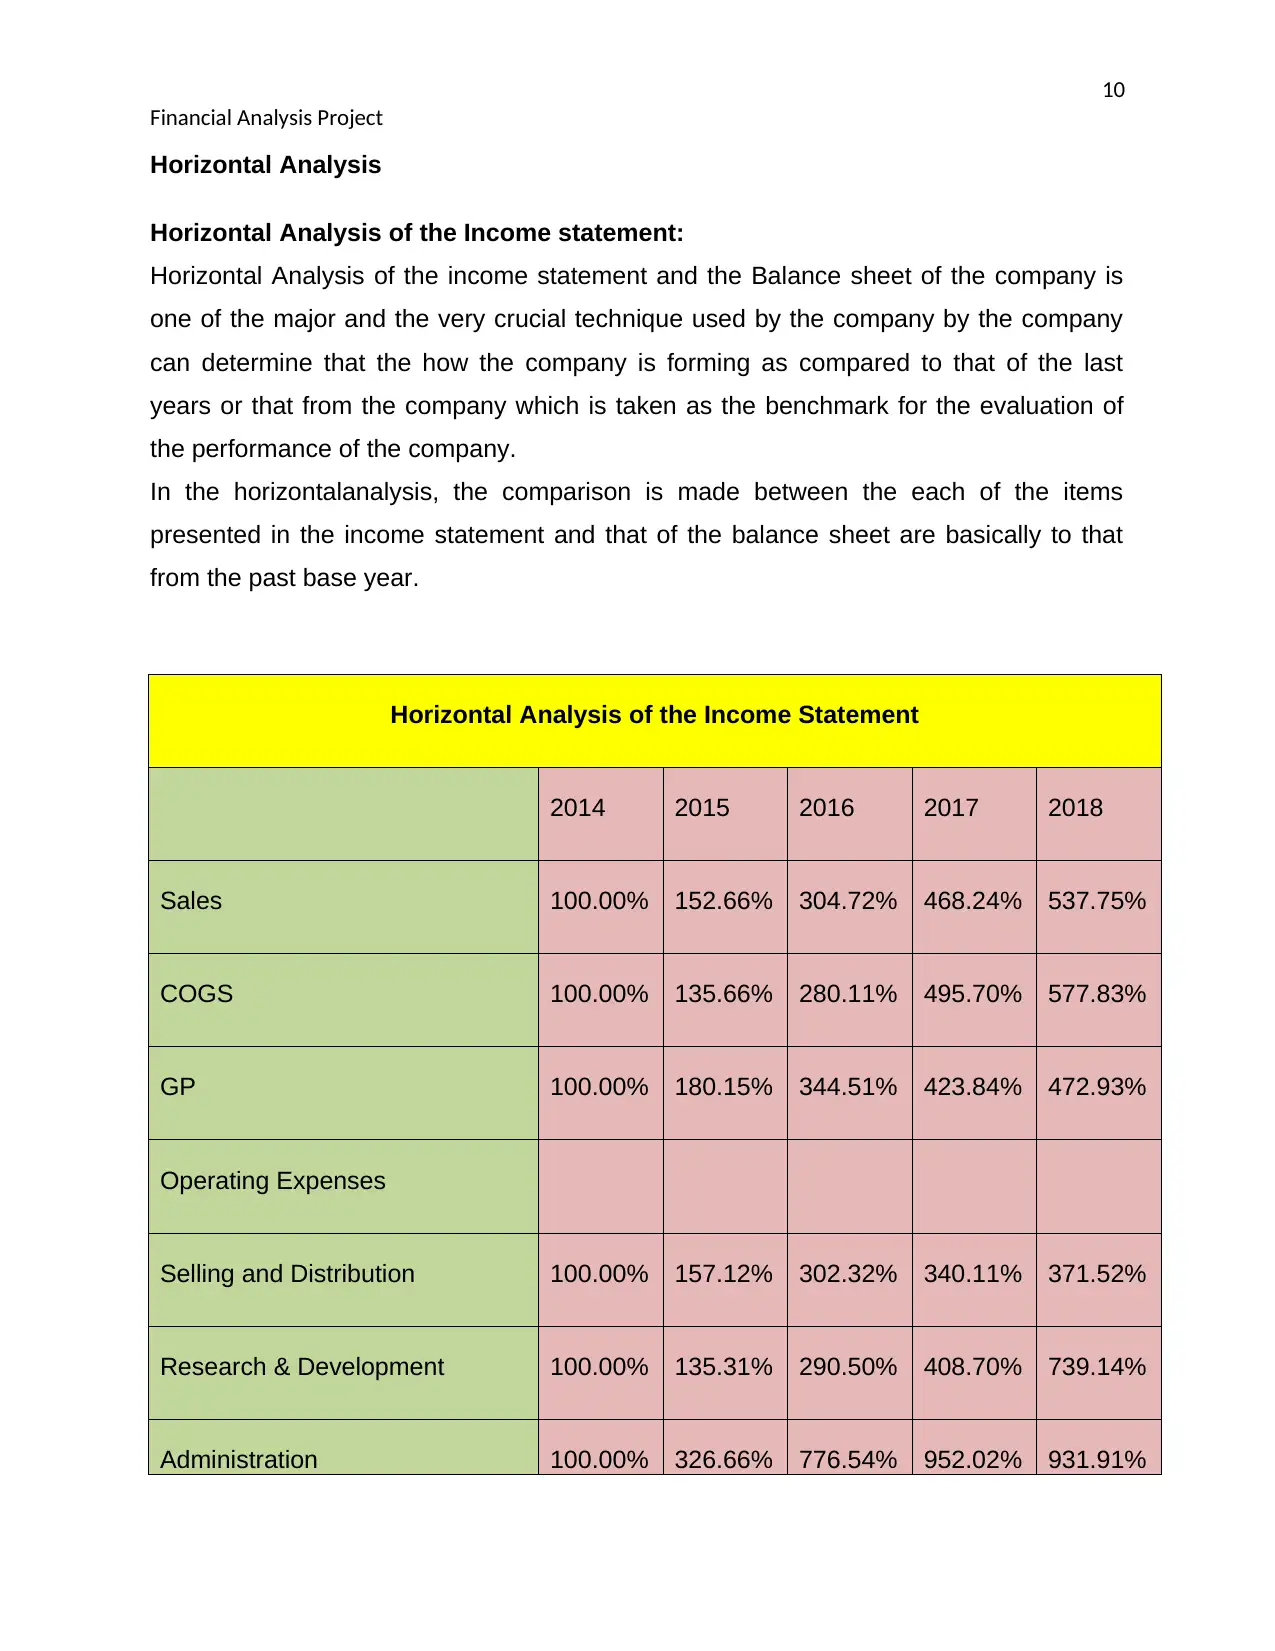
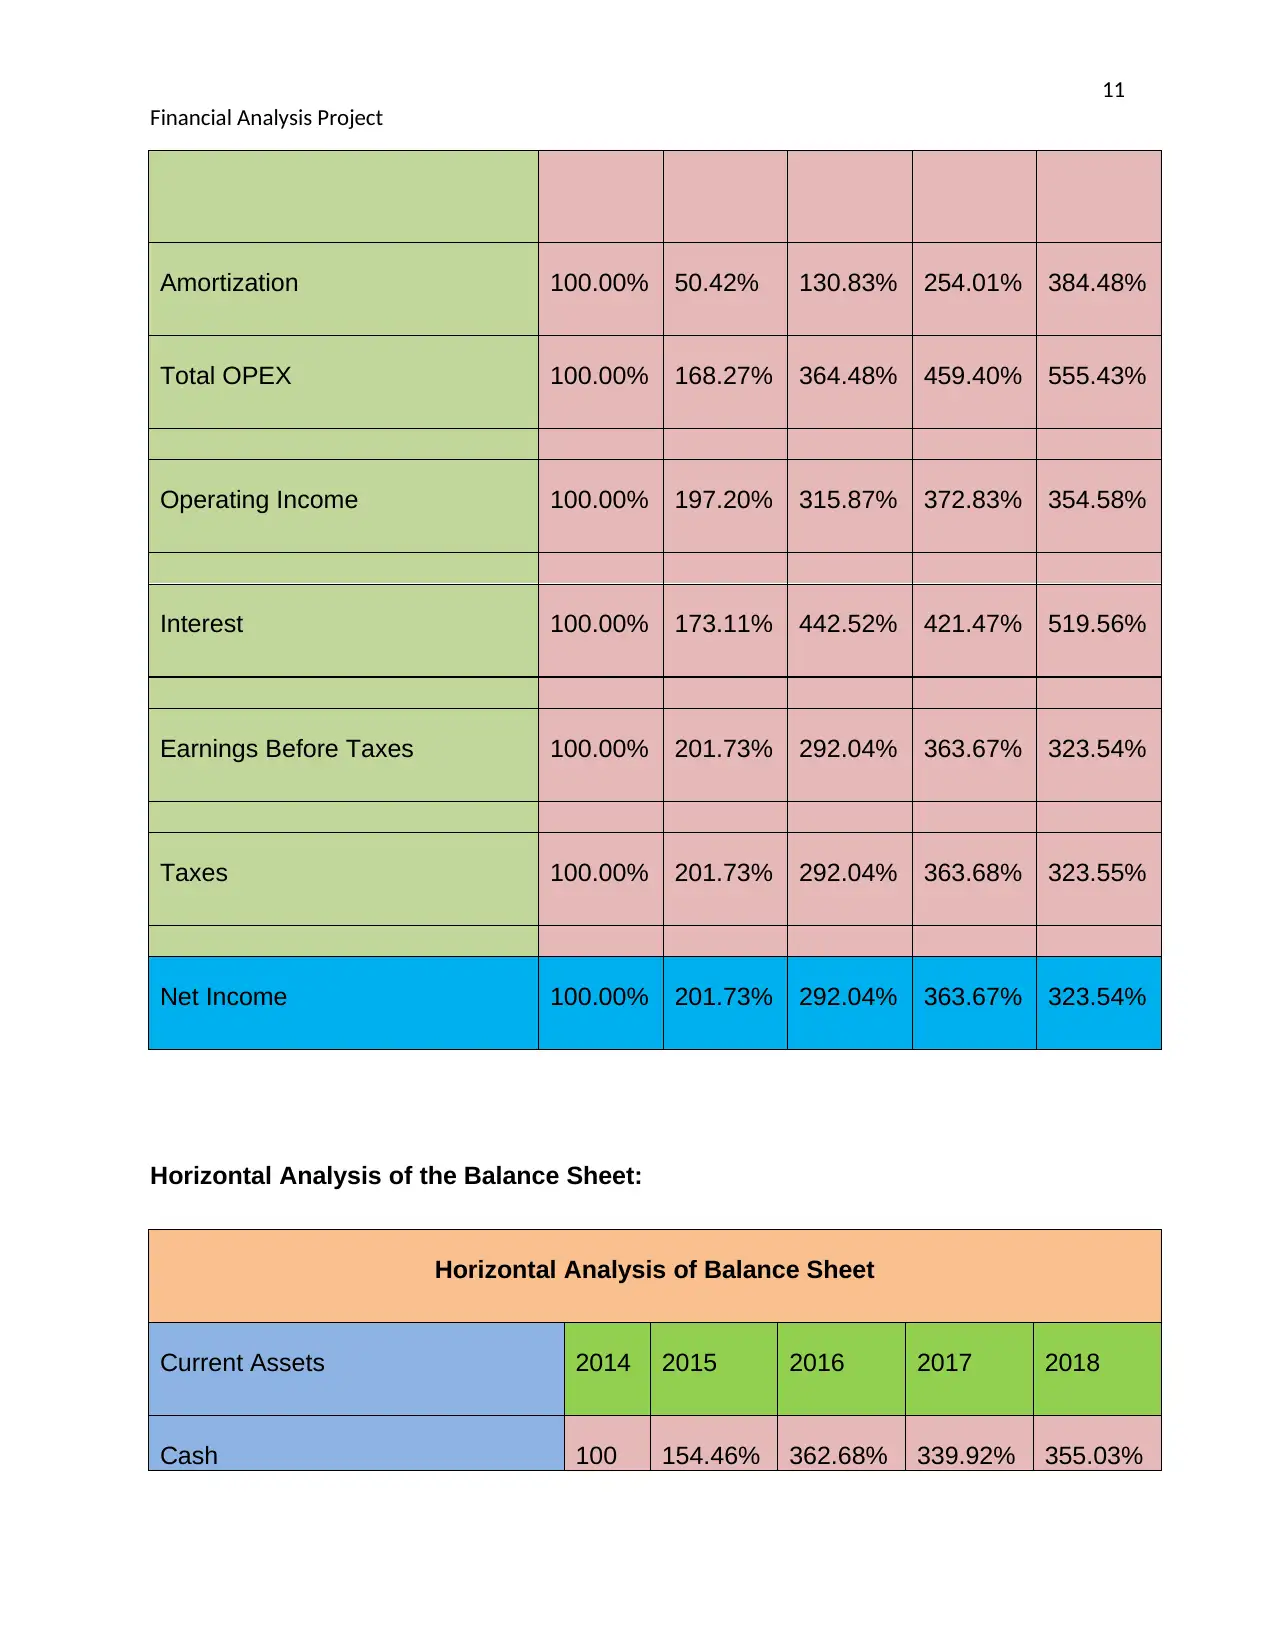
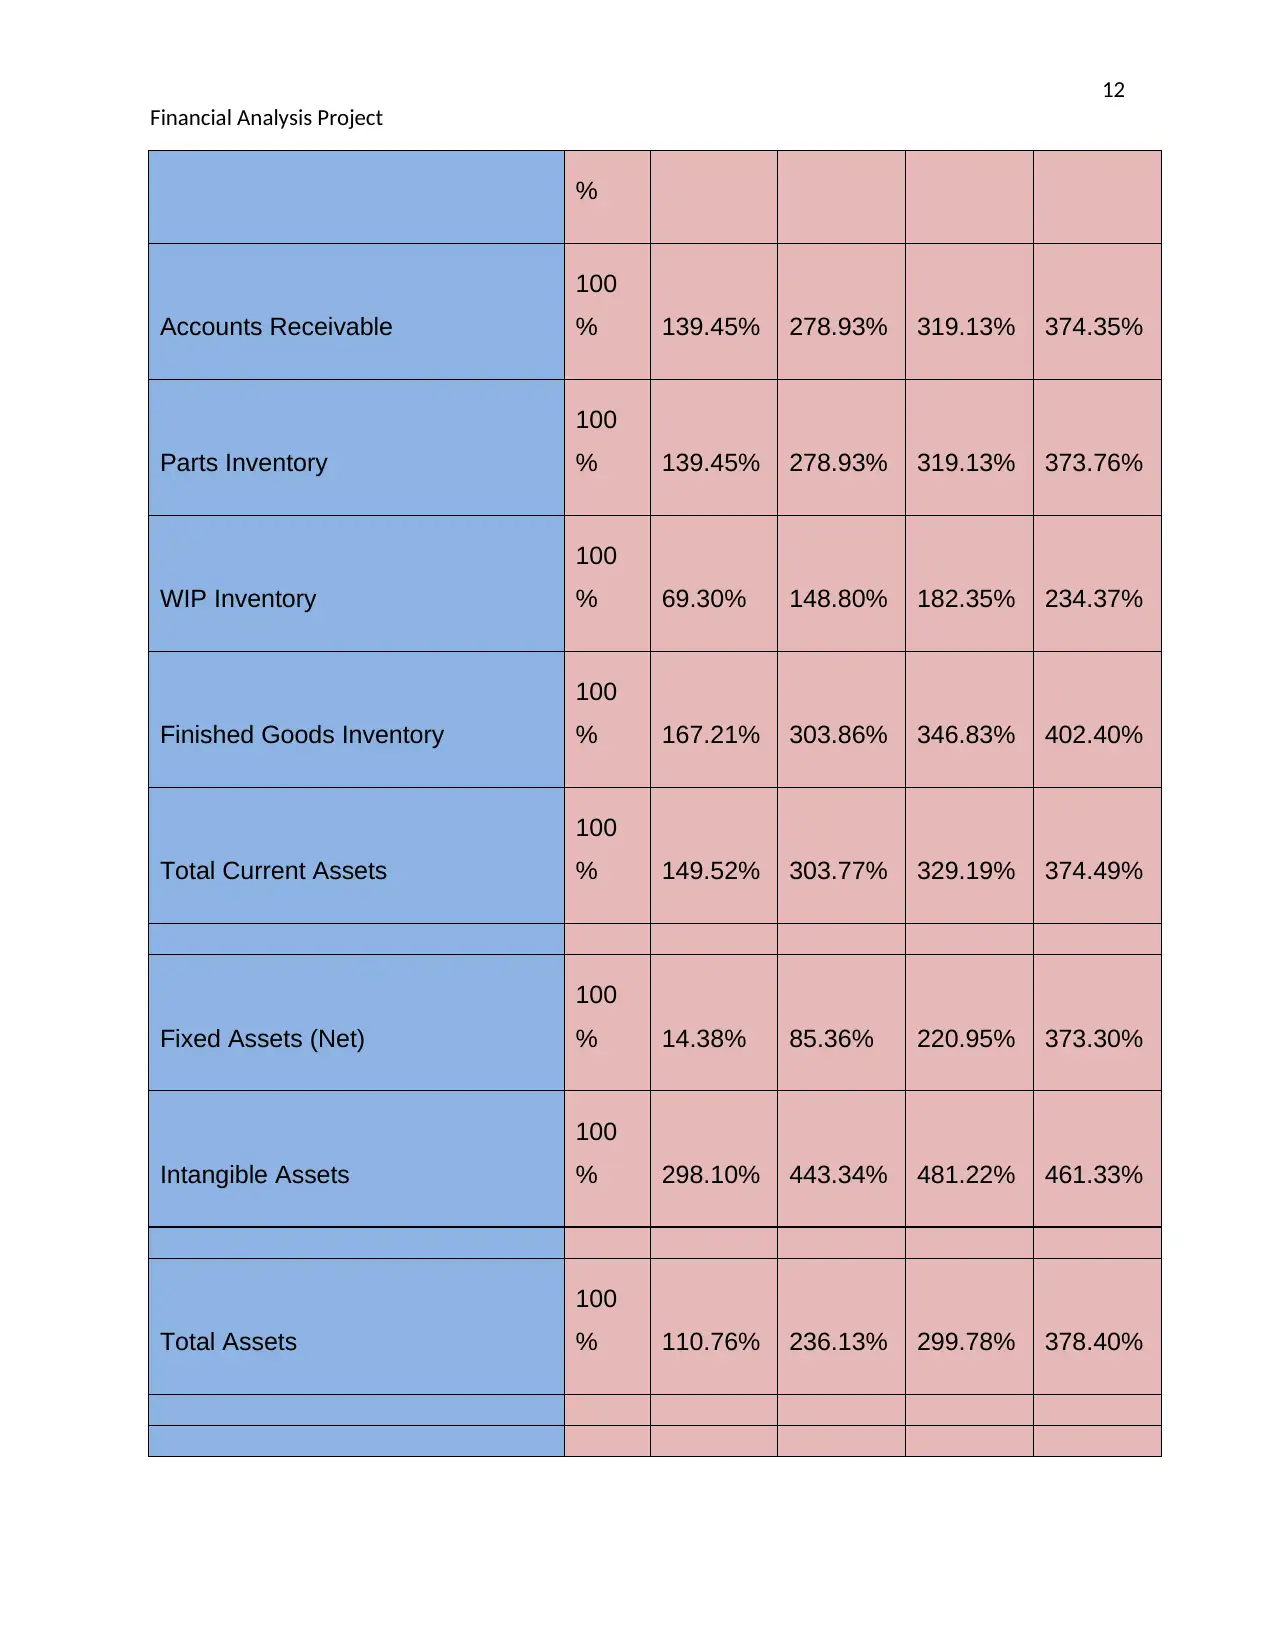
This report presents a financial analysis project that includes vertical and horizontal analyses of a company's financial statements, covering the years 2014 to 2018. The analysis begins with an introduction outlining the project's objectives and then proceeds to detailed examinations of the income statement and balance sheet using vertical analysis, which highlights the relative size of different accounts, and horizontal analysis, which compares financial data over time. The report includes tables presenting the percentages derived from both analyses, offering insights into trends in sales, cost of goods sold, operating expenses, and net income. A memo summarizing key findings and recommendations is also included, focusing on profitability, expense management, and overall financial performance. The report concludes with a discussion of the implications of the analyses and provides references to supporting literature.

1
Financial Analysis Project
Course name-
Student name-
Student number-
Financial Analysis Project
Course name-
Student name-
Student number-
Paraphrase This Document
Need a fresh take? Get an instant paraphrase of this document with our AI Paraphraser

2
Financial Analysis Project
Table of Contents
Introduction:...............................................................................................................................................3
Vertical Analysis........................................................................................................................................4
Horizontal Analysis...................................................................................................................................8
Memo Outlining:......................................................................................................................................10
Conclusion:................................................................................................................................................14
References:.............................................................................................................................................15

3
Financial Analysis Project
Introduction:
The project represents the horizontal and the vertical analysis of the financial
statements of the company. This will help in gaining the insight of the company
financials in order to make an informed decision related to the business.Further, the
assignment contains the key recommendation in the form of memo based on the
analysis.
⊘ This is a preview!⊘
Do you want full access?
Subscribe today to unlock all pages.

Trusted by 1+ million students worldwide

4
Financial Analysis Project
Vertical Analysis
Vertical analysis of the income statement
Vertical Analysis is generally used by the company for representing the relative size of
the various accounts in the Final account statement of the company. Vertical analysis
can also be defined as the proportional analysis of the year ending financial statements
of the company (Caccioli, et. al., 2014). In the vertical analysis of the financial
statement, every item in the income statement is represented in the percentage form for
the net sales revenue generated by the company. Vertical analysis can be used in the
company at the single point of time when the company wants to make the proportionate
analysis of the account balances in the company.
Paraphrase This Document
Need a fresh take? Get an instant paraphrase of this document with our AI Paraphraser

5
Financial Analysis Project
Vertical analysis of the Income Statement
2014 2015 2016 2017 2018
Sales
100.00
%
100.00
%
100.00
%
100.00
%
100.00
%
COGS 61.79 57.63 58.03 64.78 65.67
Financial Analysis Project
Vertical analysis of the Income Statement
2014 2015 2016 2017 2018
Sales
100.00
%
100.00
%
100.00
%
100.00
%
100.00
%
COGS 61.79 57.63 58.03 64.78 65.67

6
Financial Analysis Project
% % % % %
GP
38.21
%
42.37
%
41.97
%
35.22
%
34.33
%
Operating
Expenses:
Selling and
Distribution 9.91%
10.09
% 9.85% 7.68% 7.33%
Research
&Development 4.37% 4.07% 4.22% 3.91% 5.75%
Administration 4.43% 7.49% 9.60% 8.21% 7.17%
Amortization 3.80% 2.26% 2.17% 2.37% 2.89%
Total OPEX
22.51
%
23.90
%
25.84
%
22.16
%
23.14
%
Operating Income
15.70
%
18.46
%
16.13
%
13.06
%
11.19
%
Interest 2.49% 2.69% 3.33% 2.28% 2.41%
Earnings Before 13.21 15.78 12.80 10.78 8.77%
⊘ This is a preview!⊘
Do you want full access?
Subscribe today to unlock all pages.

Trusted by 1+ million students worldwide

7
Financial Analysis Project
Taxes % % % %
Taxes 4.62% 5.52% 4.48% 3.77% 3.07%
Net Income 8.59%
10.25
% 8.32% 7.01% 5.70%
Financial Analysis Project
Taxes % % % %
Taxes 4.62% 5.52% 4.48% 3.77% 3.07%
Net Income 8.59%
10.25
% 8.32% 7.01% 5.70%
Paraphrase This Document
Need a fresh take? Get an instant paraphrase of this document with our AI Paraphraser

8
Financial Analysis Project
Vertical Analysis of the Balance Sheet
Current Assets 2014 2015 2016 2017 2018
Cash
14.92
%
18.02
%
20.54
%
16.42
%
14.19
%
Accounts
Receivable
15.23
%
17.30
%
17.17
%
15.97
%
15.10
%
Parts Inventory
12.18
%
13.84
%
13.73
%
12.77
%
12.06
%
WIP Inventory 1.29% 1.03% 0.95% 0.91% 0.90%
Finished Goods
Inventory
17.26
%
21.89
%
20.74
%
19.30
%
18.13
%
Total Current
Assets
60.89
%
72.08
%
73.14
%
65.36
%
60.39
%
Fixed Assets (Net)
34.15
%
18.53
%
18.83
%
27.41
%
33.78
%
Intangible Assets 4.97% 9.38% 8.03% 7.22% 5.83%

9
Financial Analysis Project
Total Assets
100.00
%
100.00
%
100.00
%
100.00
%
100.00
%
Current Liabilities
Accounts Payable
20.30
%
23.07
%
18.66
%
18.14
%
15.71
%
Current Portion of
LT Debt 7.11% 7.78% 8.68% 7.83% 7.89%
Total Current
Liabilities
27.41
%
30.85
%
27.34
%
25.97
%
23.60
%
Long Term Debt
35.53
%
38.91
%
43.39
%
39.17
%
39.44
%
Shareholders'
Equity
37.06
%
30.24
%
29.27
%
34.86
%
36.96
%
Total Liabilities &
Equity
100.00
%
100.00
%
100.00
%
100.00
%
100.00
%
⊘ This is a preview!⊘
Do you want full access?
Subscribe today to unlock all pages.

Trusted by 1+ million students worldwide

10
Financial Analysis Project
Horizontal Analysis
Horizontal Analysis of the Income statement:
Horizontal Analysis of the income statement and the Balance sheet of the company is
one of the major and the very crucial technique used by the company by the company
can determine that the how the company is forming as compared to that of the last
years or that from the company which is taken as the benchmark for the evaluation of
the performance of the company.
In the horizontalanalysis, the comparison is made between the each of the items
presented in the income statement and that of the balance sheet are basically to that
from the past base year.
Horizontal Analysis of the Income Statement
2014 2015 2016 2017 2018
Sales 100.00% 152.66% 304.72% 468.24% 537.75%
COGS 100.00% 135.66% 280.11% 495.70% 577.83%
GP 100.00% 180.15% 344.51% 423.84% 472.93%
Operating Expenses
Selling and Distribution 100.00% 157.12% 302.32% 340.11% 371.52%
Research & Development 100.00% 135.31% 290.50% 408.70% 739.14%
Administration 100.00% 326.66% 776.54% 952.02% 931.91%
Paraphrase This Document
Need a fresh take? Get an instant paraphrase of this document with our AI Paraphraser

11
Financial Analysis Project
Amortization 100.00% 50.42% 130.83% 254.01% 384.48%
Total OPEX 100.00% 168.27% 364.48% 459.40% 555.43%
Operating Income 100.00% 197.20% 315.87% 372.83% 354.58%
Interest 100.00% 173.11% 442.52% 421.47% 519.56%
Earnings Before Taxes 100.00% 201.73% 292.04% 363.67% 323.54%
Taxes 100.00% 201.73% 292.04% 363.68% 323.55%
Net Income 100.00% 201.73% 292.04% 363.67% 323.54%
Horizontal Analysis of the Balance Sheet:
Horizontal Analysis of Balance Sheet
Current Assets 2014 2015 2016 2017 2018
Cash 100 154.46% 362.68% 339.92% 355.03%

12
Financial Analysis Project
%
Accounts Receivable
100
% 139.45% 278.93% 319.13% 374.35%
Parts Inventory
100
% 139.45% 278.93% 319.13% 373.76%
WIP Inventory
100
% 69.30% 148.80% 182.35% 234.37%
Finished Goods Inventory
100
% 167.21% 303.86% 346.83% 402.40%
Total Current Assets
100
% 149.52% 303.77% 329.19% 374.49%
Fixed Assets (Net)
100
% 14.38% 85.36% 220.95% 373.30%
Intangible Assets
100
% 298.10% 443.34% 481.22% 461.33%
Total Assets
100
% 110.76% 236.13% 299.78% 378.40%
⊘ This is a preview!⊘
Do you want full access?
Subscribe today to unlock all pages.

Trusted by 1+ million students worldwide
1 out of 18
Related Documents
Your All-in-One AI-Powered Toolkit for Academic Success.
 +13062052269
info@desklib.com
Available 24*7 on WhatsApp / Email
Unlock your academic potential
Copyright © 2020–2025 A2Z Services. All Rights Reserved. Developed and managed by ZUCOL.


