Advanced Financial Accounting: Analysis of UK Pub Companies' Finances
VerifiedAdded on 2021/09/09
|12
|2799
|65
Report
AI Summary
This report provides a financial analysis of Greene King plc and Young & Co.'s Brewery PLC, both listed on the London Stock Exchange, focusing on their performance in 2018. The analysis includes an in-depth examination of liquidity, debt management, efficiency, and profitability ratios, comparing data from 2017 and 2018 to assess financial trends. The report highlights the companies' strengths and weaknesses based on the ratio analysis, discussing factors that have affected their performance, such as market position, management changes, and compliance with regulations. The report also includes a discussion of the performance factors for each company, including revenue streams, acquisitions, and operational strategies. The report concludes by offering insights into the financial health and performance of each company, drawing conclusions based on the analysis of financial statements and key ratios. The report also acknowledges the limitations of the analysis and the importance of considering non-financial factors that influence the company's performance.
Advanced Financial
Accounting
Assignment
Accounting
Assignment
Paraphrase This Document
Need a fresh take? Get an instant paraphrase of this document with our AI Paraphraser
1
By student name
Professor
University
Date: 25 April 2018.
1 | P a g e
By student name
Professor
University
Date: 25 April 2018.
1 | P a g e
2
Contents
Introduction.................................................................................................................................................3
Discussion and Analysis...............................................................................................................................4
Performance Factors...................................................................................................................................9
References.................................................................................................................................................10
2 | P a g e
⊘ This is a preview!⊘
Do you want full access?
Subscribe today to unlock all pages.
Trusted by 1+ million students worldwide
3
Introduction
A report has been prepared on the financial analysis of the two companies listed on the London stock
exchange. The report highlights as to how the annual report of the companies meets the expectations of
the corporate stakeholders (Boccia & Leonardi, 2016). The year of analysis chosen in the report is 2018.
An in-depth ratio analysis has been done using 10 critical and significant ratios of the company, which
shows the financial status, and performance of the company from the viewpoints of various parties like
those of management, investors and lenders. A year-to-year comparison also helps in knowing if the
company has progressed or declined in terms of progress. The last section of the report discusses the
financial and non-financial factors that have affected the performance of the companies. The limitation
of the report is that it covers the financial and non-financial analysis of the company from the
perspective of the annual report, it does not focuses on many other areas of interest like those of
internal control, processes, market stability, etc. (Choy, 2018).
The two companies, which has been considered for analysis is Greene King plc and Young & Co's
Brewery PLC. Green King PLC is one of the largest pub retailer and brewer in United Kingdom. It is based
out of Bury St Edmunds, Suffolk, England and the company owns a number of hotels, pubs and
restaurants with the total number over 3100. It is listed on London Stock Exchange and is a major
constituent of FTSE 250 Index. It was formed back in 1799 and grown multiple times by the way of
mergers and acquisitions. It runs various apprentice and hospitality programme in order to address the
skill and the experience gap of those who are unemployed and has more than 9000 registrations until
date (Alexander, 2016). Some of the programmes are Greene King Apprenticeship Programme and Get
into Hospitality Programme. On the other hand, Young & Co.'s Brewery Plc is another pub chain
company again operating in United Kingdom with 220 pubs. It was established in 1831 and in the
company 40% stake is being held by Young & Co and Charles Wells own 60% stake. This company again
has had a number of major acquisitions, which puts it third on the list of premium ale brewery in the UK
(Chron, 2017).
3 | P a g e
Paraphrase This Document
Need a fresh take? Get an instant paraphrase of this document with our AI Paraphraser
4
Discussion and Analysis
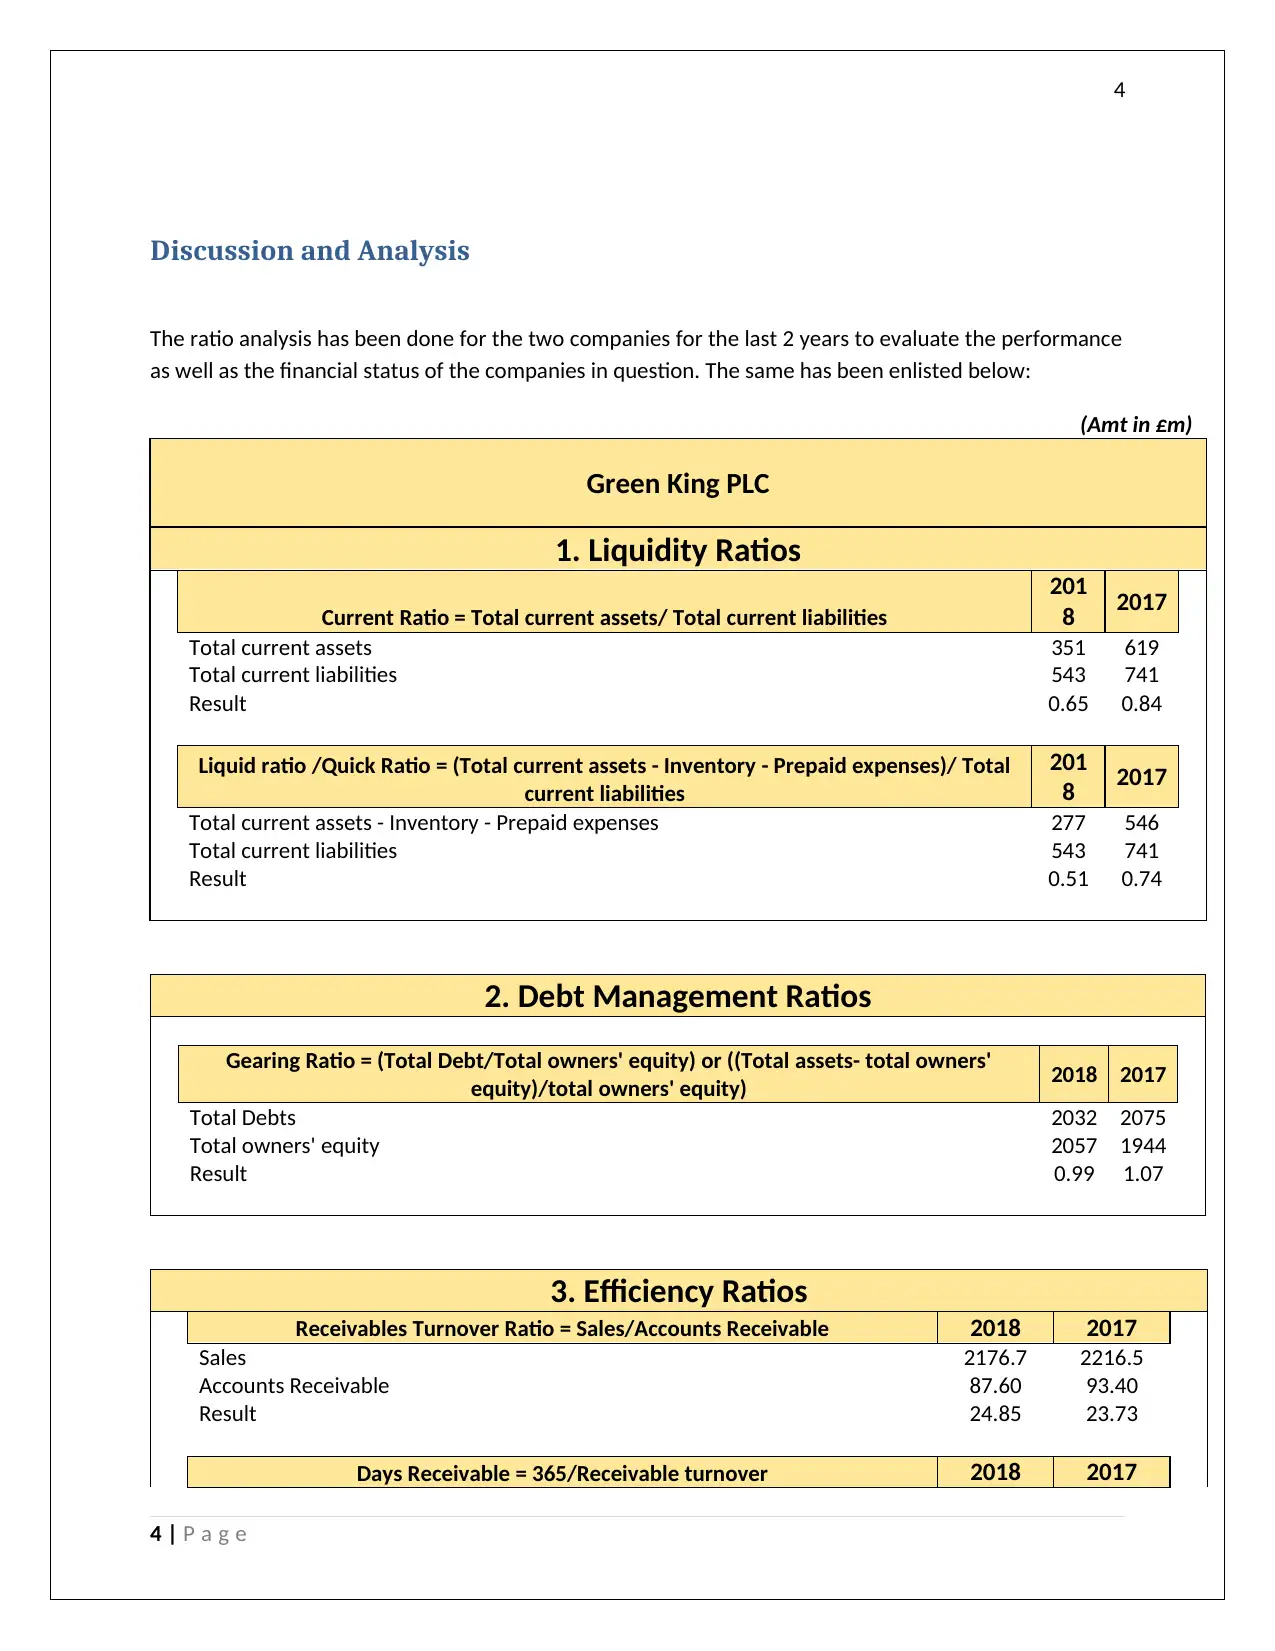
The ratio analysis has been done for the two companies for the last 2 years to evaluate the performance
as well as the financial status of the companies in question. The same has been enlisted below:
(Amt in £m)
Green King PLC
1. Liquidity Ratios
Current Ratio = Total current assets/ Total current liabilities
201
8 2017
Total current assets 351 619
Total current liabilities 543 741
Result 0.65 0.84
Liquid ratio /Quick Ratio = (Total current assets - Inventory - Prepaid expenses)/ Total
current liabilities
201
8 2017
Total current assets - Inventory - Prepaid expenses 277 546
Total current liabilities 543 741
Result 0.51 0.74
2. Debt Management Ratios
Gearing Ratio = (Total Debt/Total owners' equity) or ((Total assets- total owners'
equity)/total owners' equity) 2018 2017
Total Debts 2032 2075
Total owners' equity 2057 1944
Result 0.99 1.07
3. Efficiency Ratios
Receivables Turnover Ratio = Sales/Accounts Receivable 2018 2017
Sales 2176.7 2216.5
Accounts Receivable 87.60 93.40
Result 24.85 23.73
Days Receivable = 365/Receivable turnover 2018 2017
4 | P a g e
Discussion and Analysis
The ratio analysis has been done for the two companies for the last 2 years to evaluate the performance
as well as the financial status of the companies in question. The same has been enlisted below:
(Amt in £m)
Green King PLC
1. Liquidity Ratios
Current Ratio = Total current assets/ Total current liabilities
201
8 2017
Total current assets 351 619
Total current liabilities 543 741
Result 0.65 0.84
Liquid ratio /Quick Ratio = (Total current assets - Inventory - Prepaid expenses)/ Total
current liabilities
201
8 2017
Total current assets - Inventory - Prepaid expenses 277 546
Total current liabilities 543 741
Result 0.51 0.74
2. Debt Management Ratios
Gearing Ratio = (Total Debt/Total owners' equity) or ((Total assets- total owners'
equity)/total owners' equity) 2018 2017
Total Debts 2032 2075
Total owners' equity 2057 1944
Result 0.99 1.07
3. Efficiency Ratios
Receivables Turnover Ratio = Sales/Accounts Receivable 2018 2017
Sales 2176.7 2216.5
Accounts Receivable 87.60 93.40
Result 24.85 23.73
Days Receivable = 365/Receivable turnover 2018 2017
4 | P a g e
5
No. of days 365 365
Receivable turnover 24.85 23.73
Result 14.69 15.38
Inventory Turnover = COGS/Inventory 2018 2017
COGS 743 769.7
Inventory 47.70 45.00
Result 15.58 17.10
Payables Turnover Ratio = COGS/Accounts Payables 2018 2017
COGS 743 769.7
Accounts Payables 421.80 431.20
Result 1.76 1.79
Days Payables = 365/Payables turnover 2018 2017
No. of days 365 365
Payables Turnover 1.76 1.79
Result 207.21 204.48
4. Profitability ratios
Gross Profit ratio = Gross Profit / Sales 2018 2017
Gross Profit 1433.7 1446.8
Sales 2,176.70 2,216.50
Result 65.9% 65.3%
Net Profit ratio = Net Profit / Sales 2018 2017
Net Profit 162.5 151.7
Sales 2,176.70 2,216.50
Result 7.5% 6.8%
Return on capital employed = Net income/total capital 2018 2017
Operating profit before exceptional and non-underlying items 373.1 411.5
Average Capital Employed 4,395.30 4,396.60
Result 8.5% 9.4%
Earnings per share = Net earnings for equity shareholders / No. of Equity shares 2018 2017
Result 62.7p 70.8p
From the above ratio analysis of Green King PLC, we can see that the company has current ratio of 0.65
times in 2018 which has dropped from 0.84 in 2017 (Linden & Freeman, 2017). The quick ratio or the
liquid ratio has also dropped from 0.74 times to 0.51 times in 2018. Both these ratios are the measure of
5 | P a g e
No. of days 365 365
Receivable turnover 24.85 23.73
Result 14.69 15.38
Inventory Turnover = COGS/Inventory 2018 2017
COGS 743 769.7
Inventory 47.70 45.00
Result 15.58 17.10
Payables Turnover Ratio = COGS/Accounts Payables 2018 2017
COGS 743 769.7
Accounts Payables 421.80 431.20
Result 1.76 1.79
Days Payables = 365/Payables turnover 2018 2017
No. of days 365 365
Payables Turnover 1.76 1.79
Result 207.21 204.48
4. Profitability ratios
Gross Profit ratio = Gross Profit / Sales 2018 2017
Gross Profit 1433.7 1446.8
Sales 2,176.70 2,216.50
Result 65.9% 65.3%
Net Profit ratio = Net Profit / Sales 2018 2017
Net Profit 162.5 151.7
Sales 2,176.70 2,216.50
Result 7.5% 6.8%
Return on capital employed = Net income/total capital 2018 2017
Operating profit before exceptional and non-underlying items 373.1 411.5
Average Capital Employed 4,395.30 4,396.60
Result 8.5% 9.4%
Earnings per share = Net earnings for equity shareholders / No. of Equity shares 2018 2017
Result 62.7p 70.8p
From the above ratio analysis of Green King PLC, we can see that the company has current ratio of 0.65
times in 2018 which has dropped from 0.84 in 2017 (Linden & Freeman, 2017). The quick ratio or the
liquid ratio has also dropped from 0.74 times to 0.51 times in 2018. Both these ratios are the measure of
5 | P a g e
⊘ This is a preview!⊘
Do you want full access?
Subscribe today to unlock all pages.
Trusted by 1+ million students worldwide
6
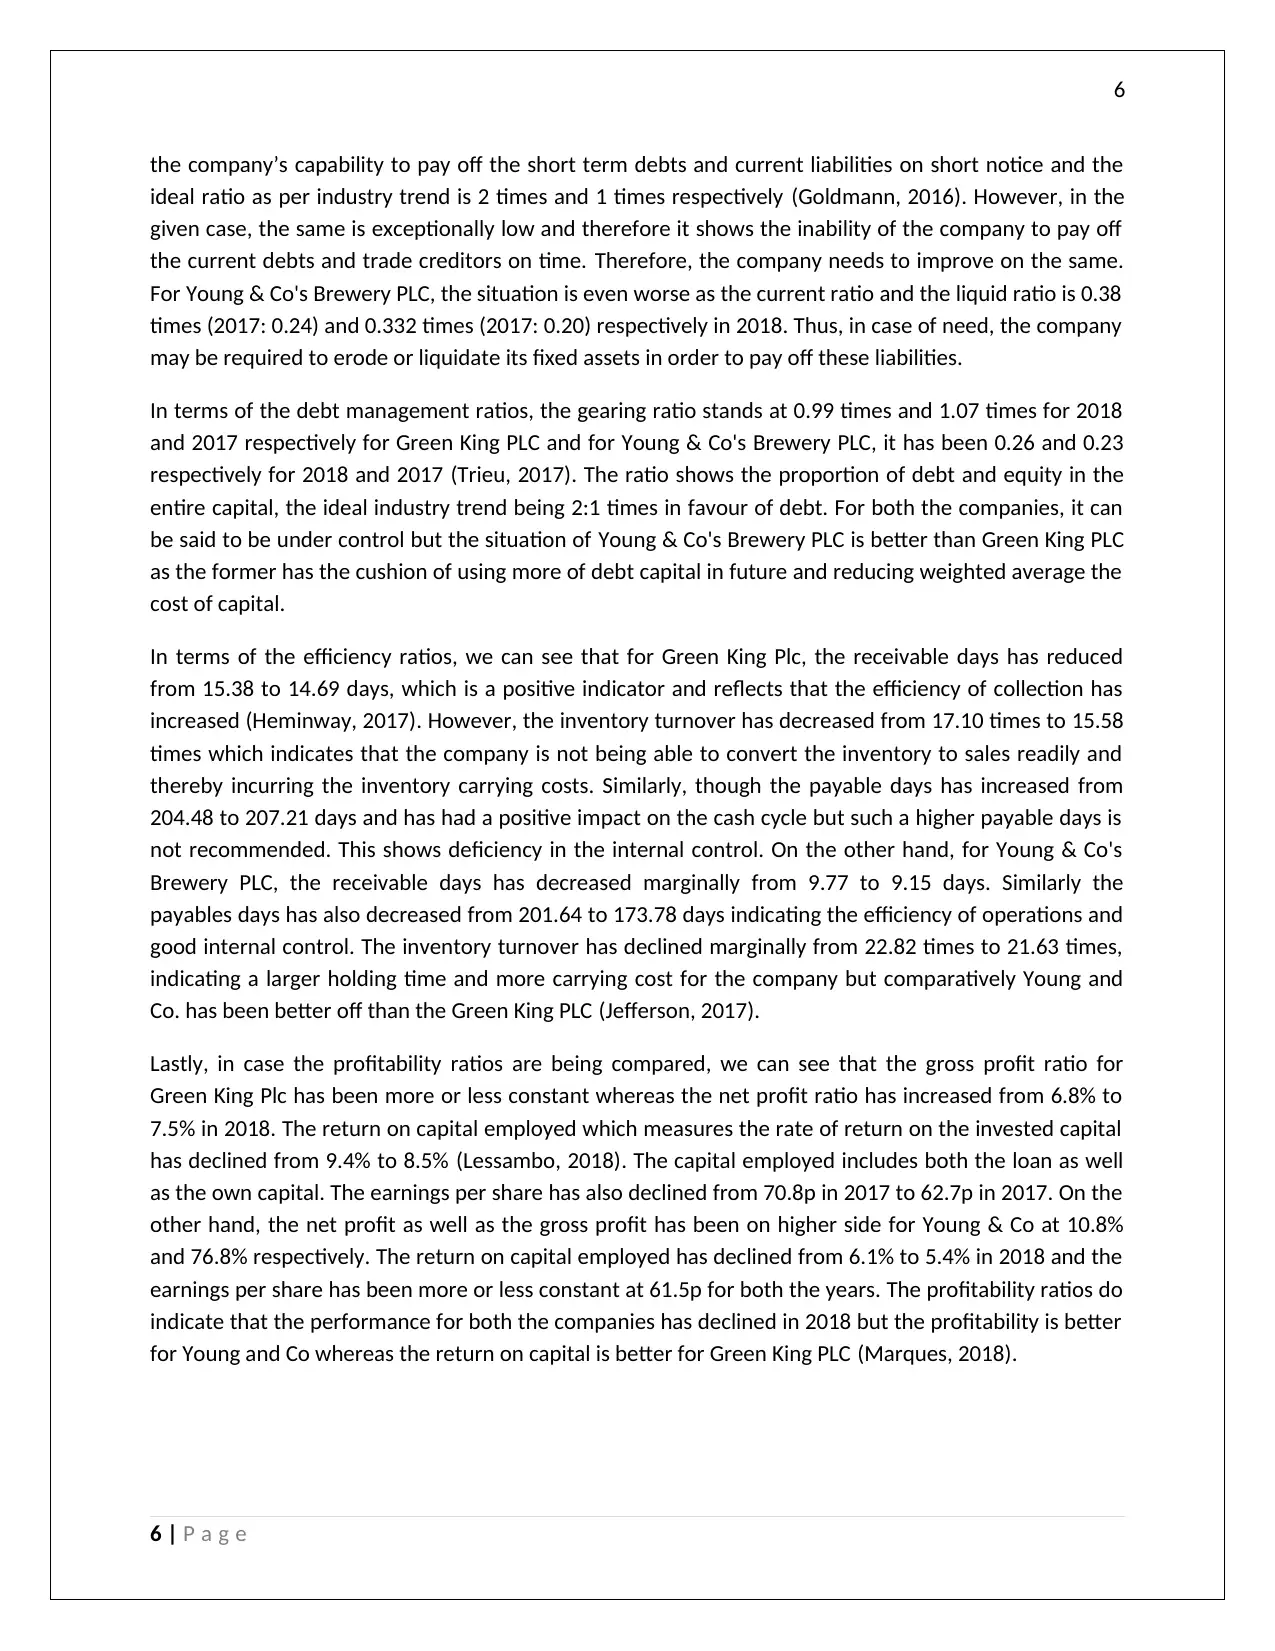
the company’s capability to pay off the short term debts and current liabilities on short notice and the
ideal ratio as per industry trend is 2 times and 1 times respectively (Goldmann, 2016). However, in the
given case, the same is exceptionally low and therefore it shows the inability of the company to pay off
the current debts and trade creditors on time. Therefore, the company needs to improve on the same.
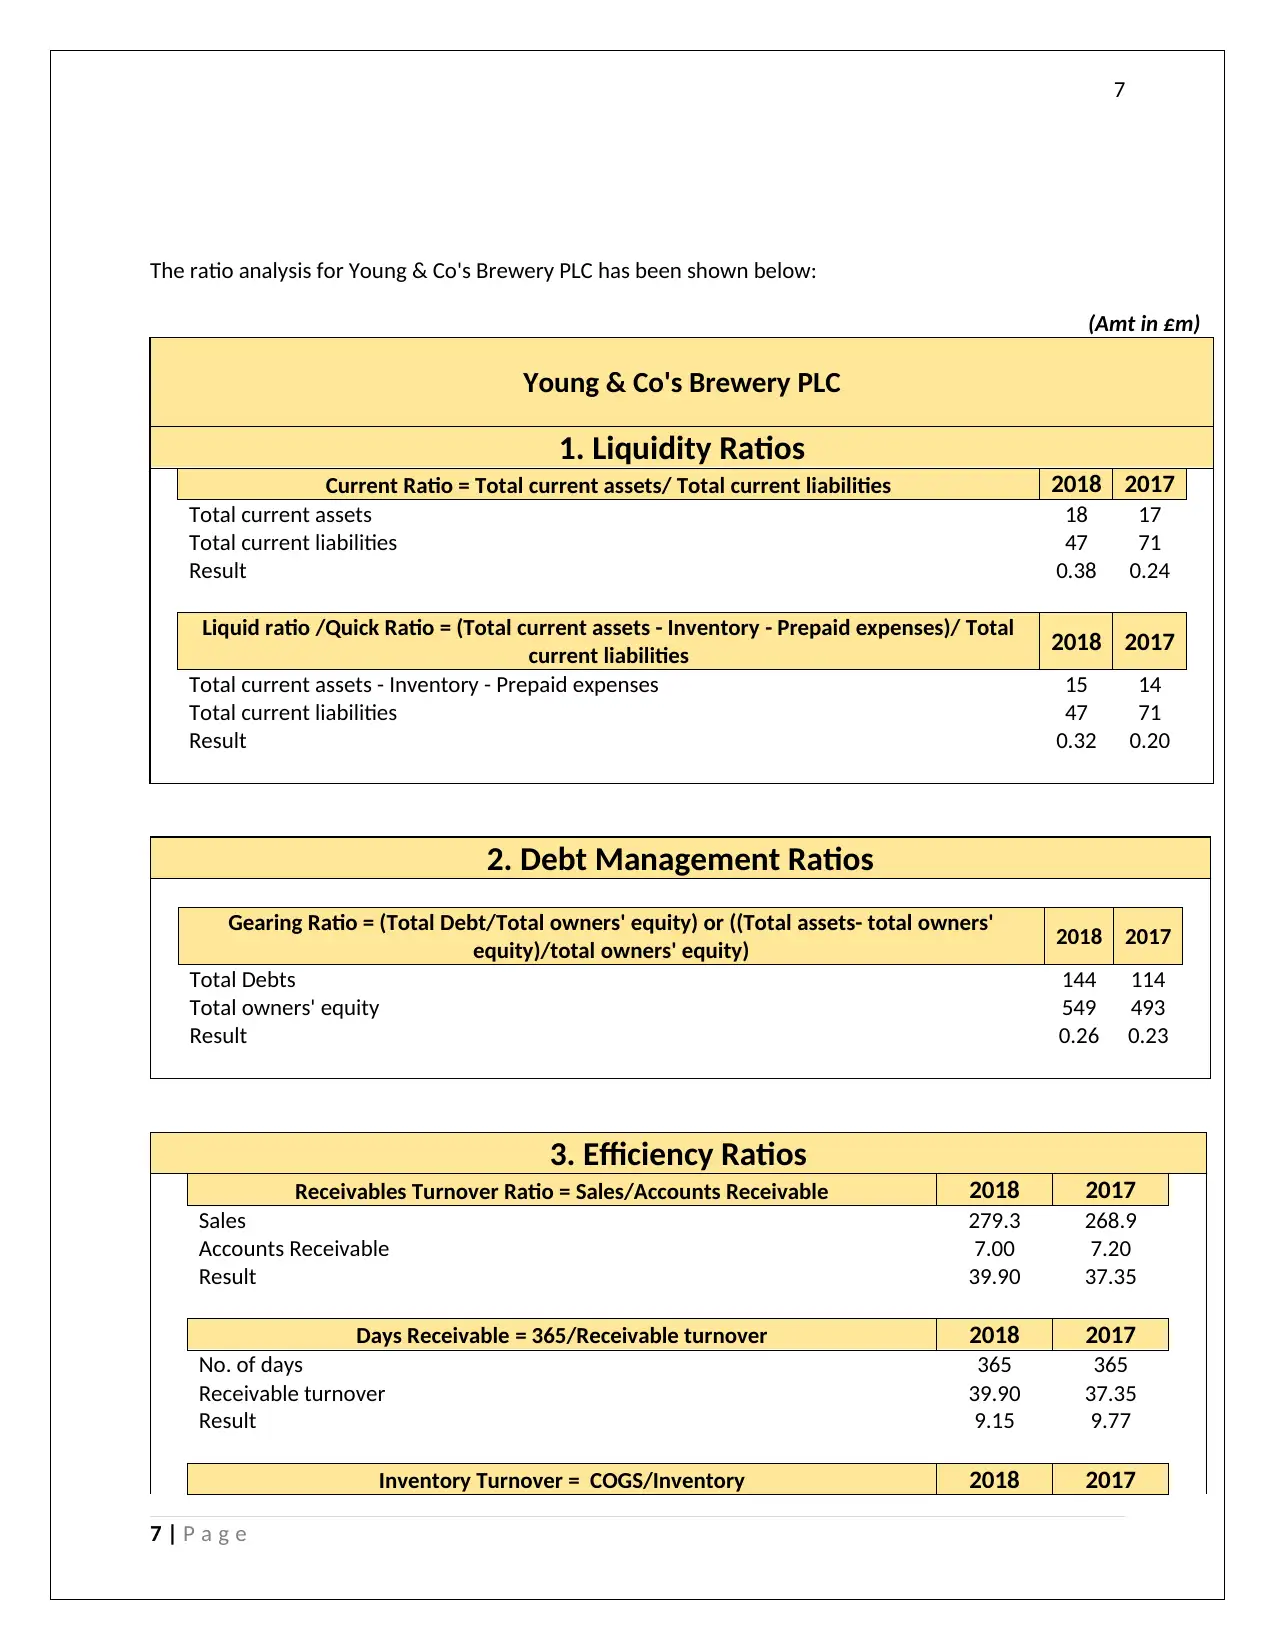
For Young & Co's Brewery PLC, the situation is even worse as the current ratio and the liquid ratio is 0.38
times (2017: 0.24) and 0.332 times (2017: 0.20) respectively in 2018. Thus, in case of need, the company
may be required to erode or liquidate its fixed assets in order to pay off these liabilities.
In terms of the debt management ratios, the gearing ratio stands at 0.99 times and 1.07 times for 2018
and 2017 respectively for Green King PLC and for Young & Co's Brewery PLC, it has been 0.26 and 0.23
respectively for 2018 and 2017 (Trieu, 2017). The ratio shows the proportion of debt and equity in the
entire capital, the ideal industry trend being 2:1 times in favour of debt. For both the companies, it can
be said to be under control but the situation of Young & Co's Brewery PLC is better than Green King PLC
as the former has the cushion of using more of debt capital in future and reducing weighted average the
cost of capital.
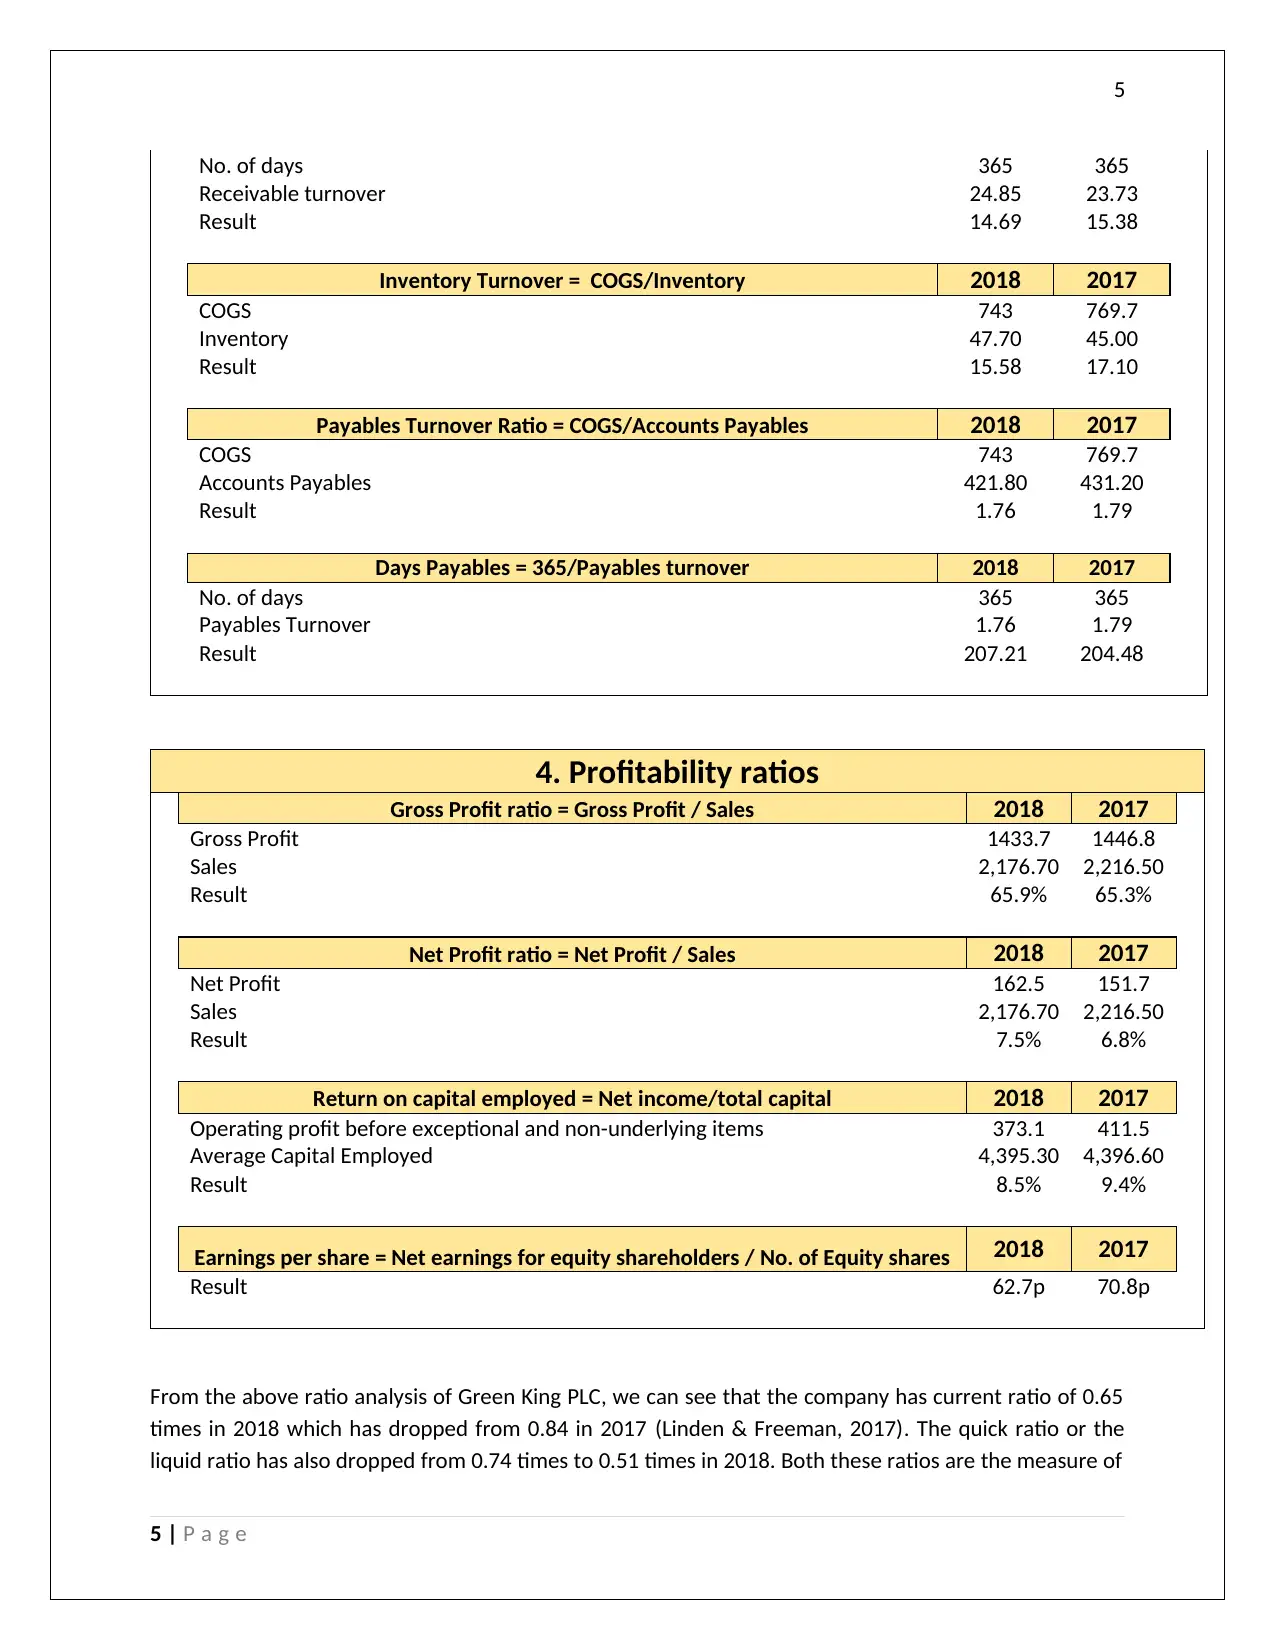
In terms of the efficiency ratios, we can see that for Green King Plc, the receivable days has reduced
from 15.38 to 14.69 days, which is a positive indicator and reflects that the efficiency of collection has
increased (Heminway, 2017). However, the inventory turnover has decreased from 17.10 times to 15.58
times which indicates that the company is not being able to convert the inventory to sales readily and
thereby incurring the inventory carrying costs. Similarly, though the payable days has increased from
204.48 to 207.21 days and has had a positive impact on the cash cycle but such a higher payable days is
not recommended. This shows deficiency in the internal control. On the other hand, for Young & Co's
Brewery PLC, the receivable days has decreased marginally from 9.77 to 9.15 days. Similarly the
payables days has also decreased from 201.64 to 173.78 days indicating the efficiency of operations and
good internal control. The inventory turnover has declined marginally from 22.82 times to 21.63 times,
indicating a larger holding time and more carrying cost for the company but comparatively Young and
Co. has been better off than the Green King PLC (Jefferson, 2017).
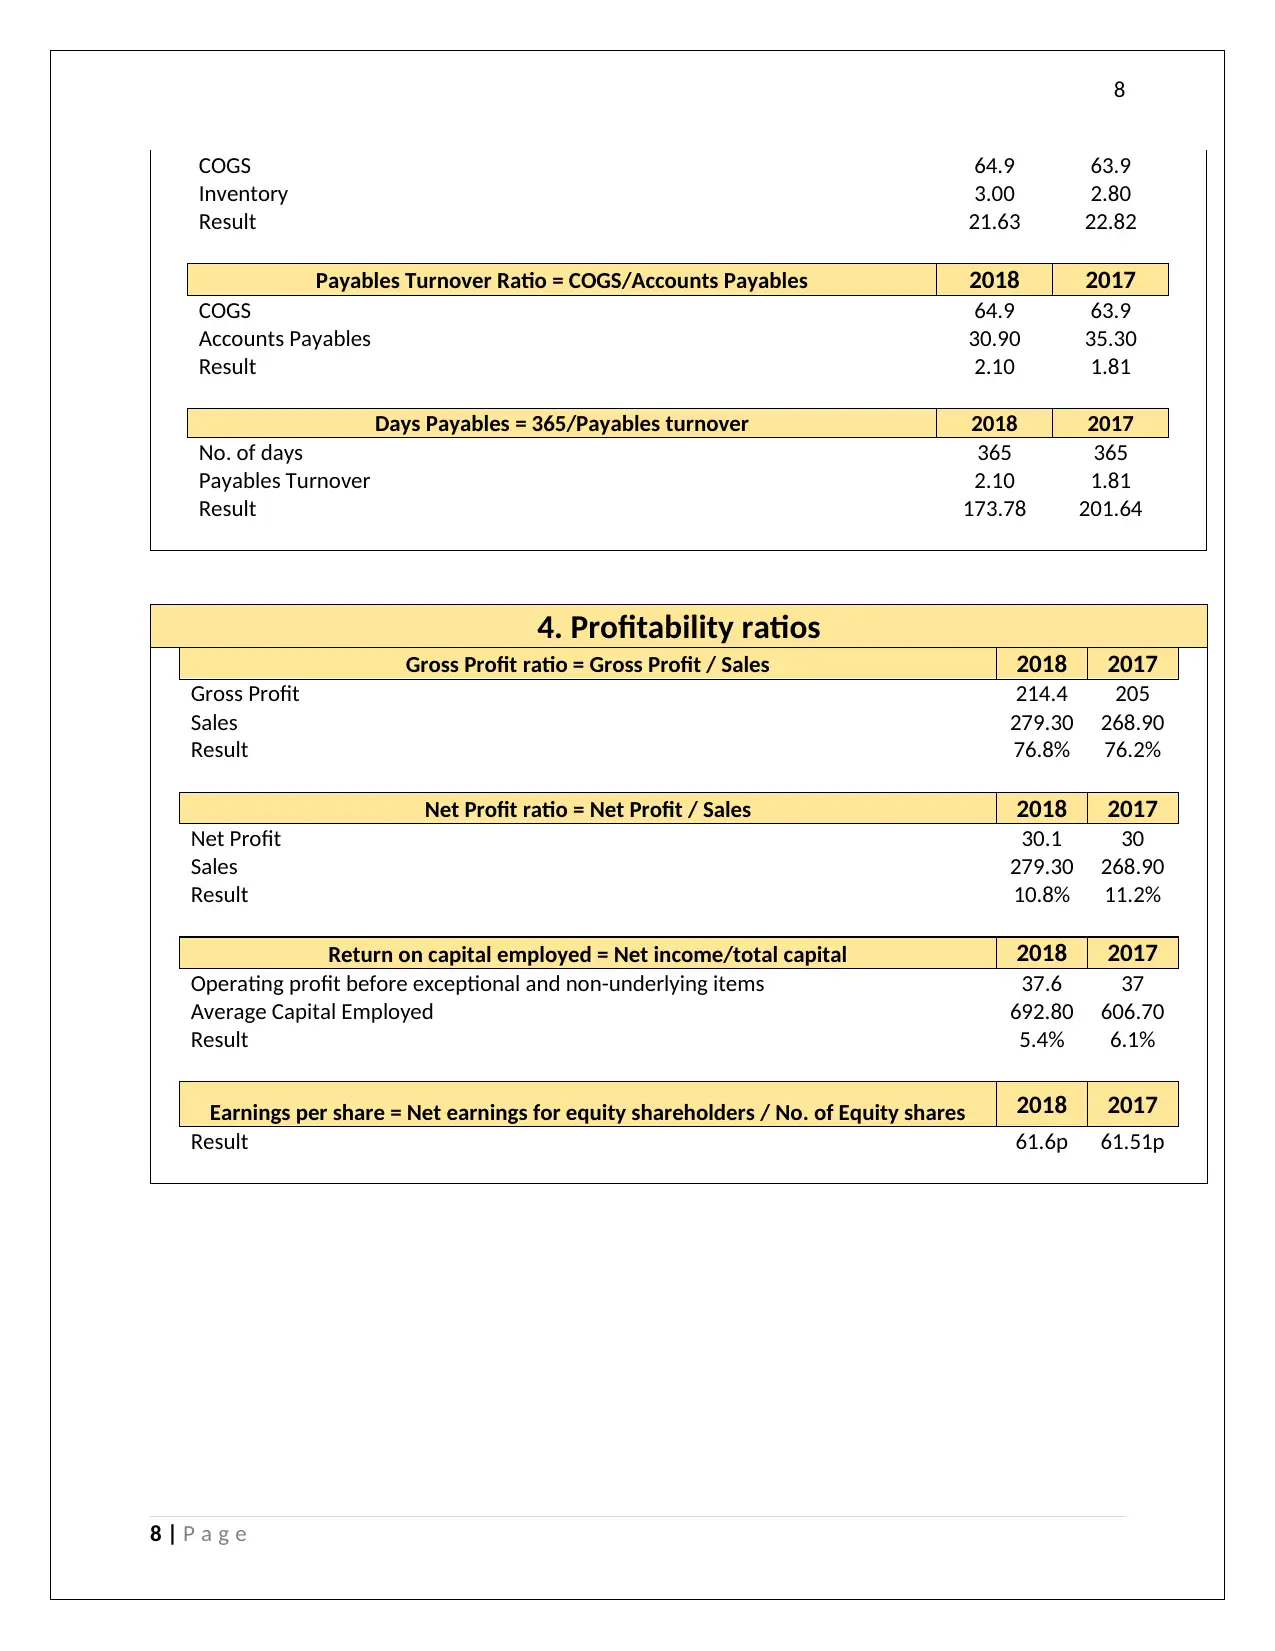
Lastly, in case the profitability ratios are being compared, we can see that the gross profit ratio for
Green King Plc has been more or less constant whereas the net profit ratio has increased from 6.8% to
7.5% in 2018. The return on capital employed which measures the rate of return on the invested capital
has declined from 9.4% to 8.5% (Lessambo, 2018). The capital employed includes both the loan as well
as the own capital. The earnings per share has also declined from 70.8p in 2017 to 62.7p in 2017. On the
other hand, the net profit as well as the gross profit has been on higher side for Young & Co at 10.8%
and 76.8% respectively. The return on capital employed has declined from 6.1% to 5.4% in 2018 and the
earnings per share has been more or less constant at 61.5p for both the years. The profitability ratios do
indicate that the performance for both the companies has declined in 2018 but the profitability is better
for Young and Co whereas the return on capital is better for Green King PLC (Marques, 2018).
6 | P a g e
the company’s capability to pay off the short term debts and current liabilities on short notice and the
ideal ratio as per industry trend is 2 times and 1 times respectively (Goldmann, 2016). However, in the
given case, the same is exceptionally low and therefore it shows the inability of the company to pay off
the current debts and trade creditors on time. Therefore, the company needs to improve on the same.
For Young & Co's Brewery PLC, the situation is even worse as the current ratio and the liquid ratio is 0.38
times (2017: 0.24) and 0.332 times (2017: 0.20) respectively in 2018. Thus, in case of need, the company
may be required to erode or liquidate its fixed assets in order to pay off these liabilities.
In terms of the debt management ratios, the gearing ratio stands at 0.99 times and 1.07 times for 2018
and 2017 respectively for Green King PLC and for Young & Co's Brewery PLC, it has been 0.26 and 0.23
respectively for 2018 and 2017 (Trieu, 2017). The ratio shows the proportion of debt and equity in the
entire capital, the ideal industry trend being 2:1 times in favour of debt. For both the companies, it can
be said to be under control but the situation of Young & Co's Brewery PLC is better than Green King PLC
as the former has the cushion of using more of debt capital in future and reducing weighted average the
cost of capital.
In terms of the efficiency ratios, we can see that for Green King Plc, the receivable days has reduced
from 15.38 to 14.69 days, which is a positive indicator and reflects that the efficiency of collection has
increased (Heminway, 2017). However, the inventory turnover has decreased from 17.10 times to 15.58
times which indicates that the company is not being able to convert the inventory to sales readily and
thereby incurring the inventory carrying costs. Similarly, though the payable days has increased from
204.48 to 207.21 days and has had a positive impact on the cash cycle but such a higher payable days is
not recommended. This shows deficiency in the internal control. On the other hand, for Young & Co's
Brewery PLC, the receivable days has decreased marginally from 9.77 to 9.15 days. Similarly the
payables days has also decreased from 201.64 to 173.78 days indicating the efficiency of operations and
good internal control. The inventory turnover has declined marginally from 22.82 times to 21.63 times,
indicating a larger holding time and more carrying cost for the company but comparatively Young and
Co. has been better off than the Green King PLC (Jefferson, 2017).
Lastly, in case the profitability ratios are being compared, we can see that the gross profit ratio for
Green King Plc has been more or less constant whereas the net profit ratio has increased from 6.8% to
7.5% in 2018. The return on capital employed which measures the rate of return on the invested capital
has declined from 9.4% to 8.5% (Lessambo, 2018). The capital employed includes both the loan as well
as the own capital. The earnings per share has also declined from 70.8p in 2017 to 62.7p in 2017. On the
other hand, the net profit as well as the gross profit has been on higher side for Young & Co at 10.8%
and 76.8% respectively. The return on capital employed has declined from 6.1% to 5.4% in 2018 and the
earnings per share has been more or less constant at 61.5p for both the years. The profitability ratios do
indicate that the performance for both the companies has declined in 2018 but the profitability is better
for Young and Co whereas the return on capital is better for Green King PLC (Marques, 2018).
6 | P a g e
Paraphrase This Document
Need a fresh take? Get an instant paraphrase of this document with our AI Paraphraser
7
The ratio analysis for Young & Co's Brewery PLC has been shown below:
(Amt in £m)
Young & Co's Brewery PLC
1. Liquidity Ratios
Current Ratio = Total current assets/ Total current liabilities 2018 2017
Total current assets 18 17
Total current liabilities 47 71
Result 0.38 0.24
Liquid ratio /Quick Ratio = (Total current assets - Inventory - Prepaid expenses)/ Total
current liabilities 2018 2017
Total current assets - Inventory - Prepaid expenses 15 14
Total current liabilities 47 71
Result 0.32 0.20
2. Debt Management Ratios
Gearing Ratio = (Total Debt/Total owners' equity) or ((Total assets- total owners'
equity)/total owners' equity) 2018 2017
Total Debts 144 114
Total owners' equity 549 493
Result 0.26 0.23
3. Efficiency Ratios
Receivables Turnover Ratio = Sales/Accounts Receivable 2018 2017
Sales 279.3 268.9
Accounts Receivable 7.00 7.20
Result 39.90 37.35
Days Receivable = 365/Receivable turnover 2018 2017
No. of days 365 365
Receivable turnover 39.90 37.35
Result 9.15 9.77
Inventory Turnover = COGS/Inventory 2018 2017
7 | P a g e
8
COGS 64.9 63.9
Inventory 3.00 2.80
Result 21.63 22.82
Payables Turnover Ratio = COGS/Accounts Payables 2018 2017
COGS 64.9 63.9
Accounts Payables 30.90 35.30
Result 2.10 1.81
Days Payables = 365/Payables turnover 2018 2017
No. of days 365 365
Payables Turnover 2.10 1.81
Result 173.78 201.64
4. Profitability ratios
Gross Profit ratio = Gross Profit / Sales 2018 2017
Gross Profit 214.4 205
Sales 279.30 268.90
Result 76.8% 76.2%
Net Profit ratio = Net Profit / Sales 2018 2017
Net Profit 30.1 30
Sales 279.30 268.90
Result 10.8% 11.2%
Return on capital employed = Net income/total capital 2018 2017
Operating profit before exceptional and non-underlying items 37.6 37
Average Capital Employed 692.80 606.70
Result 5.4% 6.1%
Earnings per share = Net earnings for equity shareholders / No. of Equity shares 2018 2017
Result 61.6p 61.51p
8 | P a g e
COGS 64.9 63.9
Inventory 3.00 2.80
Result 21.63 22.82
Payables Turnover Ratio = COGS/Accounts Payables 2018 2017
COGS 64.9 63.9
Accounts Payables 30.90 35.30
Result 2.10 1.81
Days Payables = 365/Payables turnover 2018 2017
No. of days 365 365
Payables Turnover 2.10 1.81
Result 173.78 201.64
4. Profitability ratios
Gross Profit ratio = Gross Profit / Sales 2018 2017
Gross Profit 214.4 205
Sales 279.30 268.90
Result 76.8% 76.2%
Net Profit ratio = Net Profit / Sales 2018 2017
Net Profit 30.1 30
Sales 279.30 268.90
Result 10.8% 11.2%
Return on capital employed = Net income/total capital 2018 2017
Operating profit before exceptional and non-underlying items 37.6 37
Average Capital Employed 692.80 606.70
Result 5.4% 6.1%
Earnings per share = Net earnings for equity shareholders / No. of Equity shares 2018 2017
Result 61.6p 61.51p
8 | P a g e
⊘ This is a preview!⊘
Do you want full access?
Subscribe today to unlock all pages.
Trusted by 1+ million students worldwide
9
Performance Factors
In case of the Young and Co., the company is divided into several segments as if Young’s managed
houses; Geronimo managed houses and Ram Pub Company. Revenue generally comes from food, drink
and accommodation whereas the Ram Pub Company generates revenue by leasing the pubs to third
parties. The company has had a major change in the management due to the merger and acquisition
over the past few years and off late the company has stabilized (Kew & Stredwick, 2017). Besides this, as
per the annual report, sustainability report and the audit report of the company, it can be mentioned
that the company has complied with all the rules and regulations, accounting standards and the legal
requirements while preparing the books of accounts. However, the company’s valuation policy,
computation of deferred tax and the supplier rebates and revenue recognition criteria were all
challenged and it was seen that the company has adequate back up of the same (Kachelmeier, et al.,
2018). In addition, the company has been contributing to the corporate governance and has made
adequate disclosures in this regard.
On the other hand, Green King PLC has been the market leader off late in UK because of the synergies in
investment and acquisitions. The focus of the company has been on cost mitigation programmes and
strengthen the capital structure, improve the underlying sales (Sithole, et al., 2017). The company has
also been compliant in terms of corporate governance and sustainability and has come up with various
programmes and incentives for the betterment of the company as well its human resource. In terms of
auditor opinion in audit report, the company has complied and followed all the rules, regulations,
accounting standards and the legal requirements as therefore the auditors have issued a clear opinion
and mentioned the entity as going concern (Raiborn, et al., 2016). The auditor did identify few of the
risks in the financial statements like those of capital expenditure accounting, impairment calculations of
property, plant and equipment, revenue recognition, etc. bit post the additional audit procedures by the
auditors, all these were found to be justifiable.
9 | P a g e
Paraphrase This Document
Need a fresh take? Get an instant paraphrase of this document with our AI Paraphraser
10
References
Alexander, F., 2016. The Changing Face of Accountability. The Journal of Higher Education, 71(4), pp.
411-431.
Boccia, F. & Leonardi, R., 2016. The Challenge of the Digital Economy. Markets, Taxation and
Appropriate Economic Models, pp. 1-16.
Choy, Y. K., 2018. Cost-benefit Analysis, Values, Wellbeing and Ethics: An Indigenous Worldview Analysis.
Ecological Economics, p. 145.
Chron, 2017. five-common-features-internal-control-system-business. [Online]
Available at: http://smallbusiness.chron.com/five-common-features-internal-control-system-business-
430.html
Goldmann, K., 2016. Financial Liquidity and Profitability Management in Practice of Polish Business.
Financial Environment and Business Development, 4(3), pp. 103-112.
Heminway, J., 2017. Shareholder Wealth Maximization as a Function of Statutes, Decisional Law, and
Organic Documents. SSRN, pp. 1-35.
Jefferson, M., 2017. Energy, Complexity and Wealth Maximization, R. Ayres. Springer, Switzerland.
Technological Forecasting and Social Change, pp. 353-354.
Kachelmeier, S., Schmidt, J. & Valentine, K., 2018. The disclaimer effect of disclosing critical audit
matters in the auditor’s report. SSRN, 2(1), pp. 1-39.
Kew, J. & Stredwick, J., 2017. Business Environment: Managing in a Strategic Context. second ed.
London: Chartered Institute of Personnel and Development.
Lessambo, F., 2018. Audit Risks: Identification and Procedures. Auditing, Assurance Services, and
Forensics, 3(1), pp. 183-202.
Linden, B. & Freeman, R., 2017. Profit and Other Values: Thick Evaluation in Decision Making. Business
Ethics Quarterly, 27(3), pp. 353-379.
10 | P a g e
11
Marques, R. P. F., 2018. Continuous Assurance and the Use of Technology for Business Compliance.
Encyclopedia of Information Science and Technology, pp. 820-830.
Raiborn, C., Butler, J. & Martin, K., 2016. The internal audit function: A prerequisite for Good
Governance. Journal of Corporate Accounting and Finance, 28(2), pp. 10-21.
Sithole, S., Chandler, P., Abeysekera, I. & Paas, F., 2017. Benefits of guided self-management of attention
on learning accounting. Journal of Educational Psychology, 109(2), p. 220.
Trieu, V., 2017. Getting value from Business Intelligence systems: A review and research agenda.
Decision Support Systems, 93(1), pp. 111-124.
11 | P a g e
⊘ This is a preview!⊘
Do you want full access?
Subscribe today to unlock all pages.
Trusted by 1+ million students worldwide
1 out of 12
Related Documents


Your All-in-One AI-Powered Toolkit for Academic Success.
+13062052269
info@desklib.com
Available 24*7 on WhatsApp / Email
![[object Object]](/_next/static/media/star-bottom.7253800d.svg)
Unlock your academic potential
Copyright © 2020–2026 A2Z Services. All Rights Reserved. Developed and managed by ZUCOL.