Financial Ratio Analysis of PUMA and ADIDAS: A Comparative Study
VerifiedAdded on 2021/06/08
|24
|5291
|140
Report
AI Summary
This report provides a detailed financial analysis of the sportswear companies PUMA and ADIDAS, comparing their performance through various financial ratios. The analysis covers liquidity ratios (current ratio, quick ratio), asset management ratios (inventory turnover, days sales outstanding, fixed assets turnover, total assets turnover), and debt management ratios (total debt to capital, time interest earned). The report examines the companies' financial positions in 2019 and 2020, offering insights into their asset and liability management, capital structure, and overall financial health. The study aims to inform about the sportswear market and its characteristics, understanding how these corporations manage their assets, liabilities, capital, and investments by working on their financial reports. The comparison highlights differences in their financial strategies and the impact of globalization on the sports footwear industry, providing a comprehensive overview of their financial strengths and weaknesses.
SNHU 19E1
FINANCIAL ANALYSIS PAPER
PUMA and ADIDAS
PHẠM KHÁNH LINH – NGUYỄN PHƯƠNG ANH – NGUYỄN THỊ NGỌC LIÊN – TRẦN THỊ HỢP
3/5/2021
[This document is used for Fundamental of Finance Assignment]
FINANCIAL ANALYSIS PAPER
PUMA and ADIDAS
PHẠM KHÁNH LINH – NGUYỄN PHƯƠNG ANH – NGUYỄN THỊ NGỌC LIÊN – TRẦN THỊ HỢP
3/5/2021
[This document is used for Fundamental of Finance Assignment]
Paraphrase This Document
Need a fresh take? Get an instant paraphrase of this document with our AI Paraphraser
1 | P a g e
AN ANALYSIS OF PUMA AND ADIDAS
FINANCIAL RATIOS
Table of contents
A. Sportswear Industry
B. Financial Ratios
C. Stock Price
D. Conclusions
E. Appendix
AN ANALYSIS OF PUMA AND ADIDAS
FINANCIAL RATIOS
Table of contents
A. Sportswear Industry
B. Financial Ratios
C. Stock Price
D. Conclusions
E. Appendix
2 | P a g e
A. SPORTSWEAR INDUSTRY:
The European sportswear industry, one of the biggest blocs, comprises over 21,000 companies that
employ 278,000 employees, generating €27.5 billion in turnover annually. European Confederation of the
Footwear Industry (CEC) chairman Luis Onofre asserts, “The fact that nine European countries rank
among the top 15 world exporters is a clear indicator of the success of European footwear products at the
global level.”
The dynamics and buying preferences to a certain extent are singular and peculiar to each market block.
In Europe, the “quality” factor is almost a leitmotif, and personalized and differentiated footwear has been
in high-demand for quite some time now.
German footwear market is also inherited characteristics of its bloc.
The two major sportswear and sports footwear industries in Germany are Adidas and Puma. These two
were owned by brothers Adolf Dassler and Rudolf Dassler where after the relationship between the
brothers deteriorated they decided to part ways in business, Adolf went on to open Adidas while Rudolf
established Puma. These two companies compete with each other internationally and are the most vibrant
current trend setters in the industry in Germany.
Globalization, as in any other industry the world over, has definitely impacted the sports footwear
industry in Germany. Leading companies in the production of sports footwear have been forced to
relocate internationally to take advantage of key opportunities internationally.
Globalization helps a firm to spread political and economic risk whereby, joint ventures have become
widespread as a way of meeting the need to tap the international market, technological knowledge, design
and skills.
Some of the major competitors of Adidas and Puma such as Nike relocated to countries in Asia such as
Thailand and China exclusively because of low labor cost in these countries comparative to those of
firm’s country of origin.
This has translated to low operating costs for these firms hence they are able to lower the price of their
products comparative to that of its competitors which in turn has given such firms an extra edge over their
competitors in terms of pricing. This means that such companies will chip away at some of Germanys’
leading producers of sportswear market share.
⊘ This is a preview!⊘
Do you want full access?
Subscribe today to unlock all pages.
Trusted by 1+ million students worldwide
3 | P a g e
Entry barriers into the sportswear market are relatively few. This scenario has led many investors trying
their luck in the lucrative sports footwear industry.
Consequently, the market has become fragmented due to a lot of competitors entering the industry and as
result, the market share of leading producers of sports foot wears are gradually loosing their market to
their ever increasing competitors. In turn this has prompted leaders in the industry of sports foot wear to
shift their focus to acquisition of additional brands merging with other firms in an effort of consolidating
their position as leaders of this lucrative industry.
By taking a deep dive into PUMA and ADIDAS operating results, we expect to be informed about sport
wear market and its characteristics. We also expect to comprehend how these corporations manage their
assets, liabilities, capital, and how investments and financial activities are performed by working on their
financial reports.
As the two corporations have a close relation with each other, we decided to study them as a main subject
(PUMA) and a standpoint (ADIDAS) for comparison.
This report presents a financial analysis of the sportswear company PUMA by
comparing different financial ratios over time and with its competitor. It further
reviews PUMA’s position in the financial markets and evaluates returns in relation to
the level of risk associated from an investor perspective.
Paraphrase This Document
Need a fresh take? Get an instant paraphrase of this document with our AI Paraphraser
4 | P a g e
B. FINANCIAL RATIOS ANALYSIS:
1. Liquidity ratios:
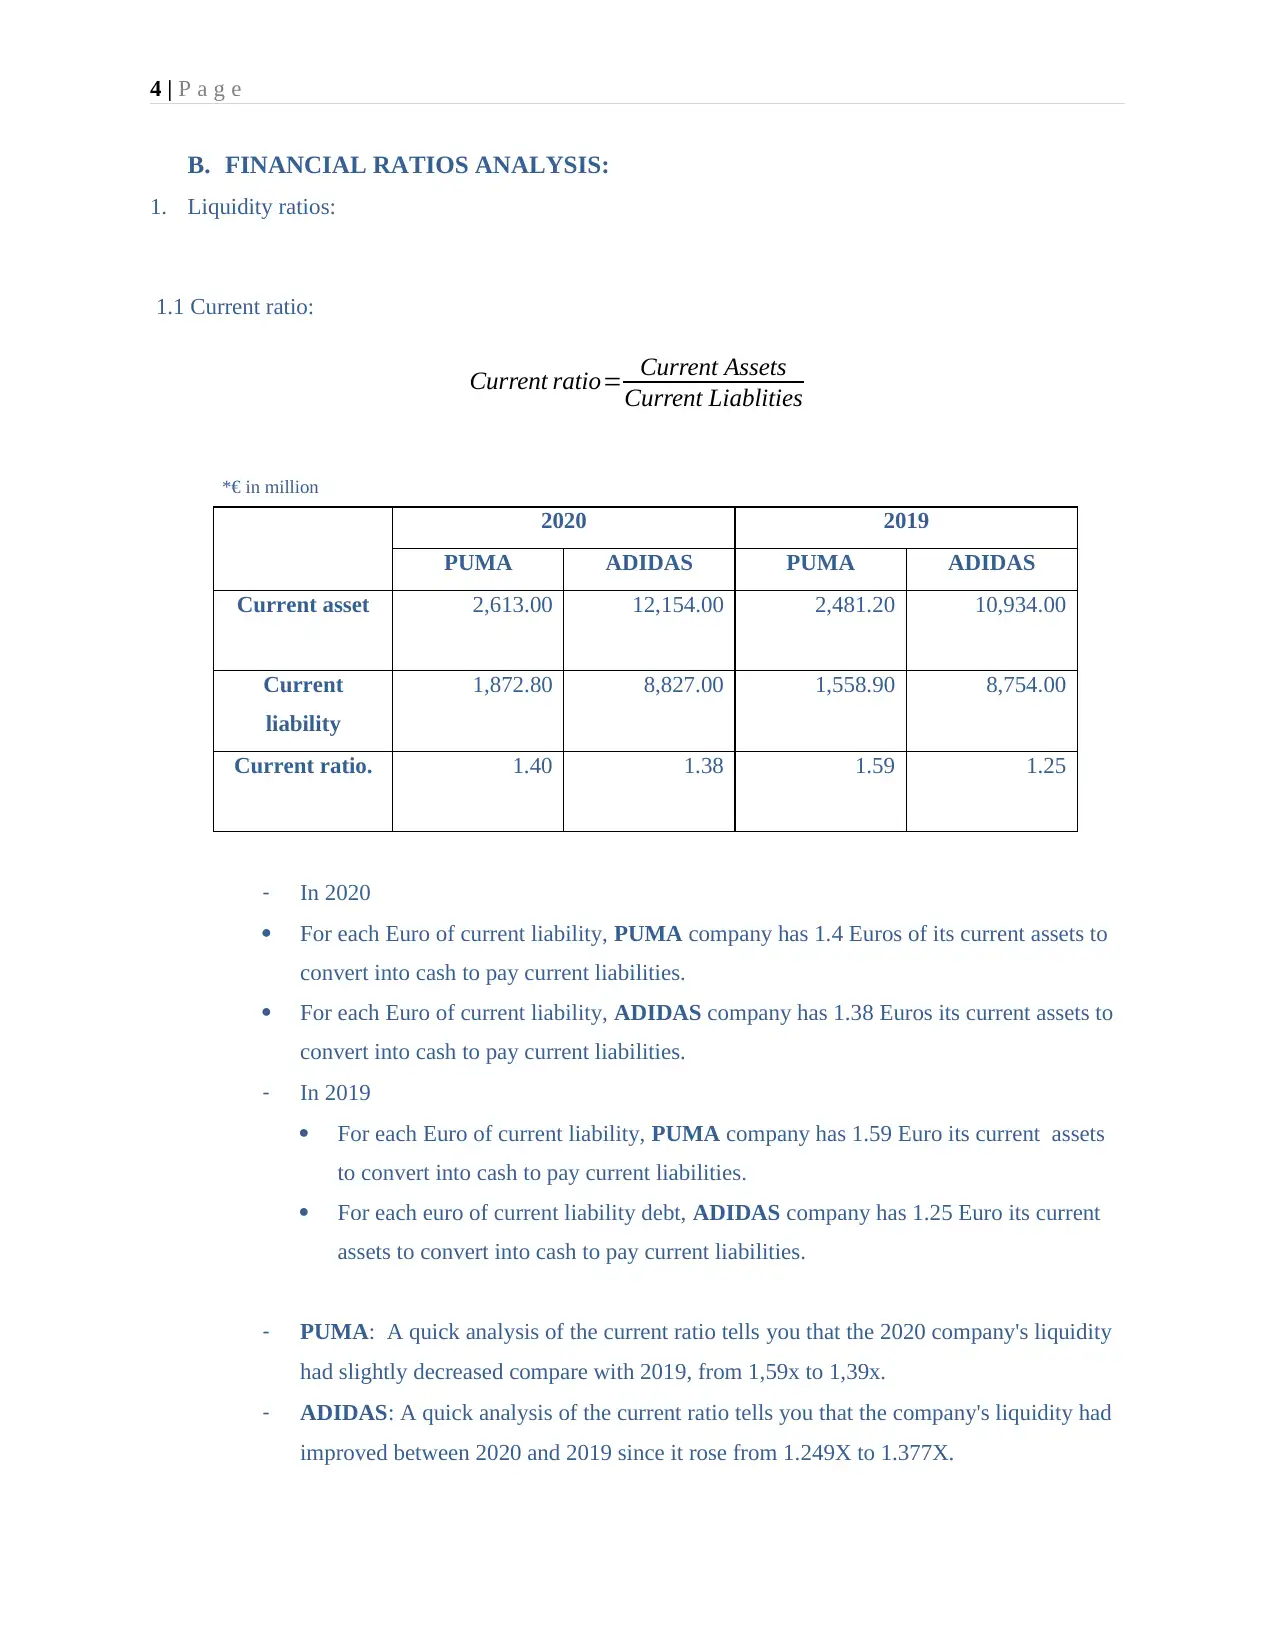
1.1 Current ratio:
Current ratio= Current Assets
Current Liablities
2020 2019
PUMA ADIDAS PUMA ADIDAS
Current asset 2,613.00 12,154.00 2,481.20 10,934.00
Current
liability
1,872.80 8,827.00 1,558.90 8,754.00
Current ratio. 1.40 1.38 1.59 1.25
- In 2020
For each Euro of current liability, PUMA company has 1.4 Euros of its current assets to
convert into cash to pay current liabilities.
For each Euro of current liability, ADIDAS company has 1.38 Euros its current assets to
convert into cash to pay current liabilities.
- In 2019
For each Euro of current liability, PUMA company has 1.59 Euro its current assets
to convert into cash to pay current liabilities.
For each euro of current liability debt, ADIDAS company has 1.25 Euro its current
assets to convert into cash to pay current liabilities.
- PUMA: A quick analysis of the current ratio tells you that the 2020 company's liquidity
had slightly decreased compare with 2019, from 1,59x to 1,39x.
- ADIDAS: A quick analysis of the current ratio tells you that the company's liquidity had
improved between 2020 and 2019 since it rose from 1.249X to 1.377X.
*€ in million
B. FINANCIAL RATIOS ANALYSIS:
1. Liquidity ratios:
1.1 Current ratio:
Current ratio= Current Assets
Current Liablities
2020 2019
PUMA ADIDAS PUMA ADIDAS
Current asset 2,613.00 12,154.00 2,481.20 10,934.00
Current
liability
1,872.80 8,827.00 1,558.90 8,754.00
Current ratio. 1.40 1.38 1.59 1.25
- In 2020
For each Euro of current liability, PUMA company has 1.4 Euros of its current assets to
convert into cash to pay current liabilities.
For each Euro of current liability, ADIDAS company has 1.38 Euros its current assets to
convert into cash to pay current liabilities.
- In 2019
For each Euro of current liability, PUMA company has 1.59 Euro its current assets
to convert into cash to pay current liabilities.
For each euro of current liability debt, ADIDAS company has 1.25 Euro its current
assets to convert into cash to pay current liabilities.
- PUMA: A quick analysis of the current ratio tells you that the 2020 company's liquidity
had slightly decreased compare with 2019, from 1,59x to 1,39x.
- ADIDAS: A quick analysis of the current ratio tells you that the company's liquidity had
improved between 2020 and 2019 since it rose from 1.249X to 1.377X.
*€ in million
5 | P a g e
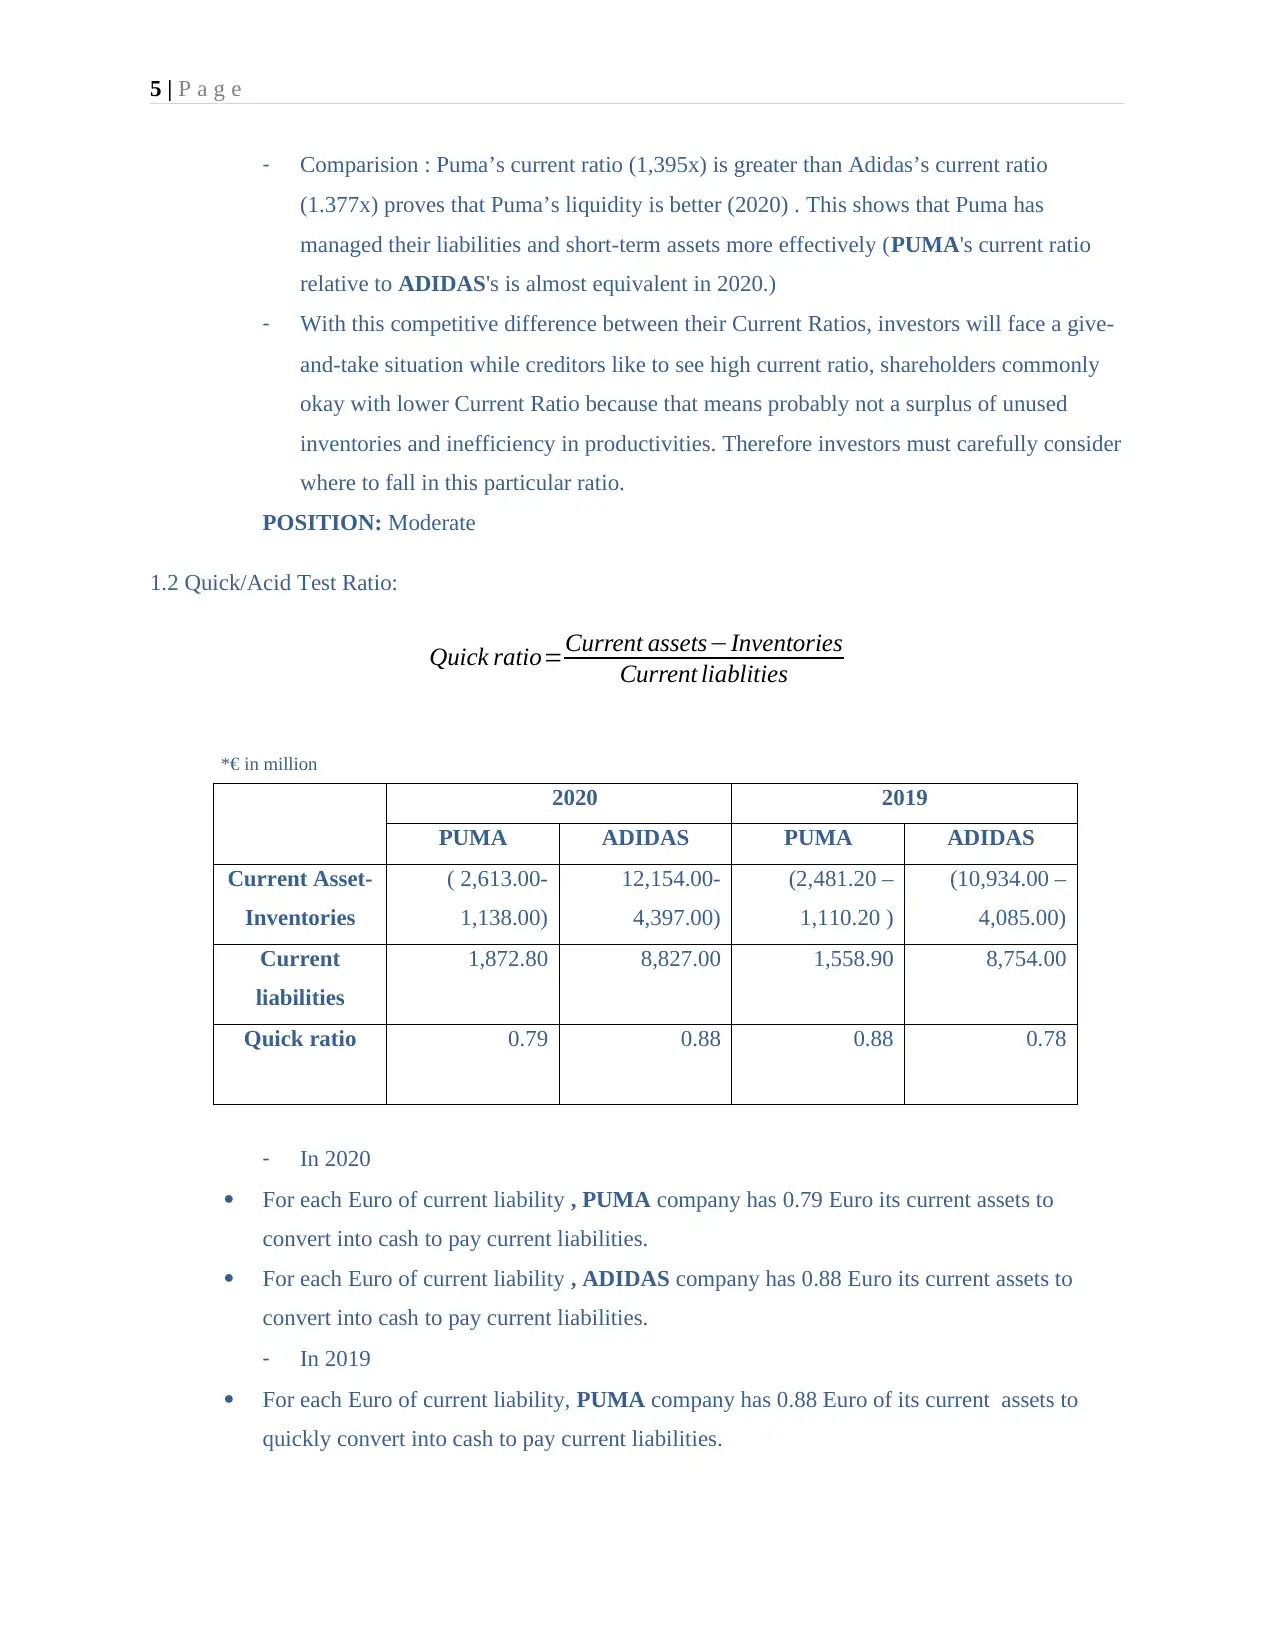
- Comparision : Puma’s current ratio (1,395x) is greater than Adidas’s current ratio
(1.377x) proves that Puma’s liquidity is better (2020) . This shows that Puma has
managed their liabilities and short-term assets more effectively (PUMA's current ratio
relative to ADIDAS's is almost equivalent in 2020.)
- With this competitive difference between their Current Ratios, investors will face a give-
and-take situation while creditors like to see high current ratio, shareholders commonly
okay with lower Current Ratio because that means probably not a surplus of unused
inventories and inefficiency in productivities. Therefore investors must carefully consider
where to fall in this particular ratio.
POSITION: Moderate
1.2 Quick/Acid Test Ratio:
Quick ratio=Current assets−Inventories
Current liablities
2020 2019
PUMA ADIDAS PUMA ADIDAS
Current Asset-
Inventories
( 2,613.00-
1,138.00)
12,154.00-
4,397.00)
(2,481.20 –
1,110.20 )
(10,934.00 –
4,085.00)
Current
liabilities
1,872.80 8,827.00 1,558.90 8,754.00
Quick ratio 0.79 0.88 0.88 0.78
- In 2020
For each Euro of current liability , PUMA company has 0.79 Euro its current assets to
convert into cash to pay current liabilities.
For each Euro of current liability , ADIDAS company has 0.88 Euro its current assets to
convert into cash to pay current liabilities.
- In 2019
For each Euro of current liability, PUMA company has 0.88 Euro of its current assets to
quickly convert into cash to pay current liabilities.
*€ in million
⊘ This is a preview!⊘
Do you want full access?
Subscribe today to unlock all pages.
Trusted by 1+ million students worldwide
6 | P a g e
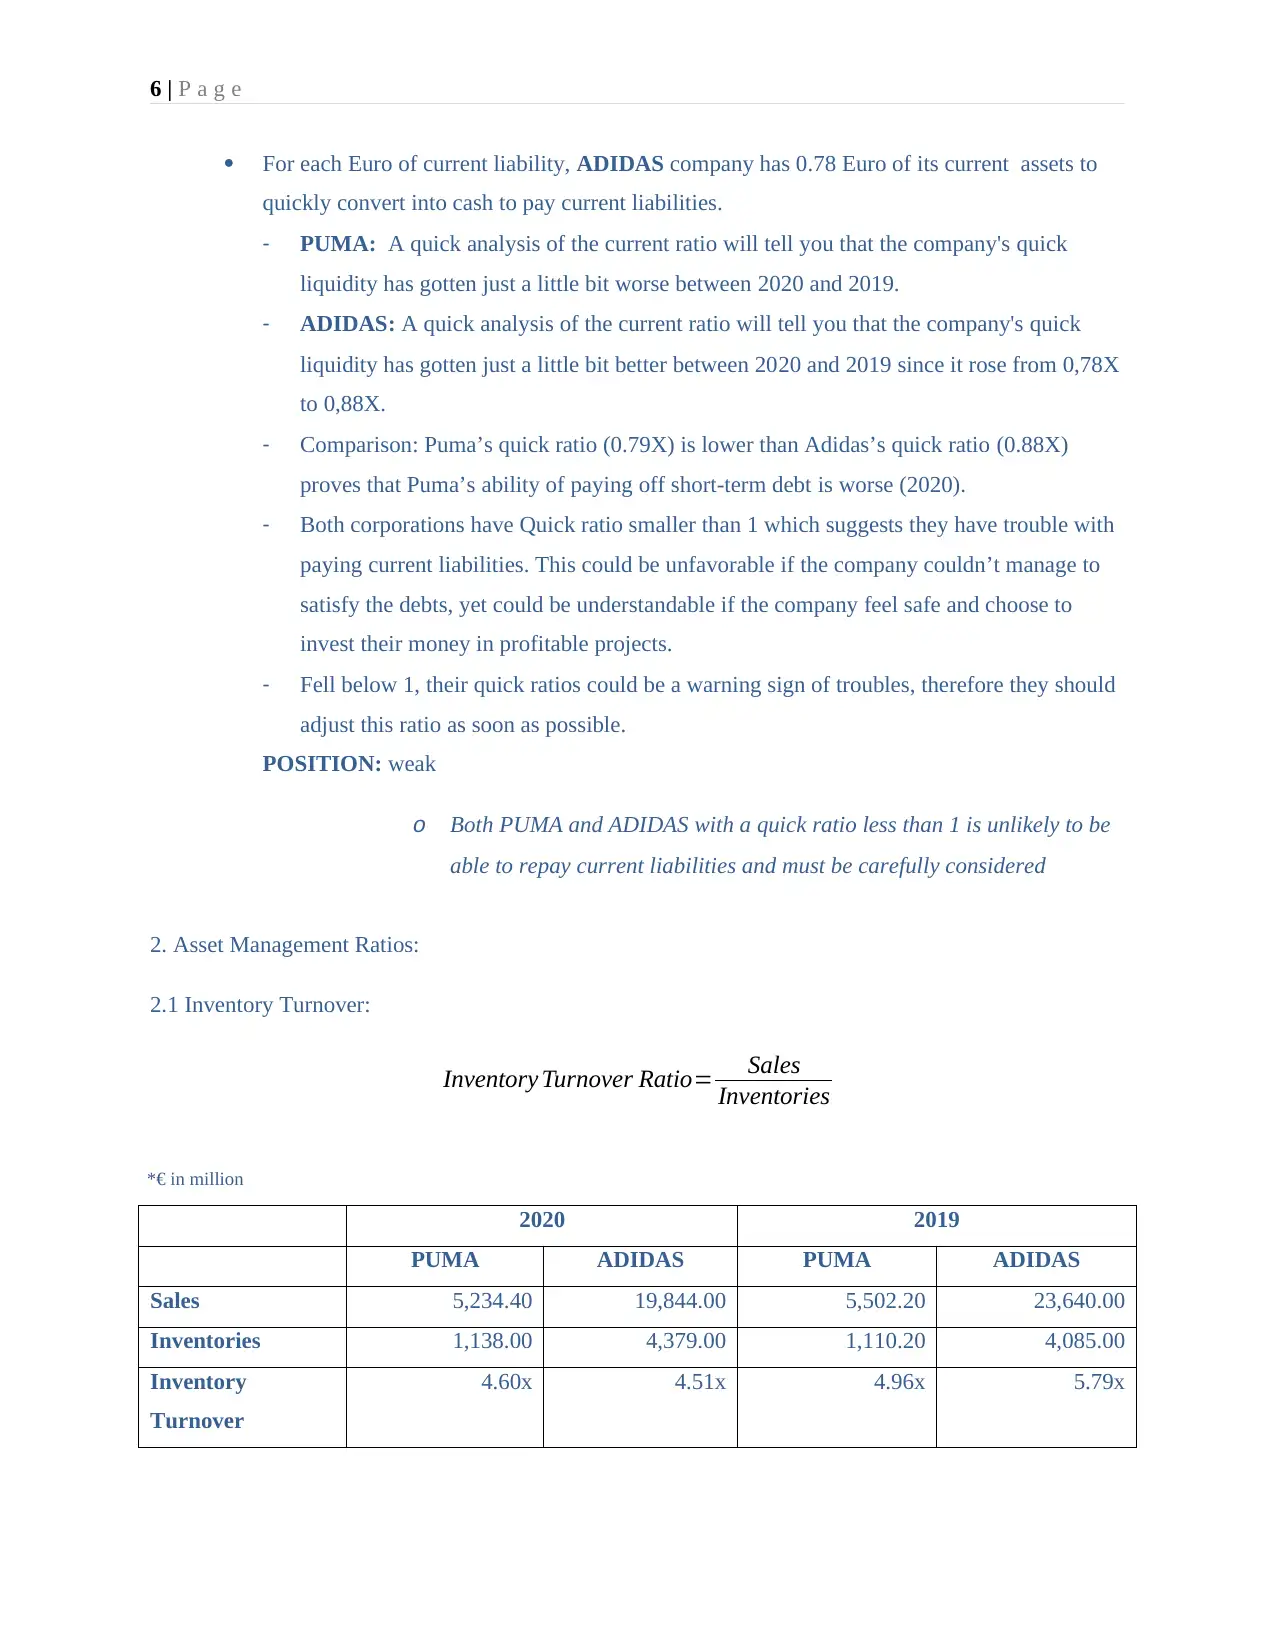
For each Euro of current liability, ADIDAS company has 0.78 Euro of its current assets to
quickly convert into cash to pay current liabilities.
- PUMA: A quick analysis of the current ratio will tell you that the company's quick
liquidity has gotten just a little bit worse between 2020 and 2019.
- ADIDAS: A quick analysis of the current ratio will tell you that the company's quick
liquidity has gotten just a little bit better between 2020 and 2019 since it rose from 0,78X
to 0,88X.
- Comparison: Puma’s quick ratio (0.79X) is lower than Adidas’s quick ratio (0.88X)
proves that Puma’s ability of paying off short-term debt is worse (2020).
- Both corporations have Quick ratio smaller than 1 which suggests they have trouble with
paying current liabilities. This could be unfavorable if the company couldn’t manage to
satisfy the debts, yet could be understandable if the company feel safe and choose to
invest their money in profitable projects.
- Fell below 1, their quick ratios could be a warning sign of troubles, therefore they should
adjust this ratio as soon as possible.
POSITION: weak
o Both PUMA and ADIDAS with a quick ratio less than 1 is unlikely to be
able to repay current liabilities and must be carefully considered
2. Asset Management Ratios:
2.1 Inventory Turnover:
Inventory Turnover Ratio= Sales
Inventories
2020 2019
PUMA ADIDAS PUMA ADIDAS
Sales 5,234.40 19,844.00 5,502.20 23,640.00
Inventories 1,138.00 4,379.00 1,110.20 4,085.00
Inventory
Turnover
4.60x 4.51x 4.96x 5.79x
*€ in million
Paraphrase This Document
Need a fresh take? Get an instant paraphrase of this document with our AI Paraphraser
7 | P a g e
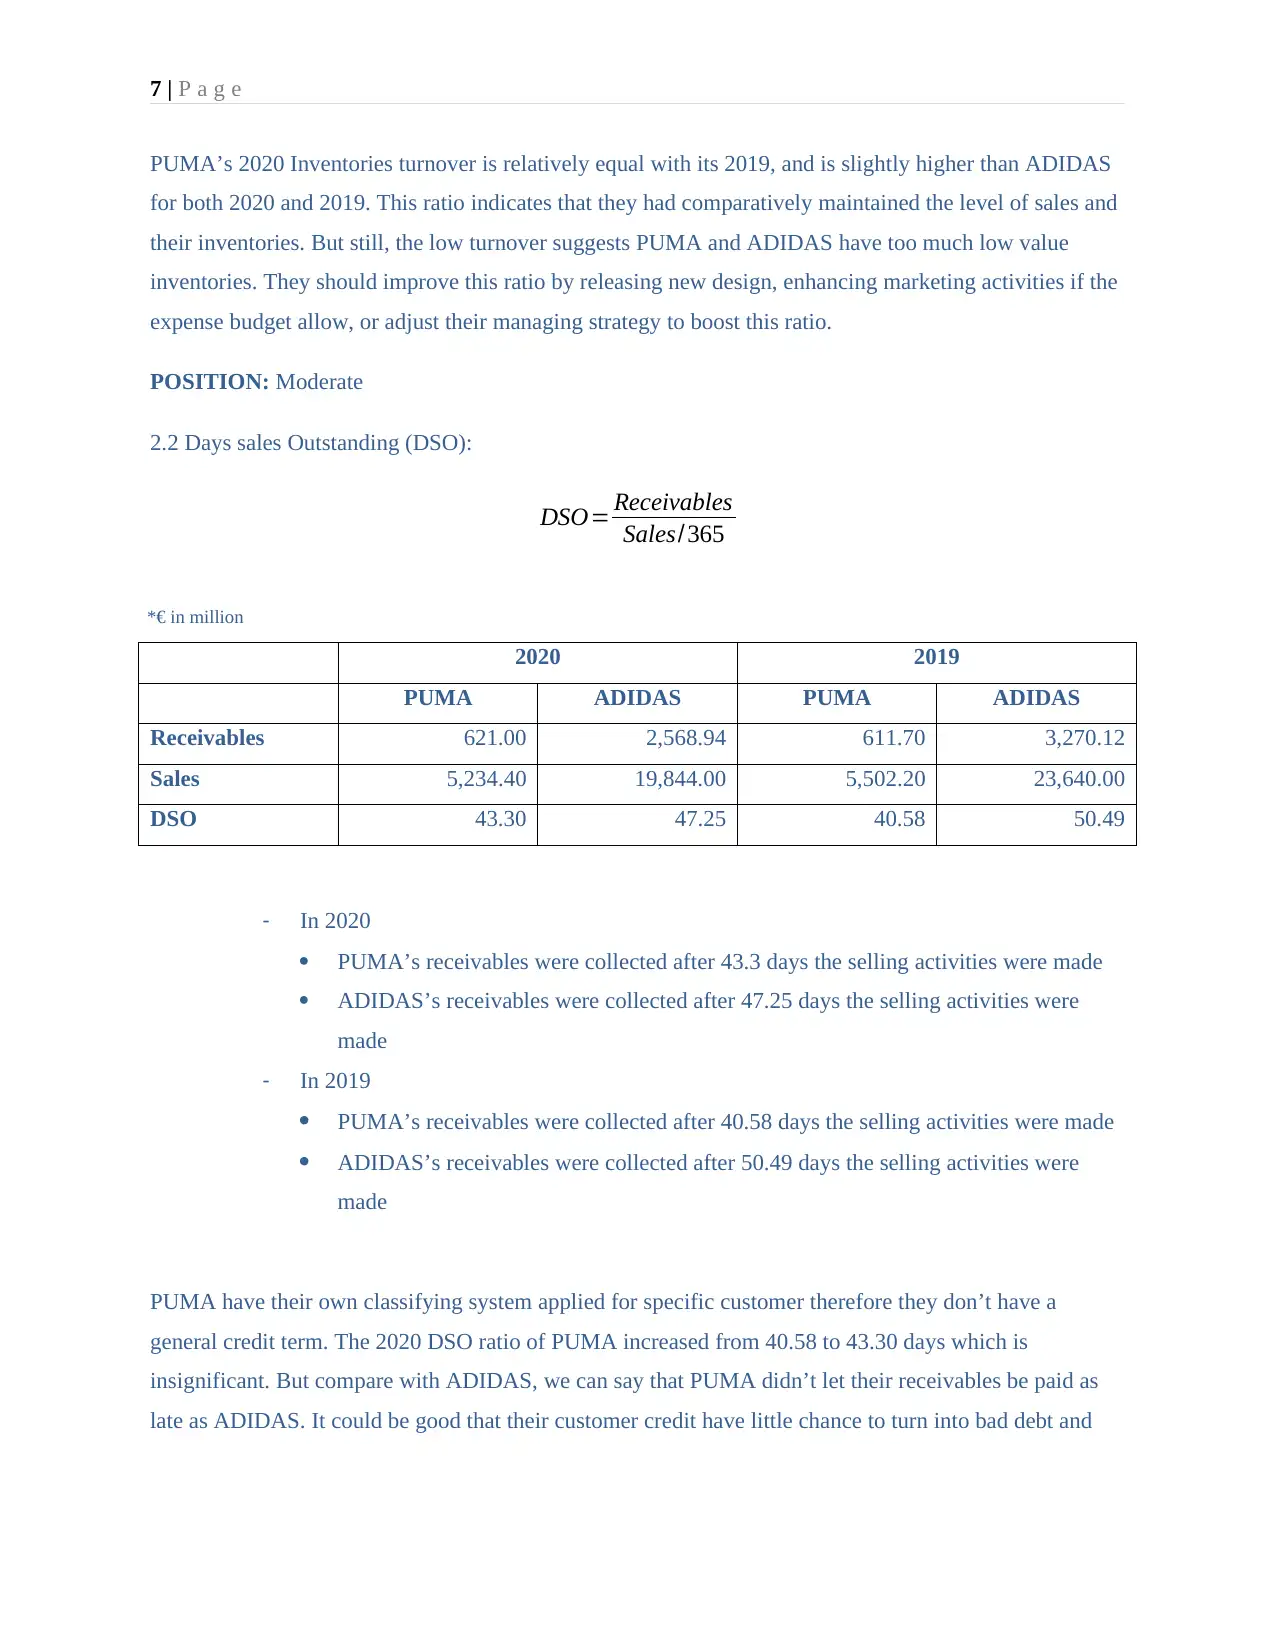
PUMA’s 2020 Inventories turnover is relatively equal with its 2019, and is slightly higher than ADIDAS
for both 2020 and 2019. This ratio indicates that they had comparatively maintained the level of sales and
their inventories. But still, the low turnover suggests PUMA and ADIDAS have too much low value
inventories. They should improve this ratio by releasing new design, enhancing marketing activities if the
expense budget allow, or adjust their managing strategy to boost this ratio.
POSITION: Moderate
2.2 Days sales Outstanding (DSO):
DSO= Receivables
Sales/365
2020 2019
PUMA ADIDAS PUMA ADIDAS
Receivables 621.00 2,568.94 611.70 3,270.12
Sales 5,234.40 19,844.00 5,502.20 23,640.00
DSO 43.30 47.25 40.58 50.49
- In 2020
PUMA’s receivables were collected after 43.3 days the selling activities were made
ADIDAS’s receivables were collected after 47.25 days the selling activities were
made
- In 2019
PUMA’s receivables were collected after 40.58 days the selling activities were made
ADIDAS’s receivables were collected after 50.49 days the selling activities were
made
PUMA have their own classifying system applied for specific customer therefore they don’t have a
general credit term. The 2020 DSO ratio of PUMA increased from 40.58 to 43.30 days which is
insignificant. But compare with ADIDAS, we can say that PUMA didn’t let their receivables be paid as
late as ADIDAS. It could be good that their customer credit have little chance to turn into bad debt and
*€ in million
8 | P a g e
become uncollectible. And because of the small distance of this ratio between PUMA and ADIDAS, we
can see that their credit policies quite keep pace with each other.
POSITION: Moderate
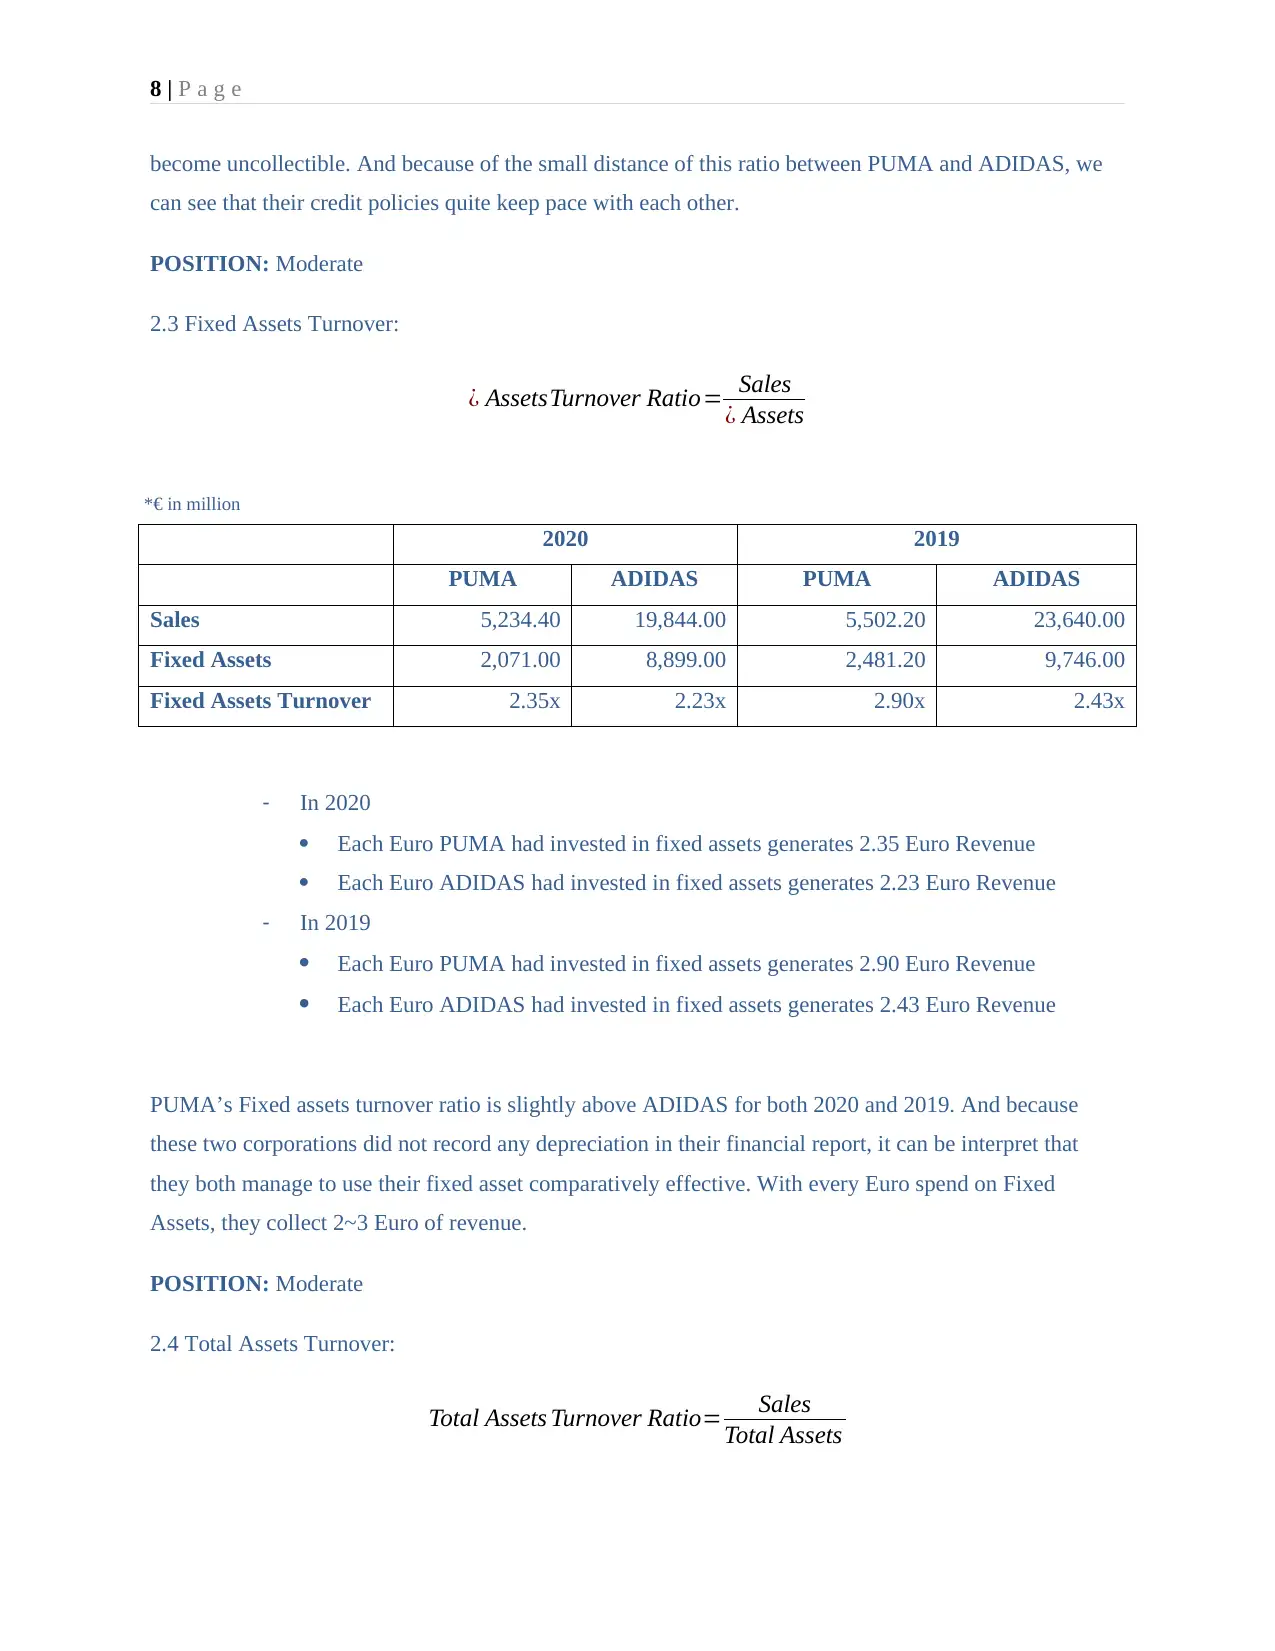
2.3 Fixed Assets Turnover:
¿ AssetsTurnover Ratio= Sales
¿ Assets
2020 2019
PUMA ADIDAS PUMA ADIDAS
Sales 5,234.40 19,844.00 5,502.20 23,640.00
Fixed Assets 2,071.00 8,899.00 2,481.20 9,746.00
Fixed Assets Turnover 2.35x 2.23x 2.90x 2.43x
- In 2020
Each Euro PUMA had invested in fixed assets generates 2.35 Euro Revenue
Each Euro ADIDAS had invested in fixed assets generates 2.23 Euro Revenue
- In 2019
Each Euro PUMA had invested in fixed assets generates 2.90 Euro Revenue
Each Euro ADIDAS had invested in fixed assets generates 2.43 Euro Revenue
PUMA’s Fixed assets turnover ratio is slightly above ADIDAS for both 2020 and 2019. And because
these two corporations did not record any depreciation in their financial report, it can be interpret that
they both manage to use their fixed asset comparatively effective. With every Euro spend on Fixed
Assets, they collect 2~3 Euro of revenue.
POSITION: Moderate
2.4 Total Assets Turnover:
Total Assets Turnover Ratio= Sales
Total Assets
*€ in million
become uncollectible. And because of the small distance of this ratio between PUMA and ADIDAS, we
can see that their credit policies quite keep pace with each other.
POSITION: Moderate
2.3 Fixed Assets Turnover:
¿ AssetsTurnover Ratio= Sales
¿ Assets
2020 2019
PUMA ADIDAS PUMA ADIDAS
Sales 5,234.40 19,844.00 5,502.20 23,640.00
Fixed Assets 2,071.00 8,899.00 2,481.20 9,746.00
Fixed Assets Turnover 2.35x 2.23x 2.90x 2.43x
- In 2020
Each Euro PUMA had invested in fixed assets generates 2.35 Euro Revenue
Each Euro ADIDAS had invested in fixed assets generates 2.23 Euro Revenue
- In 2019
Each Euro PUMA had invested in fixed assets generates 2.90 Euro Revenue
Each Euro ADIDAS had invested in fixed assets generates 2.43 Euro Revenue
PUMA’s Fixed assets turnover ratio is slightly above ADIDAS for both 2020 and 2019. And because
these two corporations did not record any depreciation in their financial report, it can be interpret that
they both manage to use their fixed asset comparatively effective. With every Euro spend on Fixed
Assets, they collect 2~3 Euro of revenue.
POSITION: Moderate
2.4 Total Assets Turnover:
Total Assets Turnover Ratio= Sales
Total Assets
*€ in million
⊘ This is a preview!⊘
Do you want full access?
Subscribe today to unlock all pages.
Trusted by 1+ million students worldwide
9 | P a g e
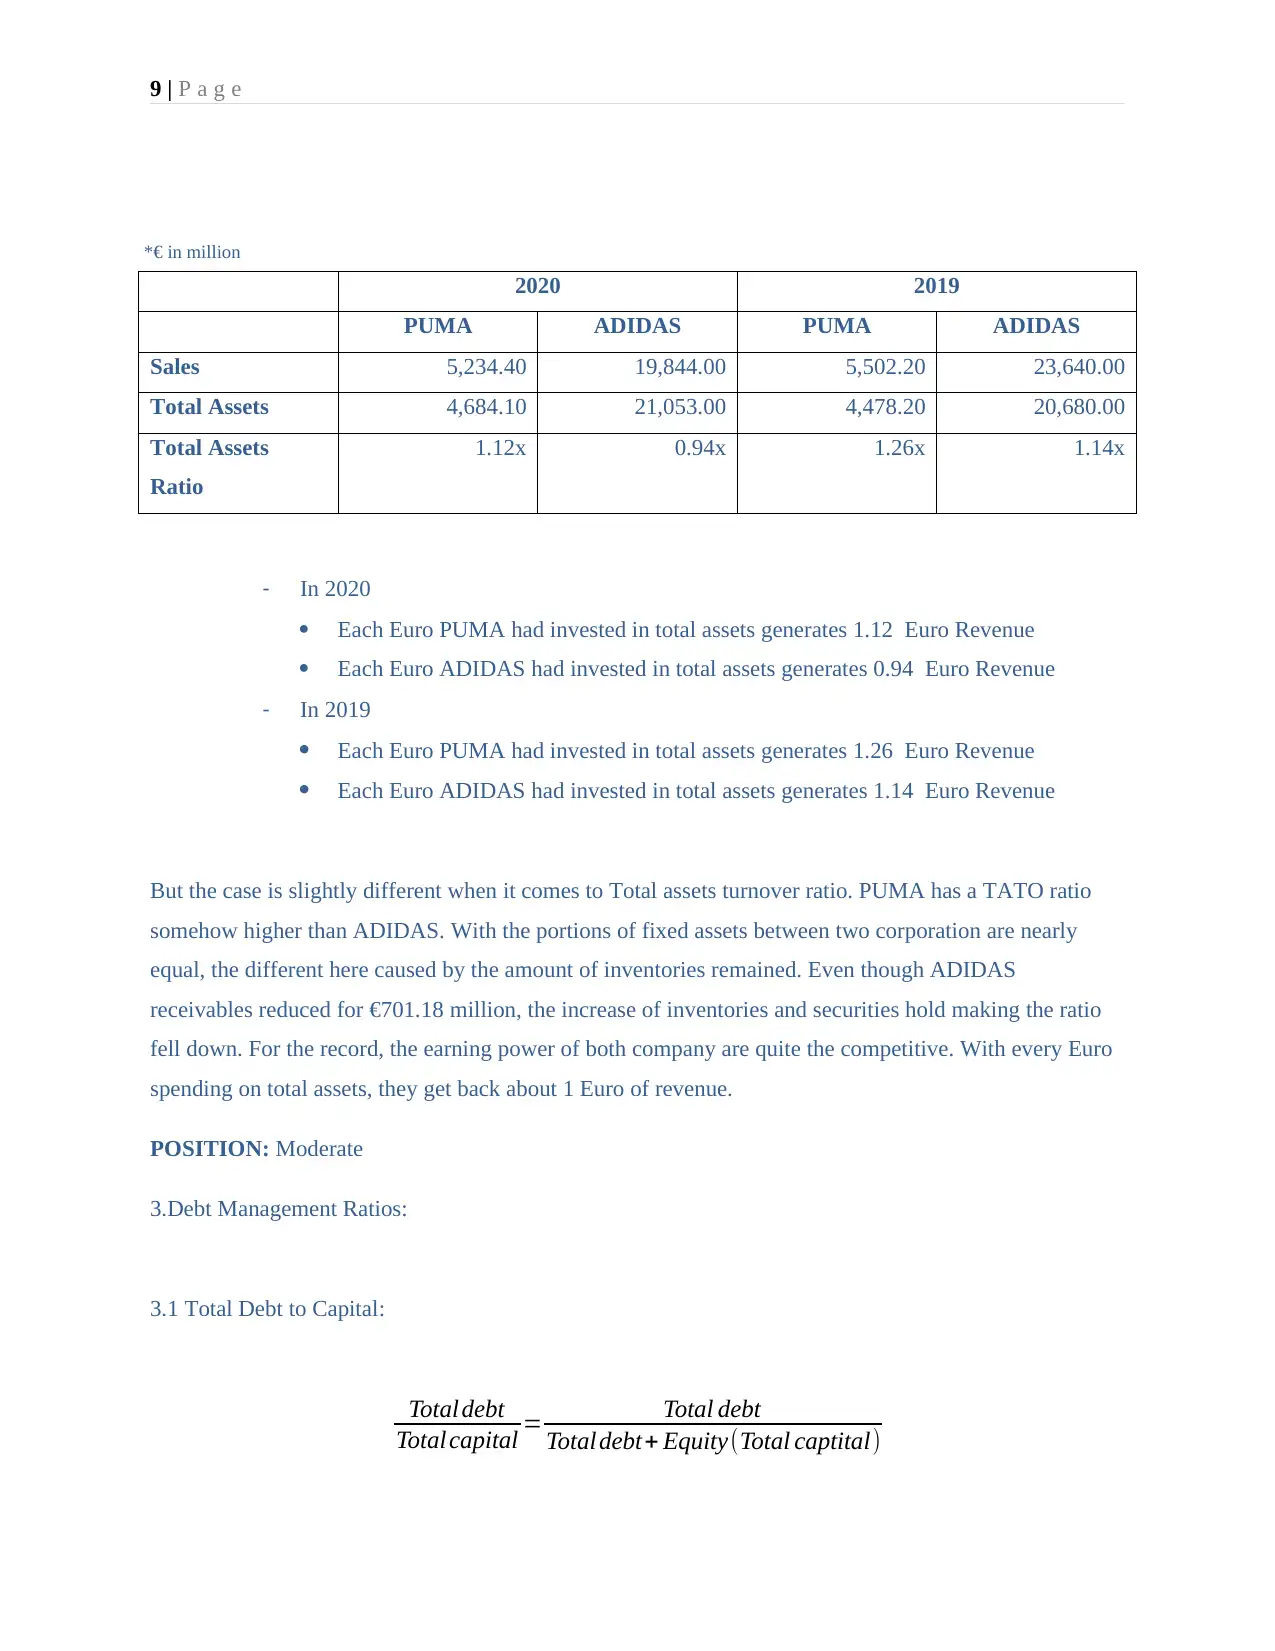
2020 2019
PUMA ADIDAS PUMA ADIDAS
Sales 5,234.40 19,844.00 5,502.20 23,640.00
Total Assets 4,684.10 21,053.00 4,478.20 20,680.00
Total Assets
Ratio
1.12x 0.94x 1.26x 1.14x
- In 2020
Each Euro PUMA had invested in total assets generates 1.12 Euro Revenue
Each Euro ADIDAS had invested in total assets generates 0.94 Euro Revenue
- In 2019
Each Euro PUMA had invested in total assets generates 1.26 Euro Revenue
Each Euro ADIDAS had invested in total assets generates 1.14 Euro Revenue
But the case is slightly different when it comes to Total assets turnover ratio. PUMA has a TATO ratio
somehow higher than ADIDAS. With the portions of fixed assets between two corporation are nearly
equal, the different here caused by the amount of inventories remained. Even though ADIDAS
receivables reduced for €701.18 million, the increase of inventories and securities hold making the ratio
fell down. For the record, the earning power of both company are quite the competitive. With every Euro
spending on total assets, they get back about 1 Euro of revenue.
POSITION: Moderate
3.Debt Management Ratios:
3.1 Total Debt to Capital:
Total debt
Total capital = Total debt
Total debt+ Equity(Total captital)
*€ in million
Paraphrase This Document
Need a fresh take? Get an instant paraphrase of this document with our AI Paraphraser
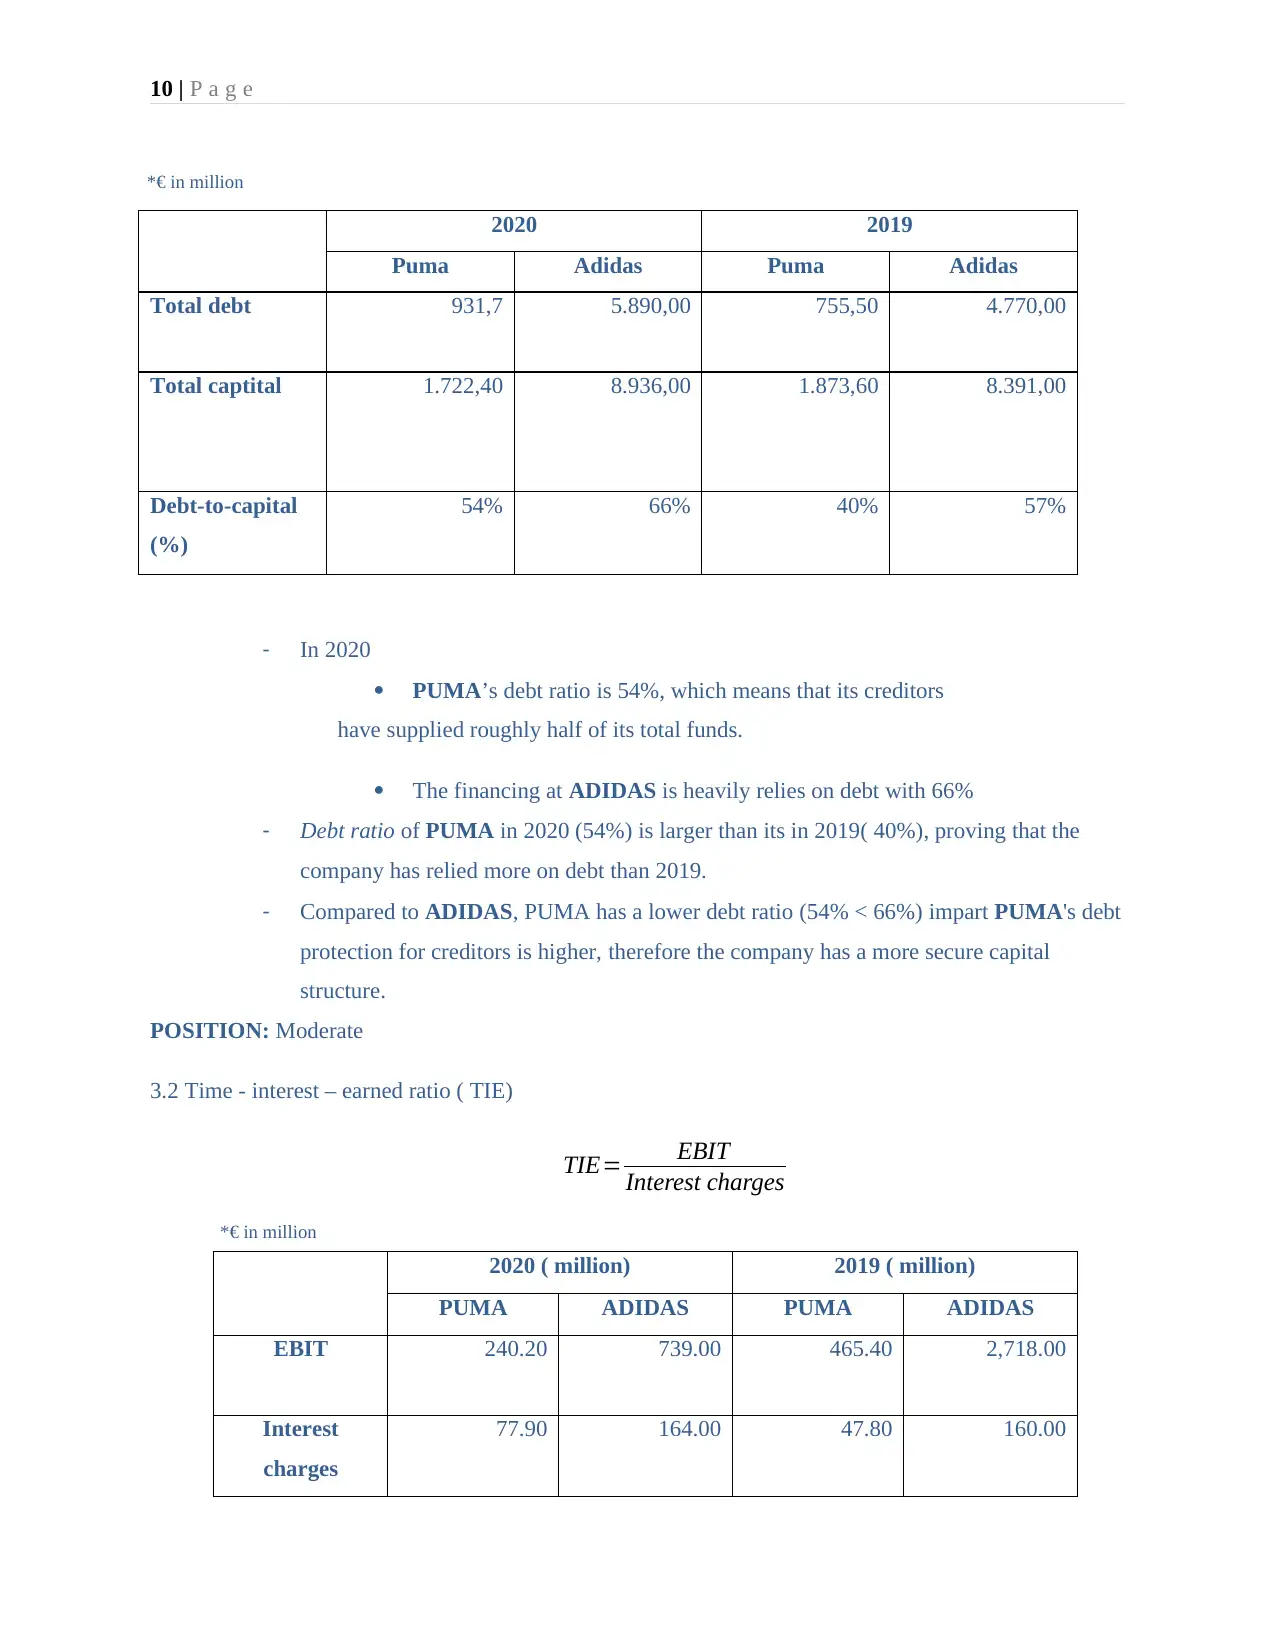
10 | P a g e
2020 2019
Puma Adidas Puma Adidas
Total debt 931,7 5.890,00 755,50 4.770,00
Total captital 1.722,40 8.936,00 1.873,60 8.391,00
Debt-to-capital
(%)
54% 66% 40% 57%
- In 2020
PUMA’s debt ratio is 54%, which means that its creditors
have supplied roughly half of its total funds.
The financing at ADIDAS is heavily relies on debt with 66%
- Debt ratio of PUMA in 2020 (54%) is larger than its in 2019( 40%), proving that the
company has relied more on debt than 2019.
- Compared to ADIDAS, PUMA has a lower debt ratio (54% < 66%) impart PUMA's debt
protection for creditors is higher, therefore the company has a more secure capital
structure.
POSITION: Moderate
3.2 Time - interest – earned ratio ( TIE)
TIE= EBIT
Interest charges
2020 ( million) 2019 ( million)
PUMA ADIDAS PUMA ADIDAS
EBIT 240.20 739.00 465.40 2,718.00
Interest
charges
77.90 164.00 47.80 160.00
*€ in million
*€ in million
11 | P a g e
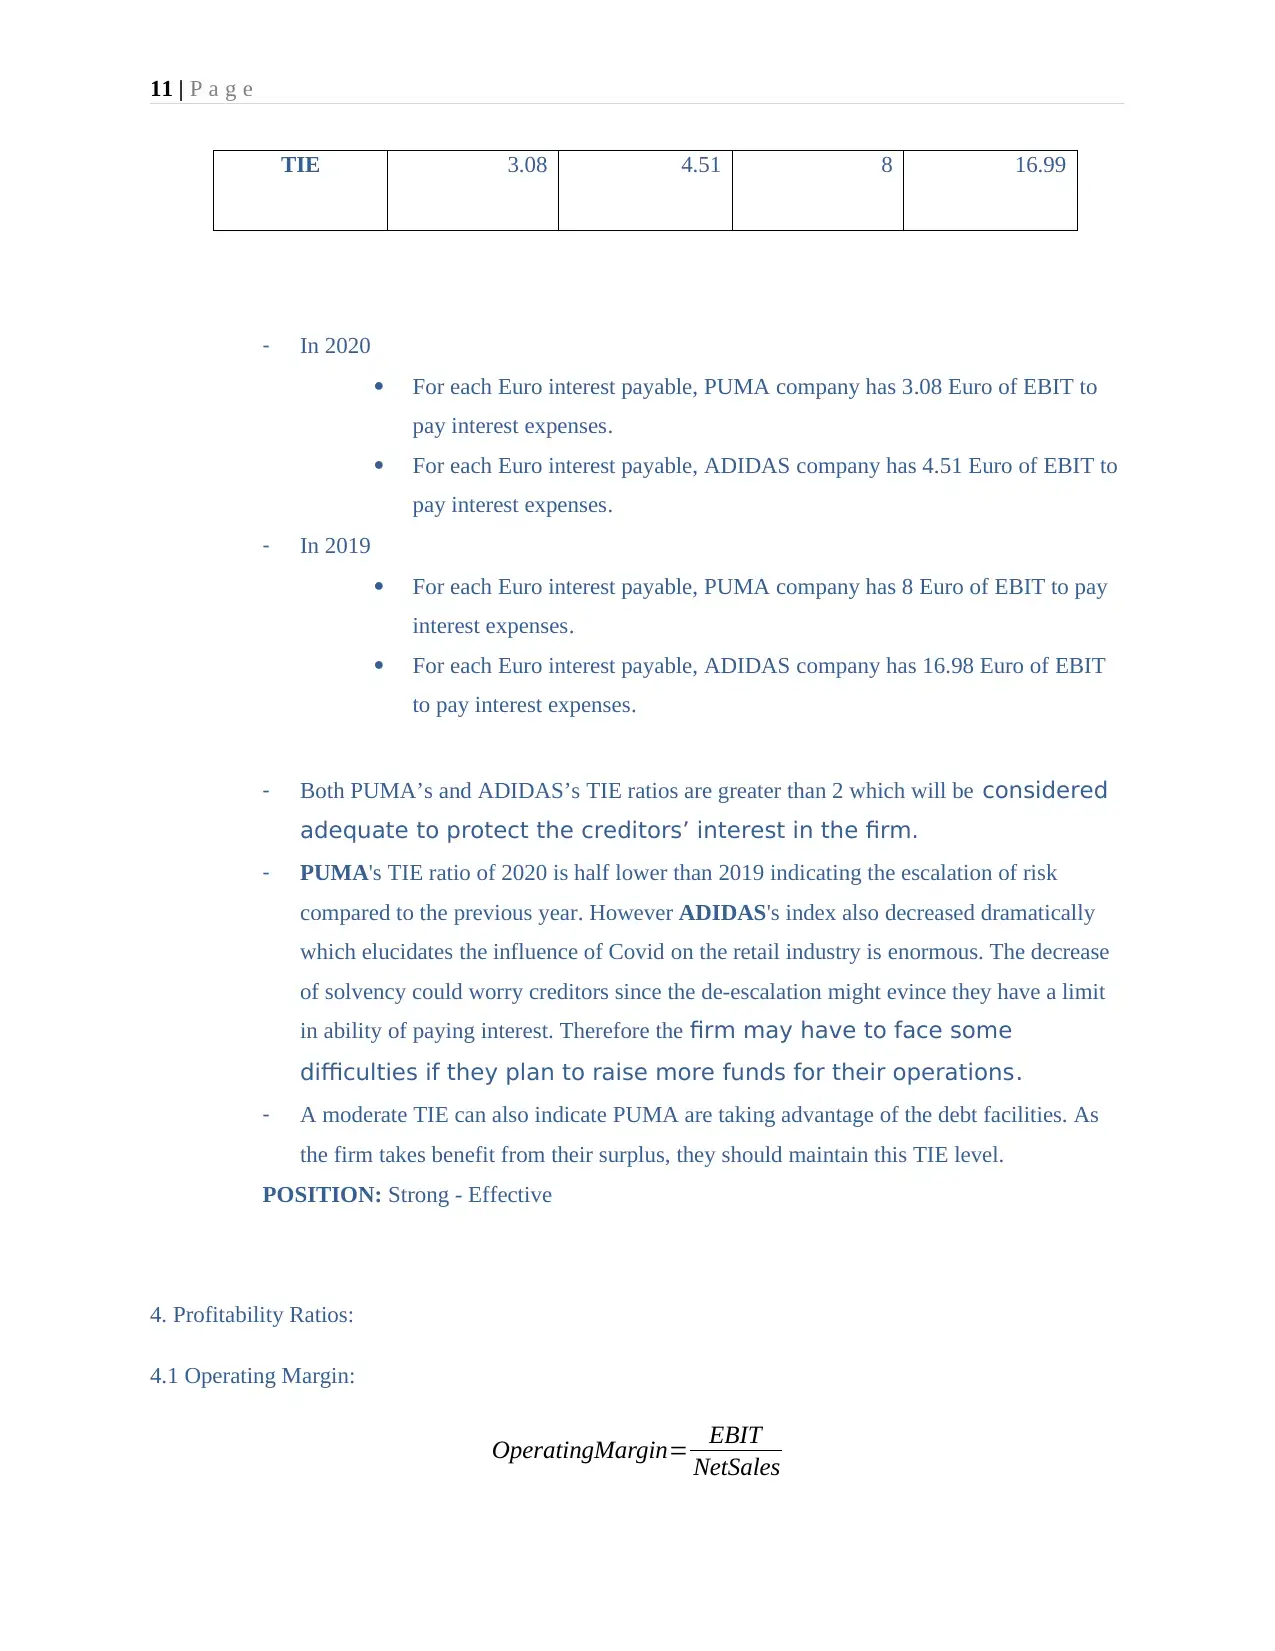
TIE 3.08 4.51 8 16.99
- In 2020
For each Euro interest payable, PUMA company has 3.08 Euro of EBIT to
pay interest expenses.
For each Euro interest payable, ADIDAS company has 4.51 Euro of EBIT to
pay interest expenses.
- In 2019
For each Euro interest payable, PUMA company has 8 Euro of EBIT to pay
interest expenses.
For each Euro interest payable, ADIDAS company has 16.98 Euro of EBIT
to pay interest expenses.
- Both PUMA’s and ADIDAS’s TIE ratios are greater than 2 which will be considered
adequate to protect the creditors’ interest in the firm.
- PUMA's TIE ratio of 2020 is half lower than 2019 indicating the escalation of risk
compared to the previous year. However ADIDAS's index also decreased dramatically
which elucidates the influence of Covid on the retail industry is enormous. The decrease
of solvency could worry creditors since the de-escalation might evince they have a limit
in ability of paying interest. Therefore the firm may have to face some
difficulties if they plan to raise more funds for their operations.
- A moderate TIE can also indicate PUMA are taking advantage of the debt facilities. As
the firm takes benefit from their surplus, they should maintain this TIE level.
POSITION: Strong - Effective
4. Profitability Ratios:
4.1 Operating Margin:
OperatingMargin= EBIT
NetSales
⊘ This is a preview!⊘
Do you want full access?
Subscribe today to unlock all pages.
Trusted by 1+ million students worldwide
1 out of 24
Related Documents


Your All-in-One AI-Powered Toolkit for Academic Success.
+13062052269
info@desklib.com
Available 24*7 on WhatsApp / Email
![[object Object]](/_next/static/media/star-bottom.7253800d.svg)
Unlock your academic potential
Copyright © 2020–2026 A2Z Services. All Rights Reserved. Developed and managed by ZUCOL.