Comprehensive Financial Statement Analysis of Qantas Airways Limited
VerifiedAdded on 2019/11/25
|21
|2975
|557
Report
AI Summary
This report presents a financial analysis of Qantas Airways Limited, focusing on the period from 2013 to 2016. The analysis employs horizontal, vertical, and ratio analysis techniques to evaluate the airline's financial performance and position. The report examines the income statement and statement of financial position, highlighting key trends in revenue, expenses, assets, and liabilities. Horizontal analysis reveals significant fluctuations in fuel consumption, depreciation, and earnings per share. Vertical analysis provides insights into the composition of expenses and asset allocation. Ratio analysis assesses profitability, liquidity, solvency, and efficiency, revealing challenges in profitability and liquidity, while efficiency shows positive signs in recent years. The report concludes with an assessment of Qantas's financial health, providing valuable insights for stakeholders and decision-makers. The analysis demonstrates the company's strengths and weaknesses and provides recommendations for improvement.
ACCOUNTING FOR MANAGERS
Qantas Airways Limited, 2016
1
Qantas Airways Limited, 2016
1
Paraphrase This Document
Need a fresh take? Get an instant paraphrase of this document with our AI Paraphraser
Executive Summary
This report is based on Qantas Airlines Limited and includes analysis of financial statements. In
this report, income statement and statement of financial position has been analysed with the help
of financial statement analysis techniques. Horizontal analysis, vertical analysis and ratio
analysis techniques has been applied and analysis has been made on the financial performance
and financial position of Qantas Airlines Limited. From the horizontal analysis of Qantas
Airlines Limited, it is analysed that many significant activities has been taken place in last 4
years in business operations or activities of Qantas Airlines Limited. Fuel consumption,
impairment of specific assets depreciation and amortisation finance income and finance income
are some items that have impacted during the analysis period. Manpower and staff related,
aircraft operating variable and fuel are three major items that has maximum contribution in
overall expenditure of the Qantas Airlines Limited. From ratio analysis technique, it is
demonstrated that profitability and liquidity position of Qantas Airlines Limited is at adverse
side. Only efficiency in business operations has shown positive sign or positive results for
Qantas Airlines Limited in last two years i.e. 2015 and 2016.
2
Contents
Introduction......................................................................................................................................4
Horizontal Analysis of Financial Statements..................................................................................5
Income Statement........................................................................................................................5
Statement of Financial Position...................................................................................................6
Horizontal Analysis of Financial Statements..................................................................................7
Income Statement........................................................................................................................7
Statement of Financial position...................................................................................................7
Ratio Analysis..................................................................................................................................9
Profitability ratio..........................................................................................................................9
Solvency ratio............................................................................................................................10
Liquidity ratio............................................................................................................................11
Efficiency ratio..........................................................................................................................12
Conclusion.....................................................................................................................................13
References......................................................................................................................................14
Appendix........................................................................................................................................16
3
⊘ This is a preview!⊘
Do you want full access?
Subscribe today to unlock all pages.
Trusted by 1+ million students worldwide
Introduction
Financial statement analysis of any business organisation can reap various useful and decision
making information. Financial statement of the business organisation is those statements contains
financial information i.e. financial performance and financial position during the reporting
period. For many stakeholders, especially for investors, financial statement analysis is required,
so as to get insight of the business organisation. Information generated from financial statement
analysis can be used in decision making process. Financial statements include income statement,
statement of financial position, cash flow statement and statement of change in equity. In this
report, financial statement analysis of Qantas Airlines Limited has been performed and relevant
results have been drawn. In this report, analysis of financial statements has been conducted using
horizontal analysis, vertical analysis and ratio analysis techniques. While using horizontal
analysis and vertical analysis of financial statement techniques, financial statement of last 4 years
i.e. from 2013 to 2016 has been used. On the other hand, for the purpose of ratio analysis,
financial statements of last two years i.e. 2015 and 2016 has been used. From these techniques,
liquidity, profitability, solvency and efficiency of Qantas Airlines Limited or in business
operations has been analysis
4
Paraphrase This Document
Need a fresh take? Get an instant paraphrase of this document with our AI Paraphraser
Horizontal Analysis of Financial Statements
Income Statement
Please find appendix
(Entwistle, 2015)
Analysis
From the above table it can be analysed that sales revenue in all the four years is static or have
not varied much. In all the four years, there is less than 4 5 variation in revenues of Qantas
Airlines Limited. Fuel consumption has been increased in 2016 as compared to other periods,
because of increase in operational capacity. There is significant change in Depreciation and
amortisation expenses during 2015 and 2016 and this is the significant reason for decline in
profitability (Alhabeeb, 2014). Other expense of Qantas Limited has fluctuated at large scale.
Another significant change that can be observed from the horizontal analysis of income
statement is related to earnings per share that Qantas Airlines Limited has earned for equity
shareholders. There are huge ups and downs in earnings per share in the undertaken period
(Babackov, et. al, 2014). Therefore this makes Qantas Airlines Limited less attractive for
investors.
5
Statement of Financial Position
Please find appendix
(Berislav, et. al, 2012)
ANALYSIS
From the horizontal analysis of statement of financial statements, it can be observed that current
assets of Qantas Airlines Limited are fluctuating at higher level. In 2016, cash and cash
equivalents balance has been decreased by 31.91 % as compared to 2015 balance. Another
significant reduction in current assets is related to assets held for sale i.e. in 2016 it is reduced by
87.50 % as compared to 2015. Therefore these are some issues that lead to liquidity problem in
business operations of Qantas Airlines Limited. There is overall reduction in total current assets
during 2016. In case of non-current assets, Qantas Limited has deployed financial resources in
huge investments during 2015-2016 financial year. Investment through equity method has been
increased by 47.01 % in 2016 as compared to 2015. In other years, there is no significant change
in investments (Govindaraj, 2011). On the other hand, current liabilities interest-bearing
liabilities and other financial liabilities have been reduced by huge margin. This has, managed
the liquidity level in business operations. At last, it can be analysed that there is huge fluctuation
in equity capital i.e. treasury shares, retained earnings and reserves. Overall analysis suggests
that Qantas Limited’s financial position has been fluctuating and will not attract stakeholders
(Riordan & Riordan, 2009).
6
⊘ This is a preview!⊘
Do you want full access?
Subscribe today to unlock all pages.
Trusted by 1+ million students worldwide
Horizontal Analysis of Financial Statements
Income Statement
Please find appendix
(Ildiko, 2014)
ANALYSIS
From the above table it can be analysed that in both the years i.e. 2015 and 2016, under
consideration, there are three major expenses that Qantas Limited or any other airline
organisation would have i.e. manpower and staff related, fuel and aircraft operating variable.
Major expenses have been incurred on these items as suggested from the vertical income
statement. Therefore management of Qantas Airlines Limited is required to consider techniques
for reducing the level of expenditure on these items (Grimm & Blazovich, 2016). Other expenses
i.e. administrative expenses also hold significant percentage of total sales revenue. In case of
Qantas Airlines Limited, it can be analysed that operating expenses has been overlapping other
expenses or expenditure. It can be observed that in 2016 operating expenditure is 89.86 % of
sales revenue and in 2015 it is 93.37 % of sales revenue. This is prime reason for Qantas Airlines
Limited, in not achieving higher profitability (Soffer & Soffer, 2009).
Statement of Financial position
Please find appendix
(Qantas Airlines Limited, 2014)
ANALYSIS
From the vertical analysis of statement of financial position or balance sheet it can be observed
that, in total assets, current assets is very less and non - current assets has higher portion. From
this analysis, it can be observed that business organisation having lower current assets; will lag in
terms of maintaining liquidity or effectively managing working capital (Sinha, 2012). In case of
7
Paraphrase This Document
Need a fresh take? Get an instant paraphrase of this document with our AI Paraphraser
liabilities, major portion is covered by revenue received in advance i.e. unearned income. Qantas
Airlines Limited is working on 80:20 working capital basis i.e. debt is 80 % and internal funds or
equity is 20 % of overall capital structure.
8
Airlines Limited is working on 80:20 working capital basis i.e. debt is 80 % and internal funds or
equity is 20 % of overall capital structure.
8
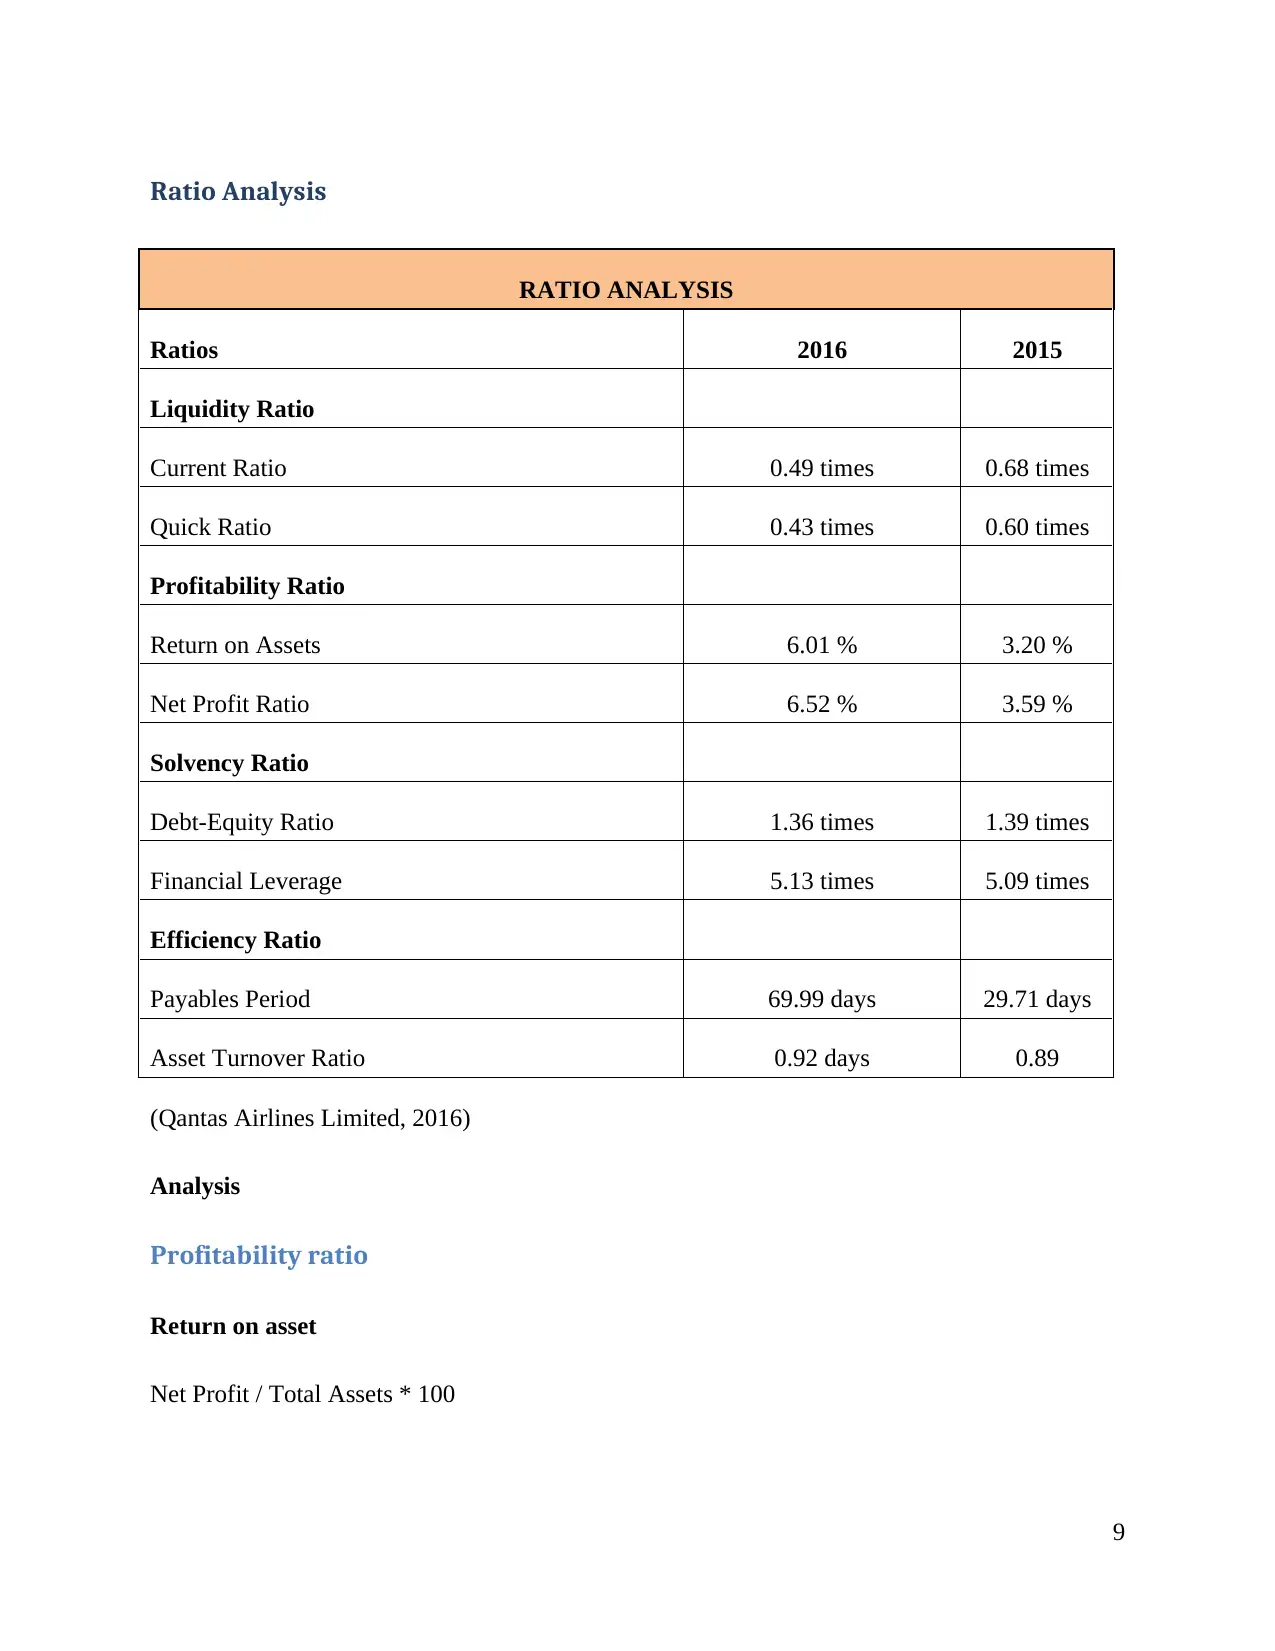
Ratio Analysis
RATIO ANALYSIS
Ratios 2016 2015
Liquidity Ratio
Current Ratio 0.49 times 0.68 times
Quick Ratio 0.43 times 0.60 times
Profitability Ratio
Return on Assets 6.01 % 3.20 %
Net Profit Ratio 6.52 % 3.59 %
Solvency Ratio
Debt-Equity Ratio 1.36 times 1.39 times
Financial Leverage 5.13 times 5.09 times
Efficiency Ratio
Payables Period 69.99 days 29.71 days
Asset Turnover Ratio 0.92 days 0.89
(Qantas Airlines Limited, 2016)
Analysis
Profitability ratio
Return on asset
Net Profit / Total Assets * 100
9
⊘ This is a preview!⊘
Do you want full access?
Subscribe today to unlock all pages.
Trusted by 1+ million students worldwide
Return on asset shows profitability of the business organisation in terms of their total assets that
are used in business operations. Return on asset measure assets ability by considering net profit
earning by the business organisation during the reporting period by utilising its available asset
base. This ratio is useful for investors to analyse, whether business organisation is capable of
generating enough profit from the available assets. Higher the return on asset ratio more effective
is the utilisation of assets. In case of Qantas Airways Limited, it can be analysed that, in both the
years 2015 and 2016, their assets utilisation capability is not attractive for investors. Since, in
both the years, ratio is at lower side and thus represents low profitability and efficiency of asset
utilisation.
Net Profit ratio
Net Profit / Sales Revenue * 100
Net profit ratio or net margin is most common profitability ratio that is used by investors to
interpret or analyse level of profitability in the business organisation. Net profit ratio analyses net
profit earned during the reporting period by the business organisation as compared to its sales
revenue. Net profit ratio reflects savings capacity or profit making capabilities of the business
organisation (Cao, et. al, 2011). In present case of Qantas Airways Limited, net profit ratio
shows inadequate level of profit achieved in both 2015 and 2016 years. In 2015, their net profit
ratio is less than 4 % which is way below industry standards and competitors. In 2016, although
their net profit has increased to 6.52 %, it is still not adequate to attract stakeholders.
Solvency ratio
Solvency in the business organisation denotes adequate level of inside and outside funds or
capital used in the business operations. Solvency ratio analyses, level of risk that business
organisation has in their capital structure. Capital structure consists of debt and equity, therefore
solvency ratios analyses adequacy level of debt and equity in the overall capital structure.
Debt-Equity Ratio
Debt / Equity
10
Paraphrase This Document
Need a fresh take? Get an instant paraphrase of this document with our AI Paraphraser
Debt – Equity ratio of the business organisation analysis solvency position of the organisation in
terms of analysing debt and equity used in business processes. More utilisation of debt leads to
more exposure to market risk or risk of failure. On the other hand, risk of utilising more equity
involves risk of control and less effective capital utilisation. In case of Qantas Airlines Limited,
in both the years i.e. 2015 and 2016, they are more exposed to risk of debt. It can be observed
that, in 2015 and 2016, their debt to equity ratio is more than 1 time, which means management
has been using higher debt as compared to internal funds. It can be analysed that, their debt and
equity ratio is adequate because management is not at much risk they had covered risk through
equity (Davies & Crawford, 2011). In 2015 and 2016, Qantas Airlines Limited has 1.36 times
and 1.39 times debt – equity ratio respectively that means stakeholders has back up of equity.
Liquidity ratio
Current Ratio
Current assets / Current Liabilities
Current ratio demonstrates liquidity position or working capital management of the business
organisation. Current ratio analysis current assets and current liabilities of the business
organisation and establishes relationship between current assets and current liabilities. Higher
current ratio denotes more liquidity in the business operations or in working capital and vice-
versa. In case of Qantas Airlines Limited, their liquidity position or working capital management
is not effective. In both the years, current ratio is less than 1 time, which means Qantas Airlines
Limited does not have enough current assets or liquidity to repay their current obligations. This
situation may lead to non – payment of short term dues or other obligations.
Quick Ratio
Quick assets / Current Liabilities
Quick asset is calculated by reducing inventories and prepaid expenses from the current assets.
Quick ratio is ultimate check point or detailed analysis of liquidity can be done using quick ratio.
In case of Qantas Airlines Limited, it can be observed that, liquidity position is not at good side
and they had invested less in quick assets as compared to their current liabilities (Mantone,
11
2013). Quick ratio denotes actual position of working capital and this shows worst situation of
Qantas Airlines Limited’s working capital and liquidity position.
Efficiency ratio
From the Efficiency ratios used to analyse efficiency level in business activities, it can be
observed that, payable period of Qantas Airlines Limited is at higher side that means they can
deferred current obligations. This is positive sign for Qantas Airlines Limited; this will manage
their activities in terms of efficiency management. As compared to 2015, Qantas Airlines
Limited has improved their payables period in 2016 and has maintained it to 70 days. On the
other hand, asset turnover ratio suggests the efficiency of business organisation in utilising assets
in generating revenue during the reporting period (Lanza, 2004). In both the years i.e. 2015 and
2016, Qantas Airlines Limited has maintained higher asset turnover ratio i.e. 89 % and 92 %
respectively.
12
⊘ This is a preview!⊘
Do you want full access?
Subscribe today to unlock all pages.
Trusted by 1+ million students worldwide
1 out of 21
Related Documents


Your All-in-One AI-Powered Toolkit for Academic Success.
+13062052269
info@desklib.com
Available 24*7 on WhatsApp / Email
![[object Object]](/_next/static/media/star-bottom.7253800d.svg)
Unlock your academic potential
Copyright © 2020–2026 A2Z Services. All Rights Reserved. Developed and managed by ZUCOL.