ACCT2005 Module 4: Financial Analysis of Qantas Airlines
VerifiedAdded on 2023/01/19
|11
|2813
|42
Report
AI Summary
This report provides a comprehensive financial analysis of Qantas Airlines. It begins with an introduction outlining the assignment's objectives, which include analyzing the airline's financial ratios related to operating, investment, financing, and dividend management. The analysis includes calculations for Return on Assets (ROA), Return on Equity (ROE), Earnings per Share (EPS), current ratio, quick ratio, fixed asset turnover, asset turnover, debt-to-equity ratio, debt ratio, and dividend yield. The report then assesses the cash flow from operating, investing, and financing activities, highlighting trends and key drivers. An evaluation of the overall financial position and performance of Qantas Airlines is provided, including revenue, expenses, and asset/liability changes. The report concludes with recommendations for the company's executives and an analysis of whether the company's financial policies support its overall strategy. The report utilizes the latest annual report of Qantas Airlines and compares its financial performance with industry standards.
Running Head: FINANCIAL ANALYSIS
FINANCIAL ANALYSIS
Name of the Student
Name of the University
Author Note
FINANCIAL ANALYSIS
Name of the Student
Name of the University
Author Note
Paraphrase This Document
Need a fresh take? Get an instant paraphrase of this document with our AI Paraphraser
1FINANCIAL ANALYSIS
Table of Contents
Introduction................................................................................................................................2
Answer to Question1..............................................................................................................2
Answer to Question 2.............................................................................................................5
Answer to Question 3.............................................................................................................6
Answer to Question 4.............................................................................................................7
Answer to Question 5.............................................................................................................7
Conclusion..................................................................................................................................8
Reference....................................................................................................................................9
2FINANCIAL ANALYSIS
Introduction
The aim of this assignment is to do the financial analysis of the Qantas Airlines. It is
one of the third oldest airline the world. The Australia based airline is largest by the size of
fleet, international destinations and international flights. This airline is referred as low cost
airline, which are most recognized and longest established airlines around the world (Qantas
Investors | Investor Centre., 2019). Hence, under this assignment discussion will be done on
the analysis of the financial ratios of the company by referring it to operating, Investment,
Financing and dividend policy management. In addition, discussion will be based on cash
flow analysis of the company by evaluating their operating, investing and financing activities.
Moreover, discussion will also be based on the evaluation of the overall financial position
and financial performance of the company. Further, discussion will be done on
recommendations to the executive of the company. Hence, lastly, analysis has to be done that
whether the financial policy of the company supports the strategy of the company or not
(Qantas Investors | Investor Centre., 2019).
Answer to Question1
In order to analyze the operating, investing, financing and dividend management of
the company, following ratios are calculated:
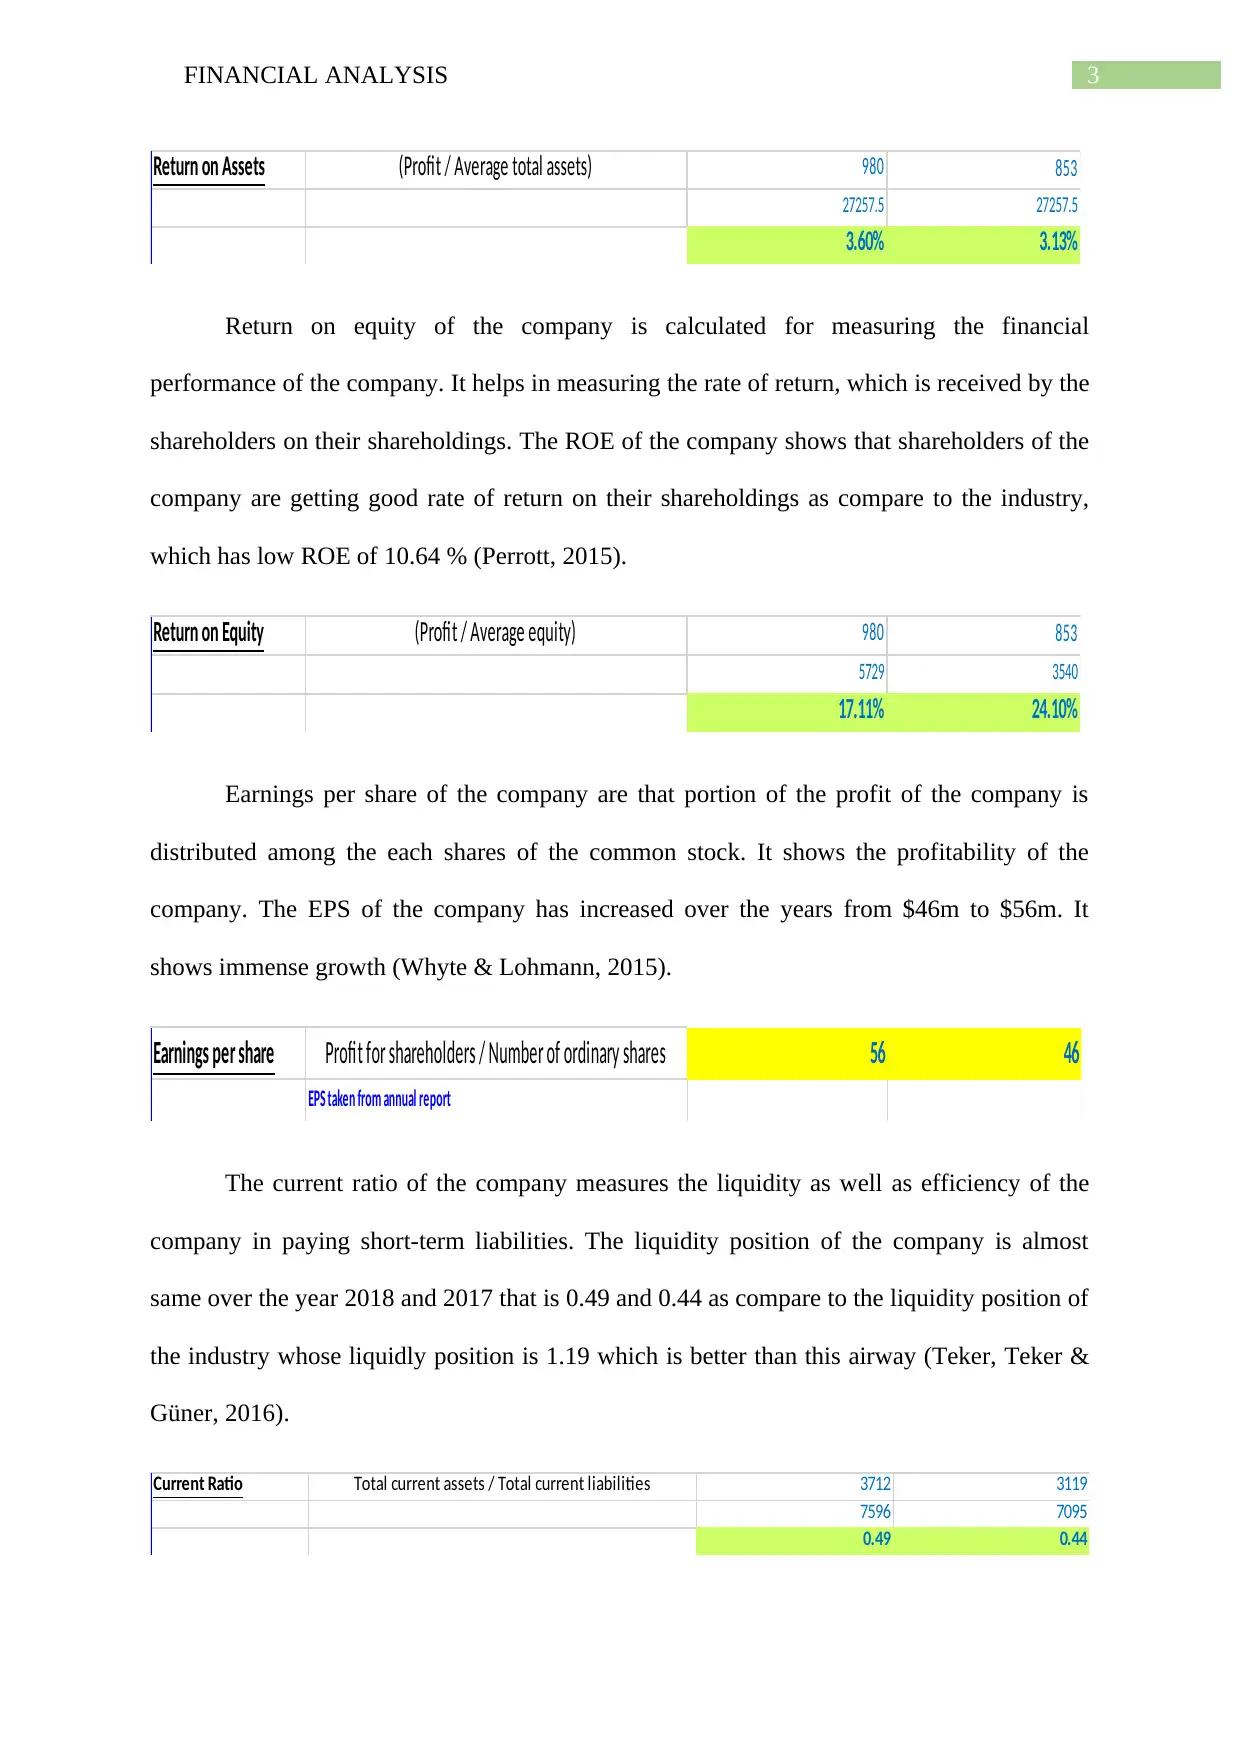
Return on Assets is calculated to know whether the company is profitable i terms of
utilizing its assets. It evaluated is the efficiency of the management of the company for
generating the revenue from their assets or resources available. Hence, the ROA of Qantas
airways shows that company is able is not able to generate enough returns on assets as
compare to industry, which has 4.47% ROA (Lopes, Ferraz & Rodrigues, 2016).
Introduction
The aim of this assignment is to do the financial analysis of the Qantas Airlines. It is
one of the third oldest airline the world. The Australia based airline is largest by the size of
fleet, international destinations and international flights. This airline is referred as low cost
airline, which are most recognized and longest established airlines around the world (Qantas
Investors | Investor Centre., 2019). Hence, under this assignment discussion will be done on
the analysis of the financial ratios of the company by referring it to operating, Investment,
Financing and dividend policy management. In addition, discussion will be based on cash
flow analysis of the company by evaluating their operating, investing and financing activities.
Moreover, discussion will also be based on the evaluation of the overall financial position
and financial performance of the company. Further, discussion will be done on
recommendations to the executive of the company. Hence, lastly, analysis has to be done that
whether the financial policy of the company supports the strategy of the company or not
(Qantas Investors | Investor Centre., 2019).
Answer to Question1
In order to analyze the operating, investing, financing and dividend management of
the company, following ratios are calculated:
Return on Assets is calculated to know whether the company is profitable i terms of
utilizing its assets. It evaluated is the efficiency of the management of the company for
generating the revenue from their assets or resources available. Hence, the ROA of Qantas
airways shows that company is able is not able to generate enough returns on assets as
compare to industry, which has 4.47% ROA (Lopes, Ferraz & Rodrigues, 2016).
⊘ This is a preview!⊘
Do you want full access?
Subscribe today to unlock all pages.
Trusted by 1+ million students worldwide
3FINANCIAL ANALYSIS
Return on Assets (Profit / Average total assets) 980 853
27257.5 27257.5
3.60% 3.13%
Return on equity of the company is calculated for measuring the financial
performance of the company. It helps in measuring the rate of return, which is received by the
shareholders on their shareholdings. The ROE of the company shows that shareholders of the
company are getting good rate of return on their shareholdings as compare to the industry,
which has low ROE of 10.64 % (Perrott, 2015).
Return on Equity (Profit / Average equity) 980 853
5729 3540
17.11% 24.10%
Earnings per share of the company are that portion of the profit of the company is
distributed among the each shares of the common stock. It shows the profitability of the
company. The EPS of the company has increased over the years from $46m to $56m. It
shows immense growth (Whyte & Lohmann, 2015).
Earnings per share Profit for shareholders / Number of ordinary shares 56 46
EPS taken from annual report
The current ratio of the company measures the liquidity as well as efficiency of the
company in paying short-term liabilities. The liquidity position of the company is almost
same over the year 2018 and 2017 that is 0.49 and 0.44 as compare to the liquidity position of
the industry whose liquidly position is 1.19 which is better than this airway (Teker, Teker &
Güner, 2016).
Current Ratio Total current assets / Total current liabilities 3712 3119
7596 7095
0.49 0.44
Paraphrase This Document
Need a fresh take? Get an instant paraphrase of this document with our AI Paraphraser
4FINANCIAL ANALYSIS
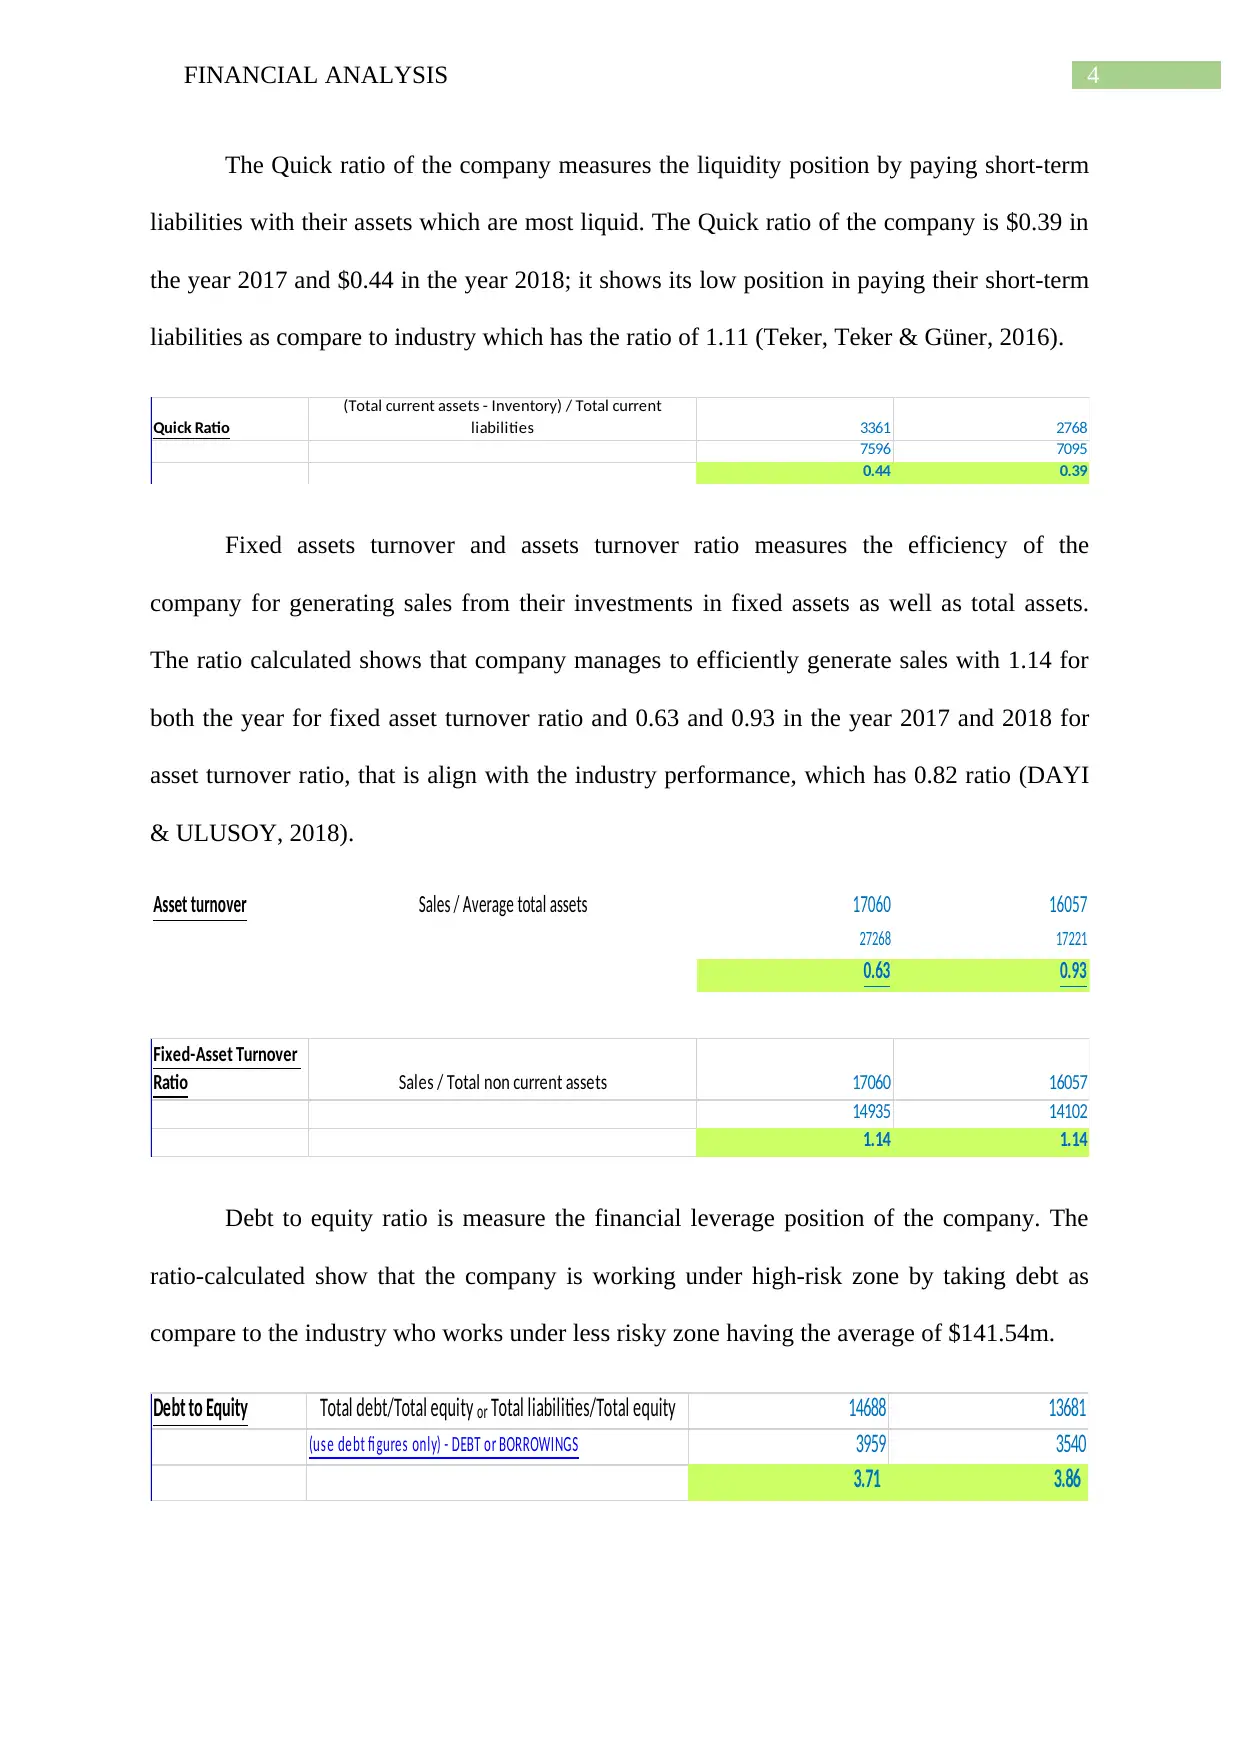
The Quick ratio of the company measures the liquidity position by paying short-term
liabilities with their assets which are most liquid. The Quick ratio of the company is $0.39 in
the year 2017 and $0.44 in the year 2018; it shows its low position in paying their short-term
liabilities as compare to industry which has the ratio of 1.11 (Teker, Teker & Güner, 2016).
Quick Ratio
(Total current assets - Inventory) / Total current
liabilities 3361 2768
7596 7095
0.44 0.39
Fixed assets turnover and assets turnover ratio measures the efficiency of the
company for generating sales from their investments in fixed assets as well as total assets.
The ratio calculated shows that company manages to efficiently generate sales with 1.14 for
both the year for fixed asset turnover ratio and 0.63 and 0.93 in the year 2017 and 2018 for
asset turnover ratio, that is align with the industry performance, which has 0.82 ratio (DAYI
& ULUSOY, 2018).
Asset turnover Sales / Average total assets 17060 16057
27268 17221
0.63 0.93
Fixed-Asset Turnover
Ratio Sales / Total non current assets 17060 16057
14935 14102
1.14 1.14
Debt to equity ratio is measure the financial leverage position of the company. The
ratio-calculated show that the company is working under high-risk zone by taking debt as
compare to the industry who works under less risky zone having the average of $141.54m.
Debt to Equity Total debt/Total equity or Total liabilities/Total equity 14688 13681
(us e debt fi gures only) - DEBT or BORROWINGS 3959 3540
3.71 3.86
5FINANCIAL ANALYSIS
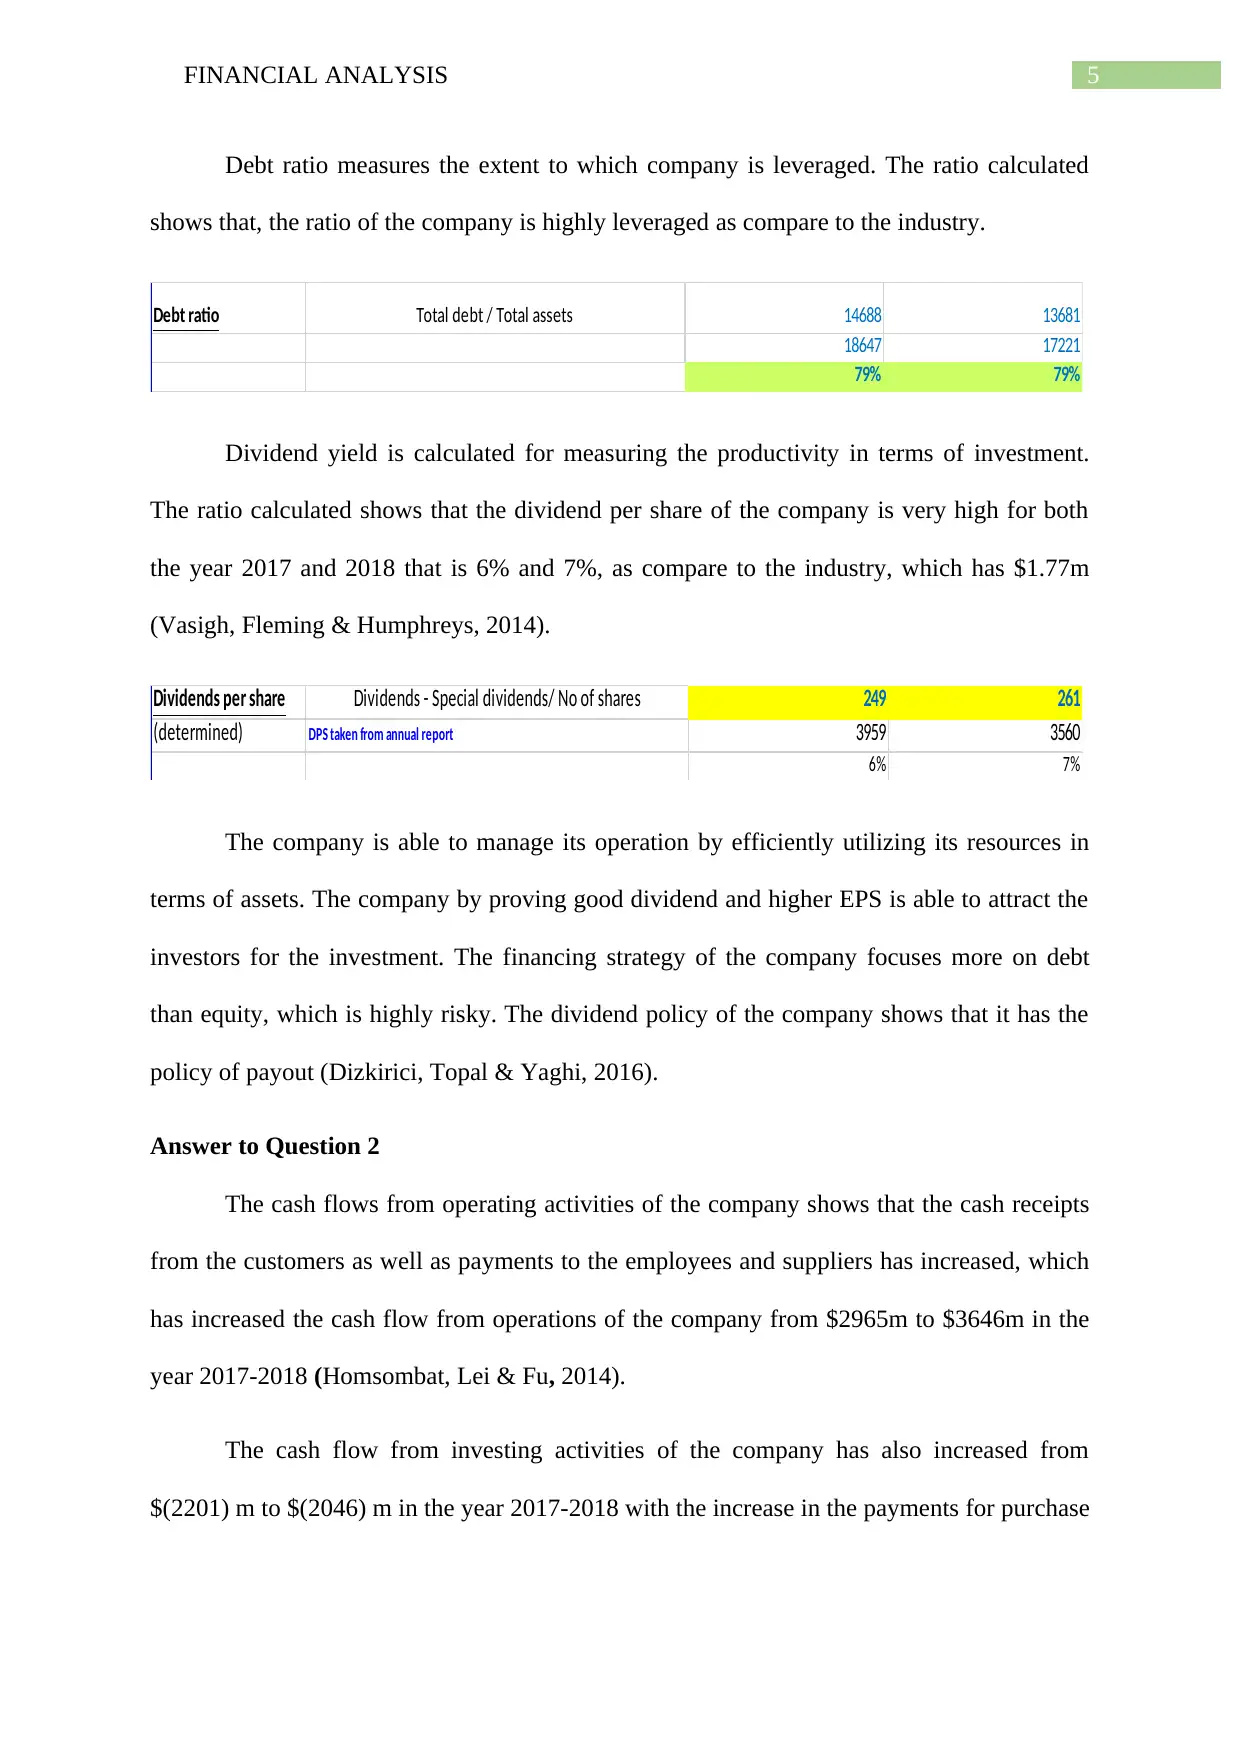
Debt ratio measures the extent to which company is leveraged. The ratio calculated
shows that, the ratio of the company is highly leveraged as compare to the industry.
Debt ratio Total debt / Total assets 14688 13681
18647 17221
79% 79%
Dividend yield is calculated for measuring the productivity in terms of investment.
The ratio calculated shows that the dividend per share of the company is very high for both
the year 2017 and 2018 that is 6% and 7%, as compare to the industry, which has $1.77m
(Vasigh, Fleming & Humphreys, 2014).
Dividends per share Dividends - Special dividends/ No of shares 249 261
(determined) DPS taken from annual report 3959 3560
6% 7%
The company is able to manage its operation by efficiently utilizing its resources in
terms of assets. The company by proving good dividend and higher EPS is able to attract the
investors for the investment. The financing strategy of the company focuses more on debt
than equity, which is highly risky. The dividend policy of the company shows that it has the
policy of payout (Dizkirici, Topal & Yaghi, 2016).
Answer to Question 2
The cash flows from operating activities of the company shows that the cash receipts
from the customers as well as payments to the employees and suppliers has increased, which
has increased the cash flow from operations of the company from $2965m to $3646m in the
year 2017-2018 (Homsombat, Lei & Fu, 2014).
The cash flow from investing activities of the company has also increased from
$(2201) m to $(2046) m in the year 2017-2018 with the increase in the payments for purchase
⊘ This is a preview!⊘
Do you want full access?
Subscribe today to unlock all pages.
Trusted by 1+ million students worldwide
6FINANCIAL ANALYSIS
of fixed assets and decrease in the lease financing of the aircraft shows (Yang & Baasandorj,
2017).
The cash flow from financing activities of the company shows that the cash flows has
increased from $(854) m to $(1296) in the year 2017-2018. Cash outflow was because of the
payments for share buy-back, treasury shares, repayments o borrowings and dividend being
paid to shareholders.
The company follows the accounting principle of revenue recognition. The overall
analysis of the cash from operating, investing and financing activities shows that, company
has good management in utilizing their revenue for the payments to their suppliers and
payments for the growth of the organization with the investment in the plant and machinery
and financing in the buyback, repayments and payout of the dividend. It is liquid enough for
generating and meeting short-term obligations (de Boer, 2018).
Answer to Question 3
The revenue of the company has increased to 5.8% from $16,057m to $17,060m in
the year 2017 to 2018 with the increase in the expenditure of the company to 5.1%, from
$14,687m to $15,487m. The EPS of the company has also increased to 17.85% from $46m to
$56m. The current assets of the company have increased to 15.97% from $3,119m to
$3,712m with increase in the current liabilities to 6.59%, which is from $7,095m to $7,596m
(Qantas Investors | Investor Centre., 2019). The total assets of the company have increased to
7.64% from $17,221m to $18,647m and total liabilities have increased to 6.85% from
$13,681m to $14,688m. The shareholders fund of the company has increased to 10.58% from
$3,540m to $3,959m. The working capital of the company has decreased to 2.31% from
$3,976m to $3,884m in the year 2017 to 2018. It shows that, company is not liquid enough to
Paraphrase This Document
Need a fresh take? Get an instant paraphrase of this document with our AI Paraphraser
7FINANCIAL ANALYSIS
meet its day-to-day operations, as they are more relying on the debt. They are working under
highly risk factor (Qantas Investors | Investor Centre., 2019).
The company is able to utilize their fixed assets efficiently, which is giving good
turnover in terms of revenue from its sales. The performance of the company in terms of
return on assets as well as return on equity is performing well in align and more than what
industry is performing. However, the liquidity position of the company is not so good for
meeting the short-term liabilities. Moreover, company is able to adopt the payout policy for
the shareholders, which is the sign of good financial position of the company. Therefore, it
can be said that, Qantas airlines is in good financial position, which ultimately leads towards
of financial performance (Qantas Investors | Investor Centre., 2019).
Answer to Question 4
It has been find that due to rising in the cost and fuel prices has influenced the earning
of the company. The airline’s biggest expense is the expense of fuel bill, which is expected to
raise by 21 percent. The leases of aircraft and wages have also raised. The cost have raised
also due to inflation that resulted into the down of the stock price. Even though Qantas
airlines has managed to earn annual profit. Recommendations that should be given to
executives of the Qantas airlines is that, they should try to reduce the cost of their expenses,
which will enhance more profitability of the company and resulted into the less reliance of
the debt from outside and more reliance on internal sources financing (Aydemir & Haytural,
2016).
Answer to Question 5
The liberal policy settings of the aviation with the Australian economy strength in
relation to strong dollar od Australia and weakness of global economy have attracted many
competitors offshore in the market of Australian international aviation that includes airlines
8FINANCIAL ANALYSIS
of state sponsored. Qantas airlines are making key strategic partnerships by maintaining
strong focus on the cost of the company. The company is committed for presenting true and
fair reporting of the financial statements (Hanaoka et al., 2014). It has been find that
commercial planning as well as strategy of the company has took the company to the new
heights. The team of finance and strategy has driven the competitive advantages by their
financial services with respond to the changes and uncertainty for maintaining their
leadership position. The values of the company supports the strategic vision by being one of
the ‘World’s best low fares’. Hence, the financial policy of the company supports strategy of
the company (Klettner, Clarke & Boersma, 2014).
Conclusion
Hence, it is concluded from the analysis that the Qantas Airlines have managed to
deliver the sustainable competitive advantage with the help of effective and efficient financial
services. The company has maintained leadership position by maintaining accountability as
well as financial control. Therefore, discussion has been done on the key financial ratios in
respect of the operating and investment management as well as financial strategy. In addition,
discussion has been done on the operating, investing as well as financing activities. Further,
discussion has been done on the overall financial performance and position of the company,
which is quite good and achieved major popularity worldwide. The recommendations that
have been given are reduction of the cost of the company operations. Lastly, discussion has
been done on whether the financial policy of the company supports their strategy of the
company or not. It has been analyzed that the financial reporting of the company is align with
their strategy.
⊘ This is a preview!⊘
Do you want full access?
Subscribe today to unlock all pages.
Trusted by 1+ million students worldwide
9FINANCIAL ANALYSIS
Reference
Aydemir, R., & Haytural, C. (2016). The effects of low cost carrier entry in the Turkish
Airline industry. Eurasian Economic Review, 6(1), 111-124.
DAYI, F., & ULUSOY, T. (2018). EVALUATING FINANCIAL PERFORMANCE WITH
MINIMUM SPANNING TREE APPROACH: AN APPLICATION IN AIRLINES
COMPANIES. Electronic Turkish Studies, 13(30).
de Boer, E. R. (2018). The Economics and Accounting of Frequent Flyer Programs.
In Strategy in Airline Loyalty (pp. 115-140). Palgrave Macmillan, Cham.
Dizkirici, A. S., Topal, B., & Yaghi, H. (2016). Analyzing The Relationship Between
Profitability and Traditional Ratios: Major Airline Companies Sample (Karlilik ve
Geleneksel Oranlar Arasindaki Iliskinin Incelenmesi: Büyük Havayolu Sirketleri
Örnegi) 1. Journal of Accounting, Finance and Auditing Studies, 2(2), 96.
Hanaoka, S., Takebayashi, M., Ishikura, T., & Saraswati, B. (2014). Low-cost carriers versus
full service carriers in ASEAN: The impact of liberalization policy on
competition. Journal of Air Transport Management, 40, 96-105.
Paraphrase This Document
Need a fresh take? Get an instant paraphrase of this document with our AI Paraphraser

10FINANCIAL ANALYSIS
Homsombat, W., Lei, Z., & Fu, X. (2014). Competitive effects of the airlines-within-airlines
strategy–Pricing and route entry patterns. Transportation Research Part E: Logistics
and Transportation Review, 63, 1-16.
Klettner, A., Clarke, T., & Boersma, M. (2014). The governance of corporate sustainability:
Empirical insights into the development, leadership and implementation of
responsible business strategy. Journal of Business Ethics, 122(1), 145-165.
Lopes, I. T., Ferraz, D. P., & Rodrigues, A. M. G. (2016). The drivers of profitability in the
top 30 major airlines worldwide. Measuring Business Excellence, 20(2), 26-37.
Perrott, B.E., 2015. Building the sustainable organization: an integrated approach. Journal of
Business Strategy, 36(1), pp.41-51.
Qantas Investors | Investor Centre. (2019). Investor.qantas.com. Retrieved 15 April 2019,
from https://investor.qantas.com/investors/?page=annual-reports
Teker, S., Teker, D., & Güner, A. (2016). Financial performance of top 20 airlines. Procedia-
Social and Behavioral Sciences, 235, 603-610.
Vasigh, B., Fleming, K., & Humphreys, B. (2014). Foundations of airline finance:
Methodology and practice. Routledge.
Whyte, R., & Lohmann, G. (2015). The carrier-within-a-carrier strategy: An analysis of
Jetstar. Journal of Air Transport Management, 42, 141-148.
Yang, A. S., & Baasandorj, S. (2017). Exploring CSR and financial performance of full-
service and low-cost air carriers. Finance Research Letters, 23, 291-299.
1 out of 11
Related Documents


Your All-in-One AI-Powered Toolkit for Academic Success.
+13062052269
info@desklib.com
Available 24*7 on WhatsApp / Email
![[object Object]](/_next/static/media/star-bottom.7253800d.svg)
Unlock your academic potential
Copyright © 2020–2026 A2Z Services. All Rights Reserved. Developed and managed by ZUCOL.