Qantas & Air New Zealand: A Financial Case Study (2015-2017)
VerifiedAdded on 2023/04/21
|24
|4920
|133
Case Study
AI Summary
This financial case study provides an in-depth analysis of the financial conditions of Qantas Airways and Air New Zealand Limited between 2015 and 2017. It utilizes ratio analysis to evaluate their liquidity, solvency, and profitability, identifying issues such as liquidity problems, high financial leverage, and lower return on assets. The study examines key financial ratios including current ratio, quick ratio, accounts receivable turnover, number of days’ sales in receivables, inventory turnover, debt to assets ratio, debt to equity ratio, and profit margin ratio. Graphs and tables are used to illustrate the findings and compare the performance of the two airlines. The report concludes with recommendations to address the identified financial challenges, such as increasing the selling price to improve financial stability.

Running head: FINANCIAL CASE STUDY
Financial Case Study
Name of the Student:
Name of the University:
Author’s Note:
Course ID:
Financial Case Study
Name of the Student:
Name of the University:
Author’s Note:
Course ID:
Paraphrase This Document
Need a fresh take? Get an instant paraphrase of this document with our AI Paraphraser
1
FINANCIAL CASE STUDY
Executive Summary:
The current report would intend to analyse the financial condition of two popular airline
companies operating in the aviation industry of Australia. Therefore, the airlines selected for
meeting the purpose of this report include Qantas Airways and Air New Zealand Limited. It
could be found that both Qantas Airways and Air New Zealand suffer from various financial
issues, which are evaluated from various calculated financial ratios. It has been observed that the
airlines suffer primarily from liquidity issues, high financial leverage issues and lower return on
assets. Some of the notable issues include liquidity problems, issues related to increased financial
leverage and lower return on assets. Certain recommendations have been provided to deal with
these identified issues; however, each alternative has its own pros and cons. However, out of the
provided recommendations, increasing the selling price is mainly necessary for dealing with the
financial troubles in the initial stage.
2
FINANCIAL CASE STUDY
Table of Contents
Introduction:....................................................................................................................................3
Findings:..........................................................................................................................................3
Discussions:...................................................................................................................................17
Conclusion:....................................................................................................................................19
Recommendation and implementation:.........................................................................................19
References:....................................................................................................................................21
⊘ This is a preview!⊘
Do you want full access?
Subscribe today to unlock all pages.
Trusted by 1+ million students worldwide
3
FINANCIAL CASE STUDY
Introduction:
The current report would intend to analyse the financial condition of two popular airline
companies operating in the aviation industry of Australia. Therefore, the airlines selected for
meeting the purpose of this report include Qantas Airways and Air New Zealand Limited. Qantas
is considered as the Australian flag carrier and the biggest airline in terms of fleet size, global
flights and global destinations (Qantas.com, 2019). On the other hand, Air New Zealand is the
flag carrier airline of New Zealand operating in 19 global nations (Airnewzealand.com.au, 2019).
For conducting the financial analysis of the two chosen airlines, ratio analysis tool is used for
evaluating their performance in the operating markets. Finally, based on the valuation of ratios
and financial conditions, appropriate recommendations would have been provided in order to
improve their overall financial conditions.
Findings:
For analysing the financial conditions of Qantas Airways and Air New Zealand, various
financial ratios have been taken into consideration, which are described in details and the
findings are enumerated as follows:
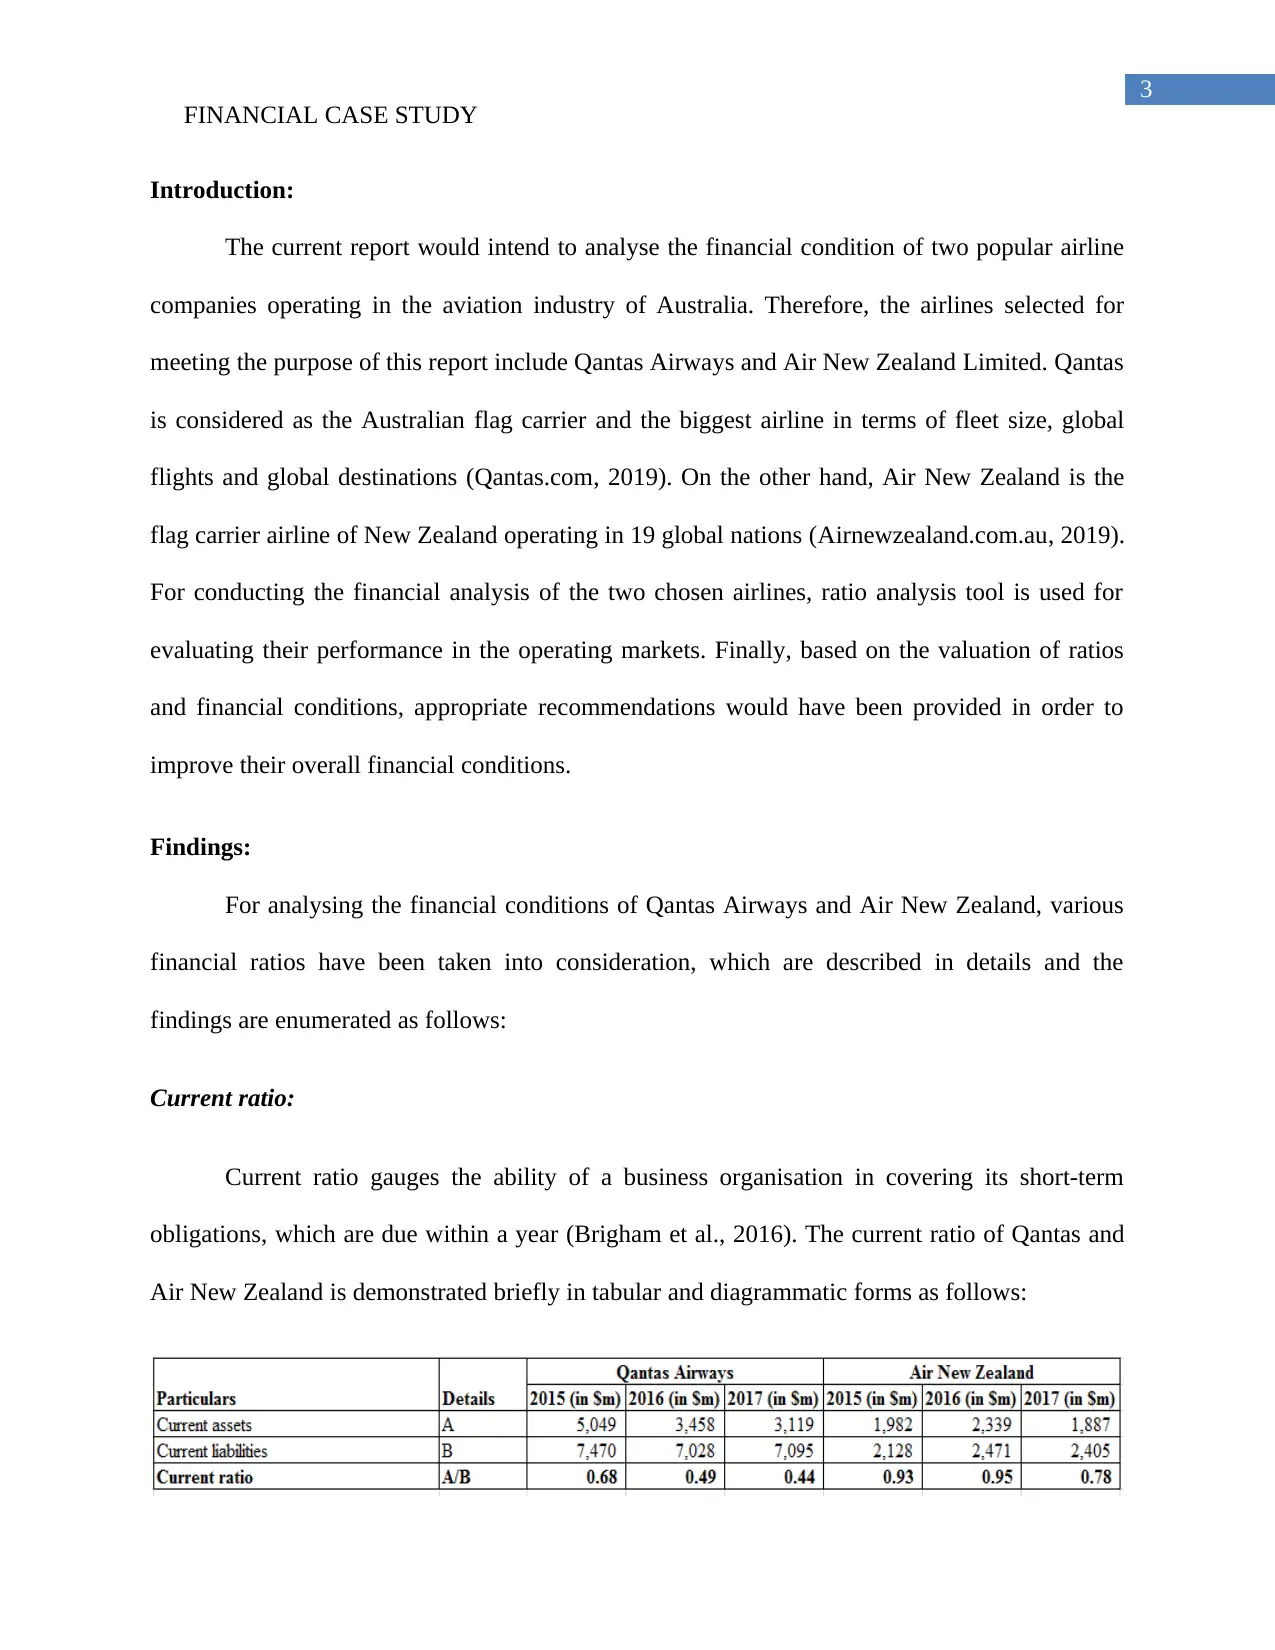
Current ratio:
Current ratio gauges the ability of a business organisation in covering its short-term
obligations, which are due within a year (Brigham et al., 2016). The current ratio of Qantas and
Air New Zealand is demonstrated briefly in tabular and diagrammatic forms as follows:
FINANCIAL CASE STUDY
Introduction:
The current report would intend to analyse the financial condition of two popular airline
companies operating in the aviation industry of Australia. Therefore, the airlines selected for
meeting the purpose of this report include Qantas Airways and Air New Zealand Limited. Qantas
is considered as the Australian flag carrier and the biggest airline in terms of fleet size, global
flights and global destinations (Qantas.com, 2019). On the other hand, Air New Zealand is the
flag carrier airline of New Zealand operating in 19 global nations (Airnewzealand.com.au, 2019).
For conducting the financial analysis of the two chosen airlines, ratio analysis tool is used for
evaluating their performance in the operating markets. Finally, based on the valuation of ratios
and financial conditions, appropriate recommendations would have been provided in order to
improve their overall financial conditions.
Findings:
For analysing the financial conditions of Qantas Airways and Air New Zealand, various
financial ratios have been taken into consideration, which are described in details and the
findings are enumerated as follows:
Current ratio:
Current ratio gauges the ability of a business organisation in covering its short-term
obligations, which are due within a year (Brigham et al., 2016). The current ratio of Qantas and
Air New Zealand is demonstrated briefly in tabular and diagrammatic forms as follows:
Paraphrase This Document
Need a fresh take? Get an instant paraphrase of this document with our AI Paraphraser
4
FINANCIAL CASE STUDY
Table 1: Current ratio of Qantas Airways and Air New Zealand for the years 2015-2017
(Source: Investor.qantas.com, 2019: Airnewzealand.co.nz, 2019)
2015 2016 2017 2015 2016 2017
Qantas Airways Air New Zealand
-
0.10
0.20
0.30
0.40
0.50
0.60
0.70
0.80
0.90
1.00
0.68
0.49 0.44
0.93 0.95
0.78
Current ratio
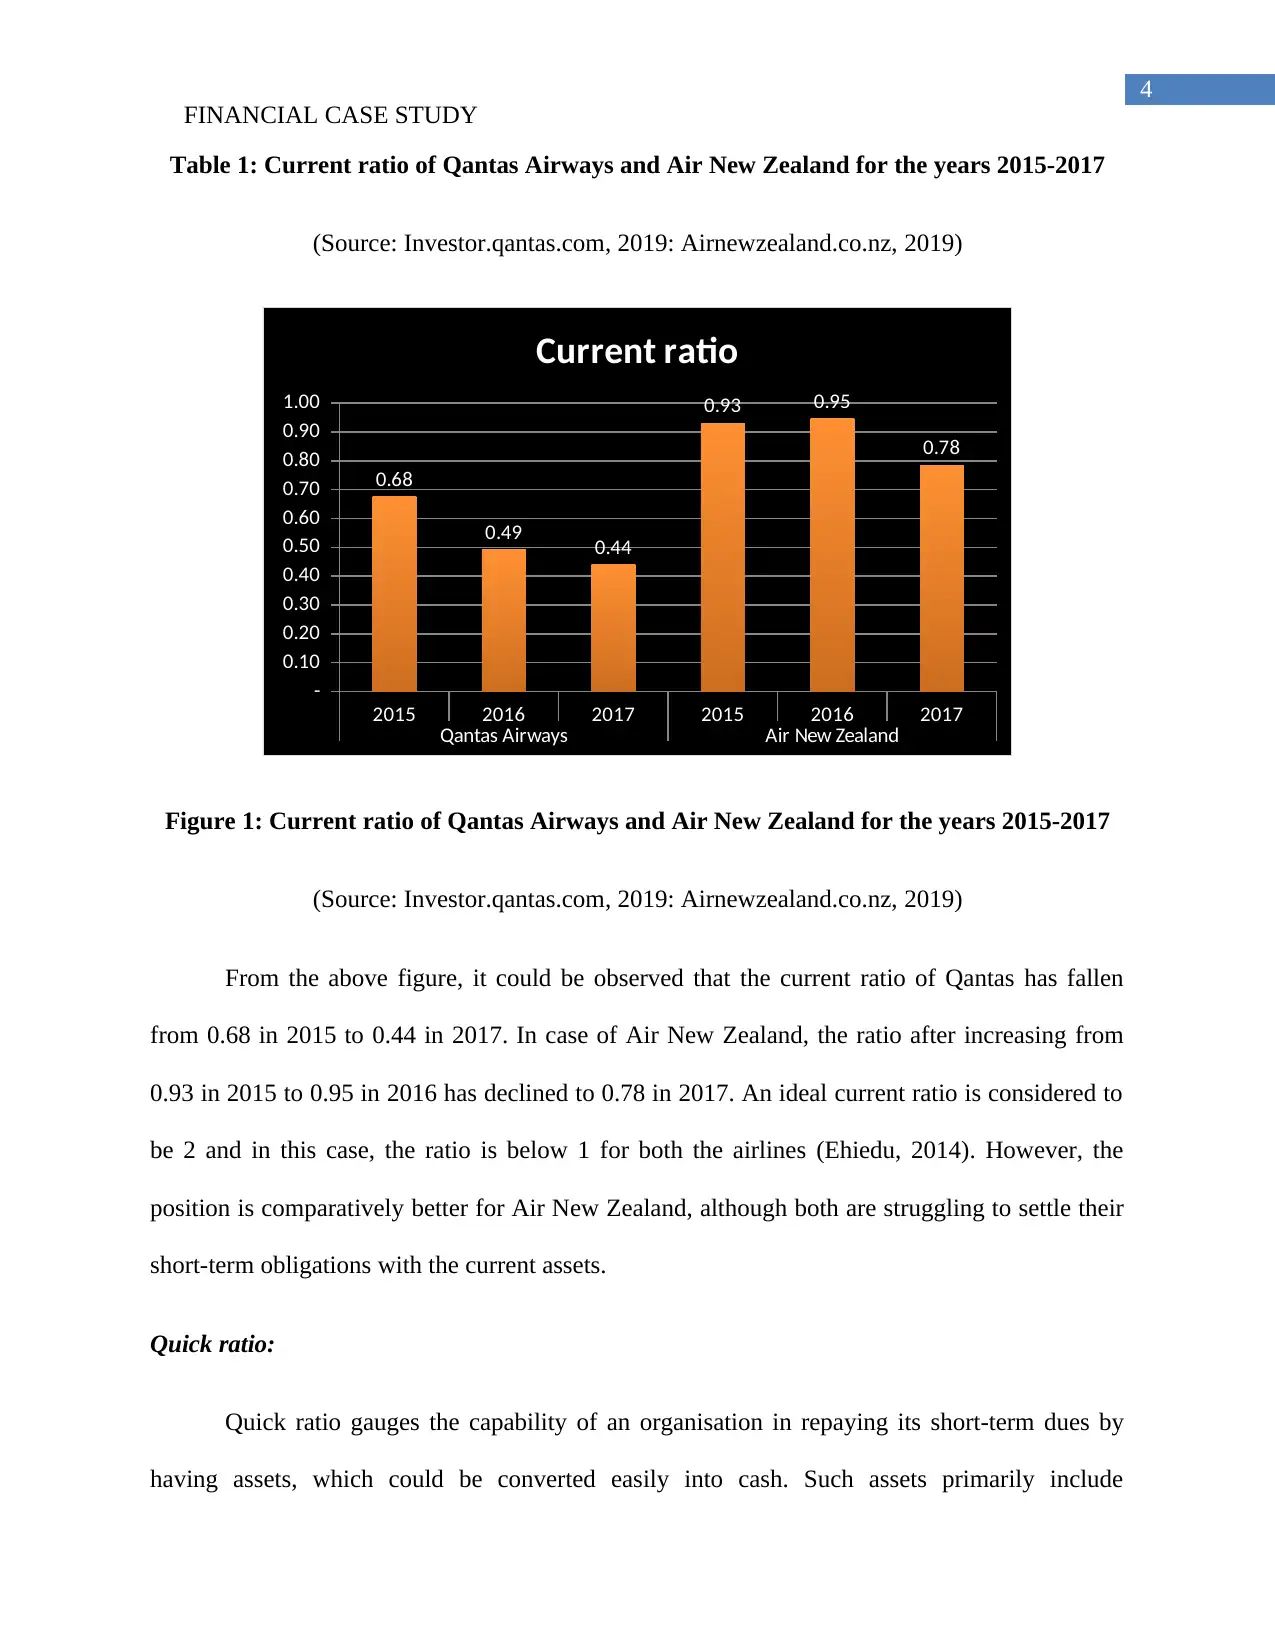
Figure 1: Current ratio of Qantas Airways and Air New Zealand for the years 2015-2017
(Source: Investor.qantas.com, 2019: Airnewzealand.co.nz, 2019)
From the above figure, it could be observed that the current ratio of Qantas has fallen
from 0.68 in 2015 to 0.44 in 2017. In case of Air New Zealand, the ratio after increasing from
0.93 in 2015 to 0.95 in 2016 has declined to 0.78 in 2017. An ideal current ratio is considered to
be 2 and in this case, the ratio is below 1 for both the airlines (Ehiedu, 2014). However, the
position is comparatively better for Air New Zealand, although both are struggling to settle their
short-term obligations with the current assets.
Quick ratio:
Quick ratio gauges the capability of an organisation in repaying its short-term dues by
having assets, which could be converted easily into cash. Such assets primarily include
FINANCIAL CASE STUDY
Table 1: Current ratio of Qantas Airways and Air New Zealand for the years 2015-2017
(Source: Investor.qantas.com, 2019: Airnewzealand.co.nz, 2019)
2015 2016 2017 2015 2016 2017
Qantas Airways Air New Zealand
-
0.10
0.20
0.30
0.40
0.50
0.60
0.70
0.80
0.90
1.00
0.68
0.49 0.44
0.93 0.95
0.78
Current ratio
Figure 1: Current ratio of Qantas Airways and Air New Zealand for the years 2015-2017
(Source: Investor.qantas.com, 2019: Airnewzealand.co.nz, 2019)
From the above figure, it could be observed that the current ratio of Qantas has fallen
from 0.68 in 2015 to 0.44 in 2017. In case of Air New Zealand, the ratio after increasing from
0.93 in 2015 to 0.95 in 2016 has declined to 0.78 in 2017. An ideal current ratio is considered to
be 2 and in this case, the ratio is below 1 for both the airlines (Ehiedu, 2014). However, the
position is comparatively better for Air New Zealand, although both are struggling to settle their
short-term obligations with the current assets.
Quick ratio:
Quick ratio gauges the capability of an organisation in repaying its short-term dues by
having assets, which could be converted easily into cash. Such assets primarily include
5
FINANCIAL CASE STUDY
marketable securities, cash and accounts receivable (Grant, 2016). The quick ratio of Qantas and
Air New Zealand is demonstrated briefly in tabular and diagrammatic forms as follows:
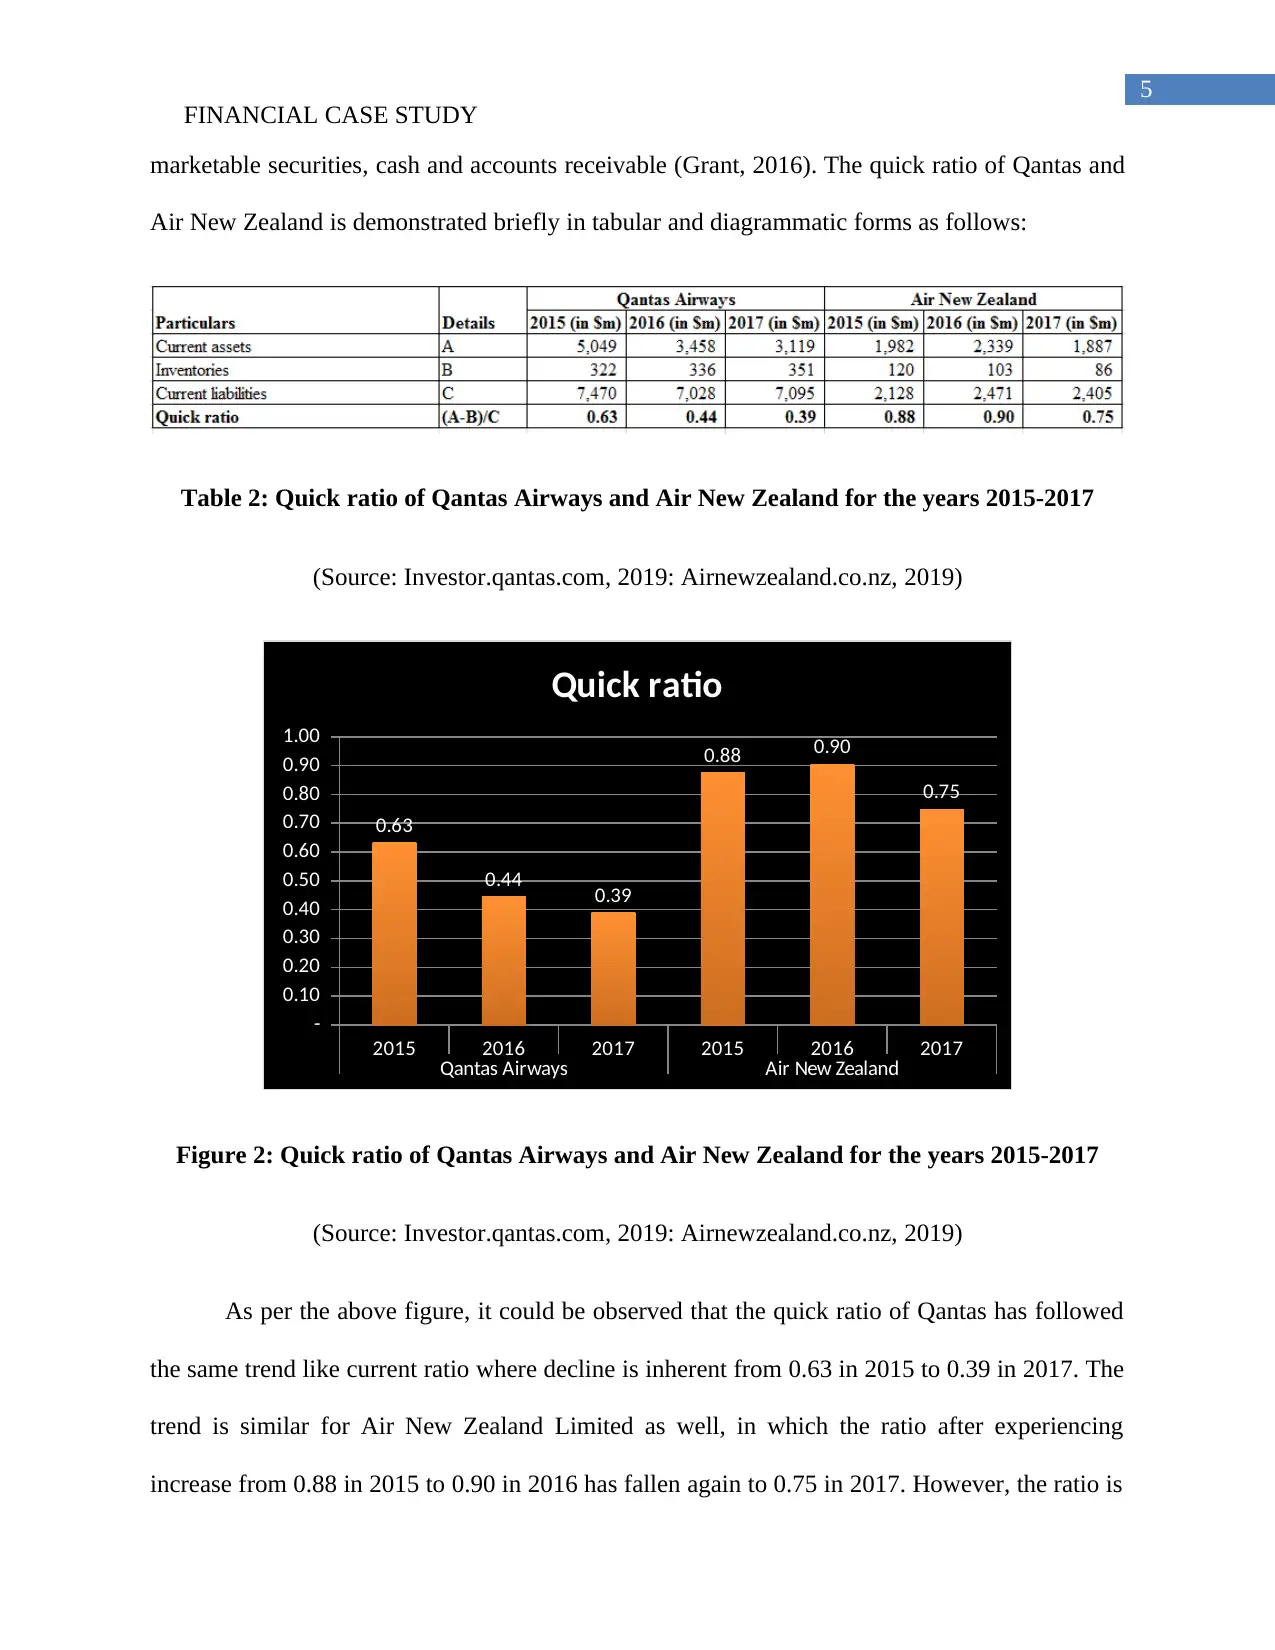
Table 2: Quick ratio of Qantas Airways and Air New Zealand for the years 2015-2017
(Source: Investor.qantas.com, 2019: Airnewzealand.co.nz, 2019)
2015 2016 2017 2015 2016 2017
Qantas Airways Air New Zealand
-
0.10
0.20
0.30
0.40
0.50
0.60
0.70
0.80
0.90
1.00
0.63
0.44 0.39
0.88 0.90
0.75
Quick ratio
Figure 2: Quick ratio of Qantas Airways and Air New Zealand for the years 2015-2017
(Source: Investor.qantas.com, 2019: Airnewzealand.co.nz, 2019)
As per the above figure, it could be observed that the quick ratio of Qantas has followed
the same trend like current ratio where decline is inherent from 0.63 in 2015 to 0.39 in 2017. The
trend is similar for Air New Zealand Limited as well, in which the ratio after experiencing
increase from 0.88 in 2015 to 0.90 in 2016 has fallen again to 0.75 in 2017. However, the ratio is
FINANCIAL CASE STUDY
marketable securities, cash and accounts receivable (Grant, 2016). The quick ratio of Qantas and
Air New Zealand is demonstrated briefly in tabular and diagrammatic forms as follows:
Table 2: Quick ratio of Qantas Airways and Air New Zealand for the years 2015-2017
(Source: Investor.qantas.com, 2019: Airnewzealand.co.nz, 2019)
2015 2016 2017 2015 2016 2017
Qantas Airways Air New Zealand
-
0.10
0.20
0.30
0.40
0.50
0.60
0.70
0.80
0.90
1.00
0.63
0.44 0.39
0.88 0.90
0.75
Quick ratio
Figure 2: Quick ratio of Qantas Airways and Air New Zealand for the years 2015-2017
(Source: Investor.qantas.com, 2019: Airnewzealand.co.nz, 2019)
As per the above figure, it could be observed that the quick ratio of Qantas has followed
the same trend like current ratio where decline is inherent from 0.63 in 2015 to 0.39 in 2017. The
trend is similar for Air New Zealand Limited as well, in which the ratio after experiencing
increase from 0.88 in 2015 to 0.90 in 2016 has fallen again to 0.75 in 2017. However, the ratio is
⊘ This is a preview!⊘
Do you want full access?
Subscribe today to unlock all pages.
Trusted by 1+ million students worldwide
6
FINANCIAL CASE STUDY
below the ideal standard of 1 for both airlines (Islam, 2014). In this case, the ratio for Air New
Zealand is close to the ideal standard, while Qantas is facing liquidity issues for clearing its
short-term obligations.
Accounts receivable turnover:
Accounts receivable turnover ratio assists in analysing the ability of an organisation to
issue credit to its customers effectively along with collecting funds from them within the
stipulated period (Jorge-Calderón, 2016). The accounts receivable turnover ratio of Qantas and
Air New Zealand is demonstrated briefly in tabular and diagrammatic forms as follows:
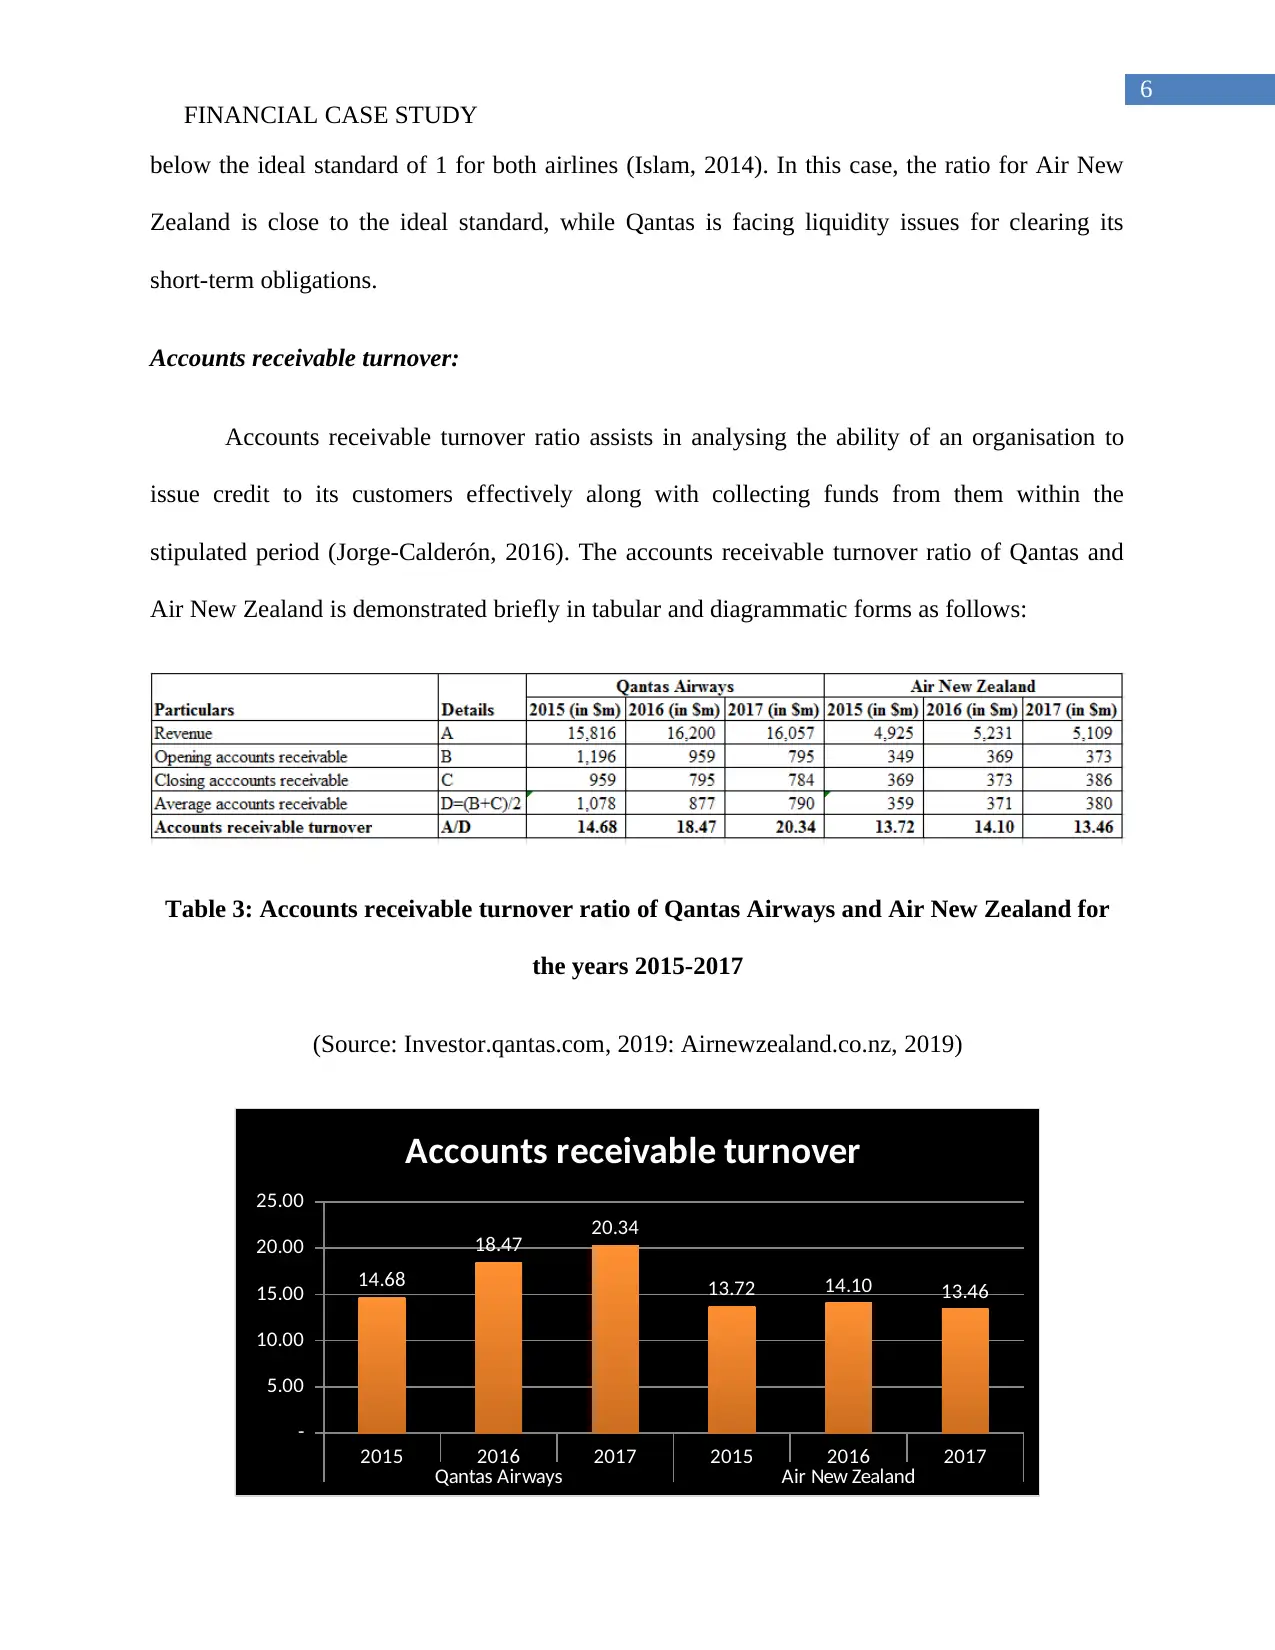
Table 3: Accounts receivable turnover ratio of Qantas Airways and Air New Zealand for
the years 2015-2017
(Source: Investor.qantas.com, 2019: Airnewzealand.co.nz, 2019)
2015 2016 2017 2015 2016 2017
Qantas Airways Air New Zealand
-
5.00
10.00
15.00
20.00
25.00
14.68
18.47 20.34
13.72 14.10 13.46
Accounts receivable turnover
FINANCIAL CASE STUDY
below the ideal standard of 1 for both airlines (Islam, 2014). In this case, the ratio for Air New
Zealand is close to the ideal standard, while Qantas is facing liquidity issues for clearing its
short-term obligations.
Accounts receivable turnover:
Accounts receivable turnover ratio assists in analysing the ability of an organisation to
issue credit to its customers effectively along with collecting funds from them within the
stipulated period (Jorge-Calderón, 2016). The accounts receivable turnover ratio of Qantas and
Air New Zealand is demonstrated briefly in tabular and diagrammatic forms as follows:
Table 3: Accounts receivable turnover ratio of Qantas Airways and Air New Zealand for
the years 2015-2017
(Source: Investor.qantas.com, 2019: Airnewzealand.co.nz, 2019)
2015 2016 2017 2015 2016 2017
Qantas Airways Air New Zealand
-
5.00
10.00
15.00
20.00
25.00
14.68
18.47 20.34
13.72 14.10 13.46
Accounts receivable turnover
Paraphrase This Document
Need a fresh take? Get an instant paraphrase of this document with our AI Paraphraser
7
FINANCIAL CASE STUDY
Figure 3: Accounts receivable turnover ratio of Qantas Airways and Air New Zealand for
the years 2015-2017
(Source: Investor.qantas.com, 2019: Airnewzealand.co.nz, 2019)
The above figure clearly states that the accounts receivable turnover ratio of Qantas has
increased from 14.68% in 2015 to 20.34 in 2017, while the same for Air New Zealand has
declined from 13.72% in 2015 to 13.46% in 2017. A higher turnover indicates that the
organisation has been generating sales at a faster rate, which is the case with Qantas, as opposed
to Air New Zealand. Hence, the position of Qantas is deemed to be favourable in terms of
accounts receivable turnover compared to Air New Zealand.
Number of days’ sales in receivables:
The number of days’ sales in receivables gauges the number of days it takes an
organisation in collecting cash from credit sales (Karwowski, 2016). The number of days’ sales
in receivables of Qantas and Air New Zealand is demonstrated briefly in tabular and
diagrammatic forms as follows:
Table 4: Number of days’ sales in receivables of Qantas Airways and Air New Zealand for
the years 2015-2017
(Source: Investor.qantas.com, 2019: Airnewzealand.co.nz, 2019)
8
FINANCIAL CASE STUDY
2015 2016 2017 2015 2016 2017
Qantas Airways Air New Zealand
-
5
10
15
20
25
30
25
20 18
27 26 27
Number of days' sales in receivables
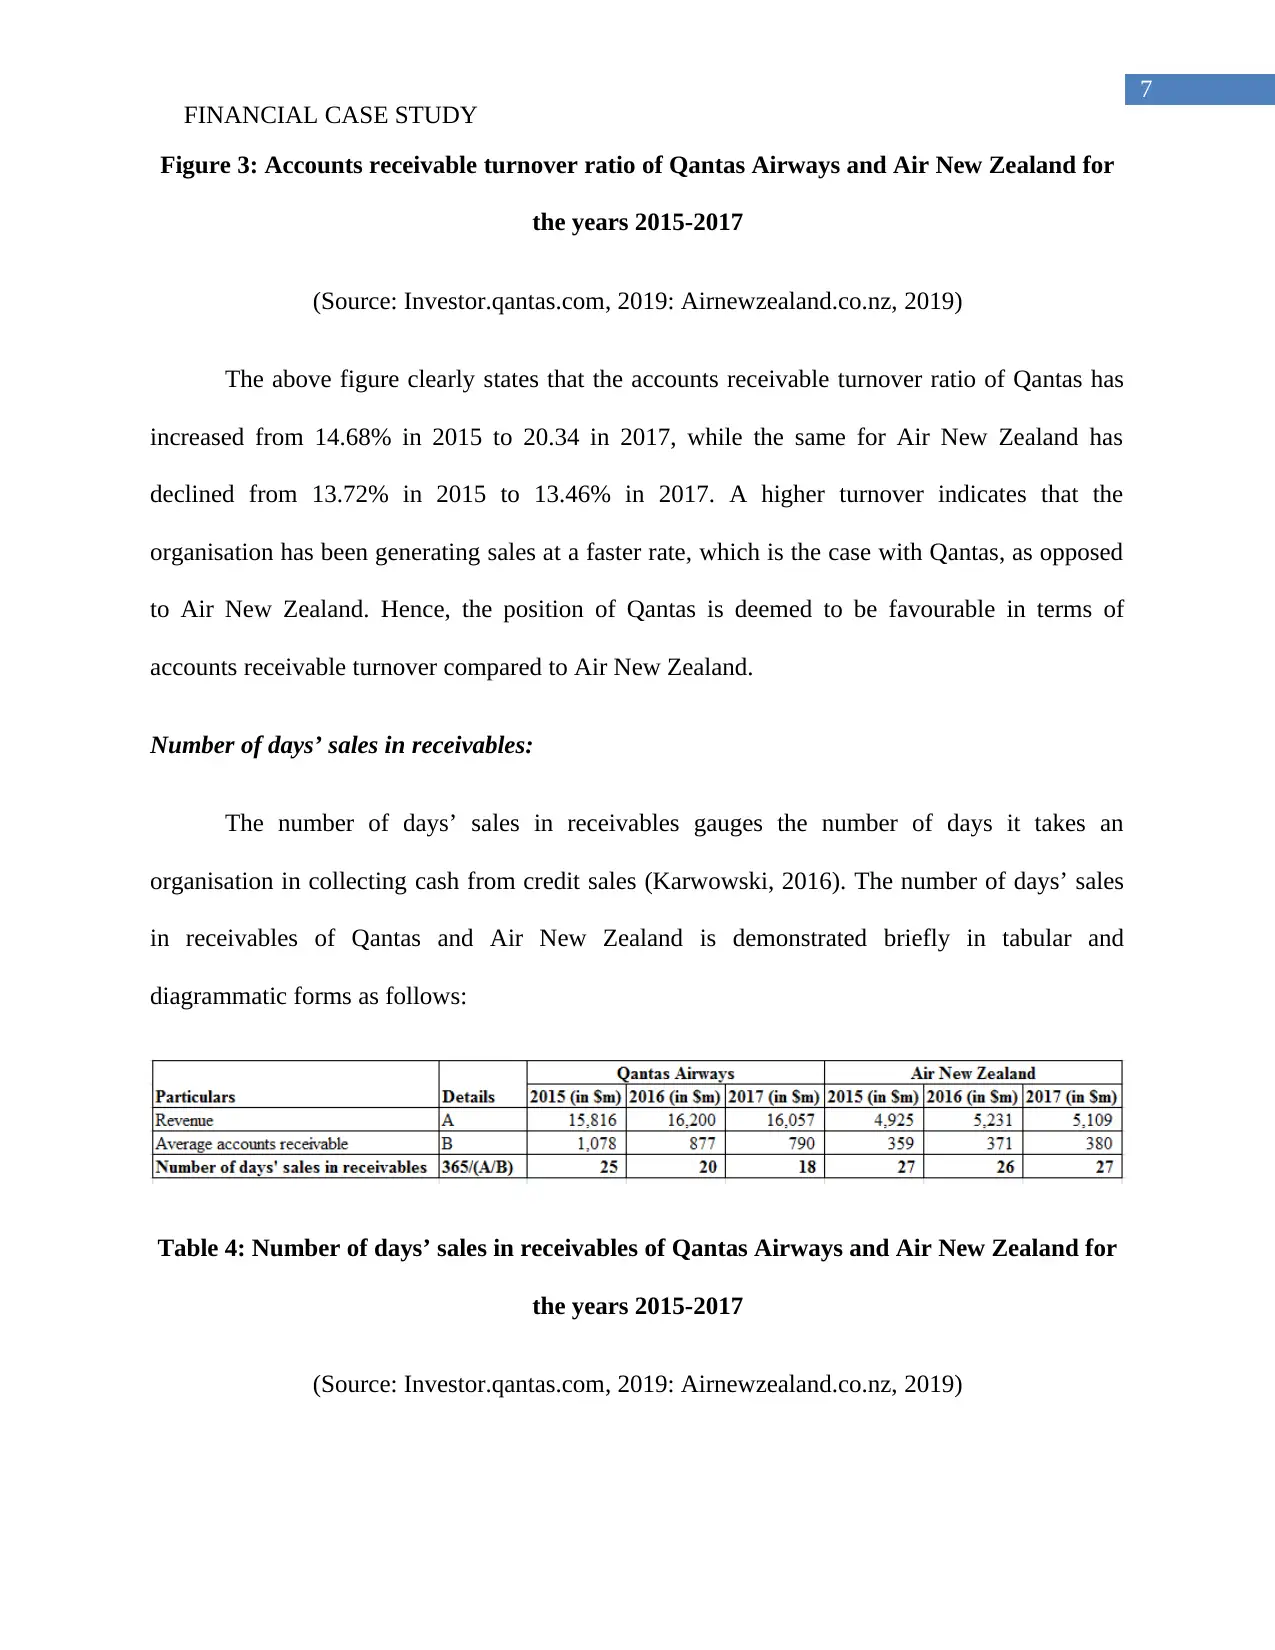
Figure 4: Number of days’ sales in receivables of Qantas Airways and Air New Zealand for
the years 2015-2017
(Source: Investor.qantas.com, 2019: Airnewzealand.co.nz, 2019)
From the above figure, it is evident that the number of days’ sales in receivables for
Qantas has declined from 25 days in 2015 to 18 days in 2017, while it has remained almost same
between 26 days and 27 days from 2015 to 2017. If the number of days’ receivables is lower, it
is desirable, since the organisation is collecting dues from its customers at a faster rate (Williams
& Dobelman, 2017). Thus, it denotes that Qantas is performing better than Air New Zealand in
collecting due amounts from its customers.
Inventory turnover:
Inventory turnover is an efficiency ratio, which denotes the number of times an
organisation has sold and replaced inventory during a stipulated timeframe (Marti, Puertas &
FINANCIAL CASE STUDY
2015 2016 2017 2015 2016 2017
Qantas Airways Air New Zealand
-
5
10
15
20
25
30
25
20 18
27 26 27
Number of days' sales in receivables
Figure 4: Number of days’ sales in receivables of Qantas Airways and Air New Zealand for
the years 2015-2017
(Source: Investor.qantas.com, 2019: Airnewzealand.co.nz, 2019)
From the above figure, it is evident that the number of days’ sales in receivables for
Qantas has declined from 25 days in 2015 to 18 days in 2017, while it has remained almost same
between 26 days and 27 days from 2015 to 2017. If the number of days’ receivables is lower, it
is desirable, since the organisation is collecting dues from its customers at a faster rate (Williams
& Dobelman, 2017). Thus, it denotes that Qantas is performing better than Air New Zealand in
collecting due amounts from its customers.
Inventory turnover:
Inventory turnover is an efficiency ratio, which denotes the number of times an
organisation has sold and replaced inventory during a stipulated timeframe (Marti, Puertas &
⊘ This is a preview!⊘
Do you want full access?
Subscribe today to unlock all pages.
Trusted by 1+ million students worldwide
9
FINANCIAL CASE STUDY
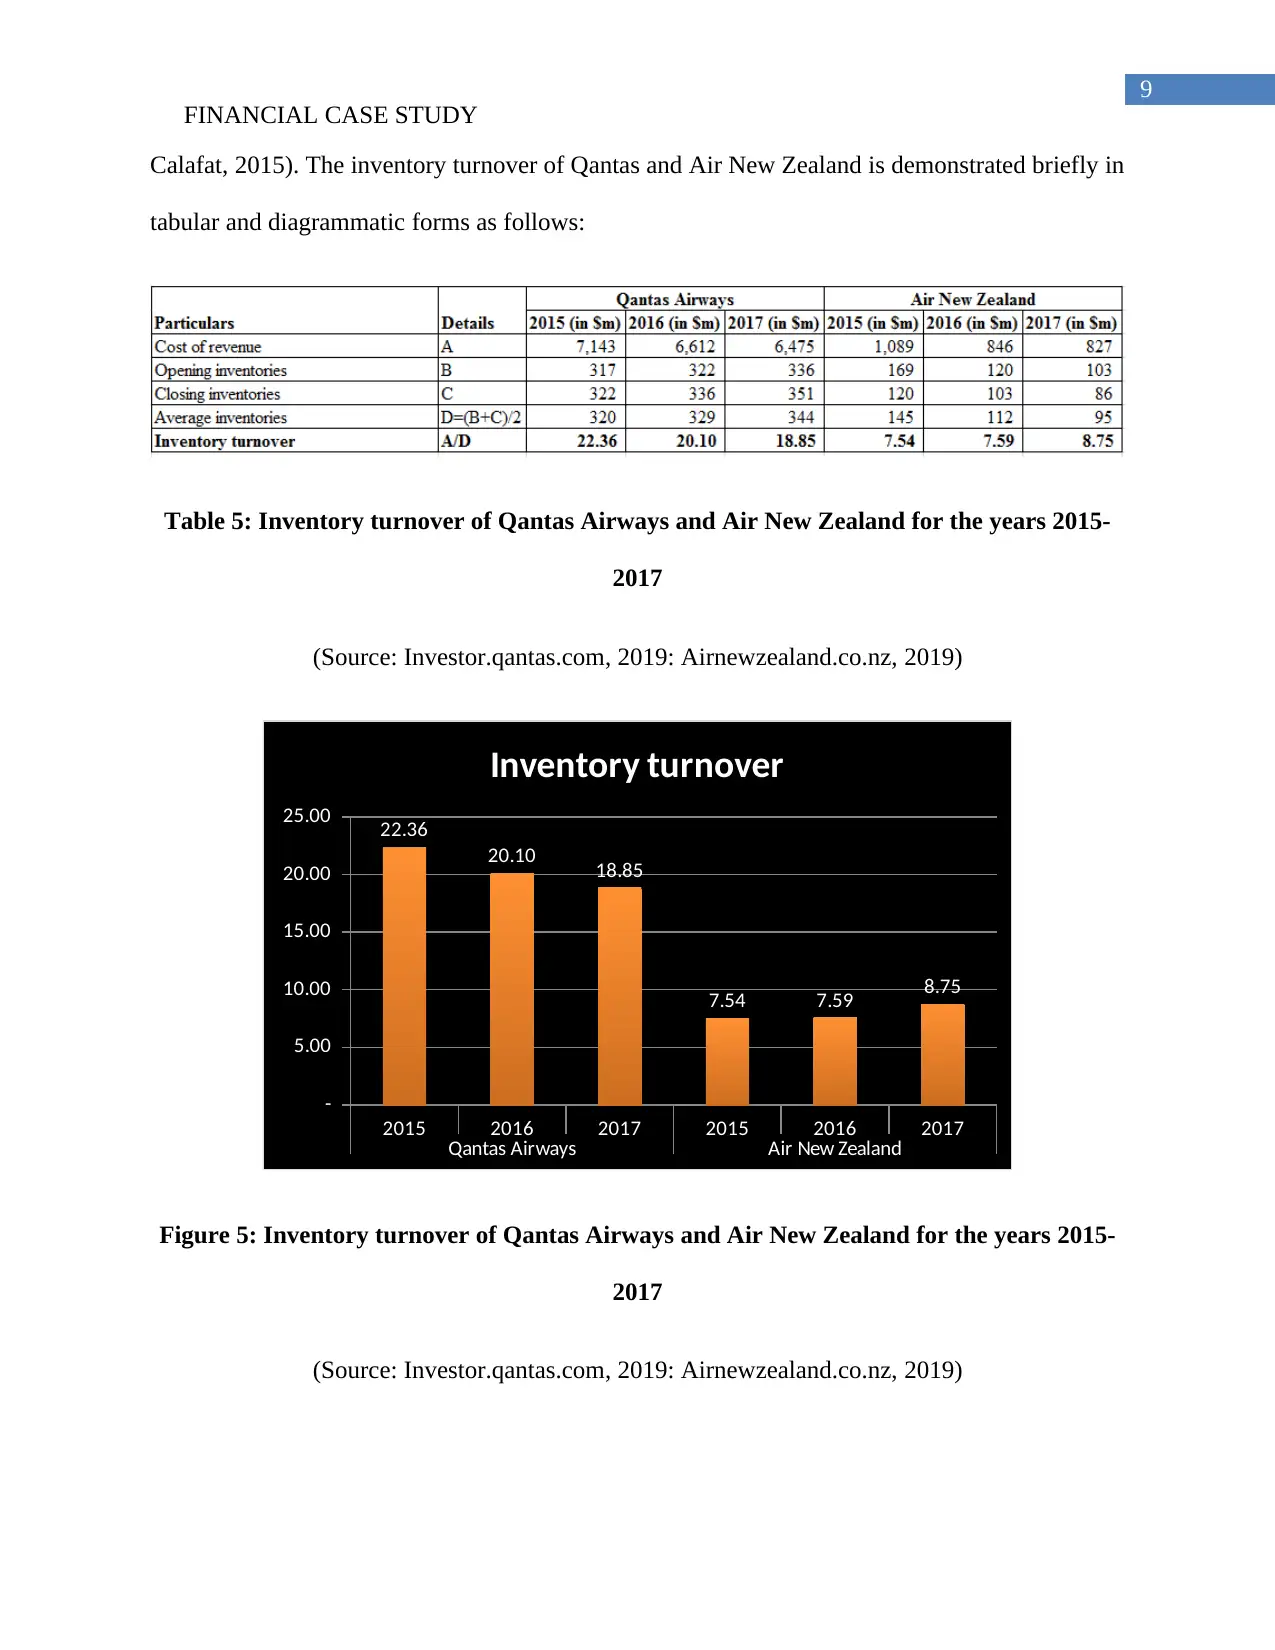
Calafat, 2015). The inventory turnover of Qantas and Air New Zealand is demonstrated briefly in
tabular and diagrammatic forms as follows:
Table 5: Inventory turnover of Qantas Airways and Air New Zealand for the years 2015-
2017
(Source: Investor.qantas.com, 2019: Airnewzealand.co.nz, 2019)
2015 2016 2017 2015 2016 2017
Qantas Airways Air New Zealand
-
5.00
10.00
15.00
20.00
25.00 22.36
20.10 18.85
7.54 7.59 8.75
Inventory turnover
Figure 5: Inventory turnover of Qantas Airways and Air New Zealand for the years 2015-
2017
(Source: Investor.qantas.com, 2019: Airnewzealand.co.nz, 2019)
FINANCIAL CASE STUDY
Calafat, 2015). The inventory turnover of Qantas and Air New Zealand is demonstrated briefly in
tabular and diagrammatic forms as follows:
Table 5: Inventory turnover of Qantas Airways and Air New Zealand for the years 2015-
2017
(Source: Investor.qantas.com, 2019: Airnewzealand.co.nz, 2019)
2015 2016 2017 2015 2016 2017
Qantas Airways Air New Zealand
-
5.00
10.00
15.00
20.00
25.00 22.36
20.10 18.85
7.54 7.59 8.75
Inventory turnover
Figure 5: Inventory turnover of Qantas Airways and Air New Zealand for the years 2015-
2017
(Source: Investor.qantas.com, 2019: Airnewzealand.co.nz, 2019)
Paraphrase This Document
Need a fresh take? Get an instant paraphrase of this document with our AI Paraphraser
10
FINANCIAL CASE STUDY
According to the above figure, it could be witnessed that the inventory turnover of Qantas
has declined from 22.36 times in 2015 to 18.85 times in 2017. On the other hand, the turnover of
Air New Zealand has increased from 7.54 times in 2015 to 8.75 times in 2017. A higher figure is
always desirable, since it indicates increased market demand, which causes the organisation to
release its stock at a quicker rate (Mayes, 2014). In this case, although the figure is falling over
the years for Qantas, it is still much higher compared to Air New Zealand. Hence, in terms of
inventory turnover, Qantas is having competitive edge over Air New Zealand in the global
markets.
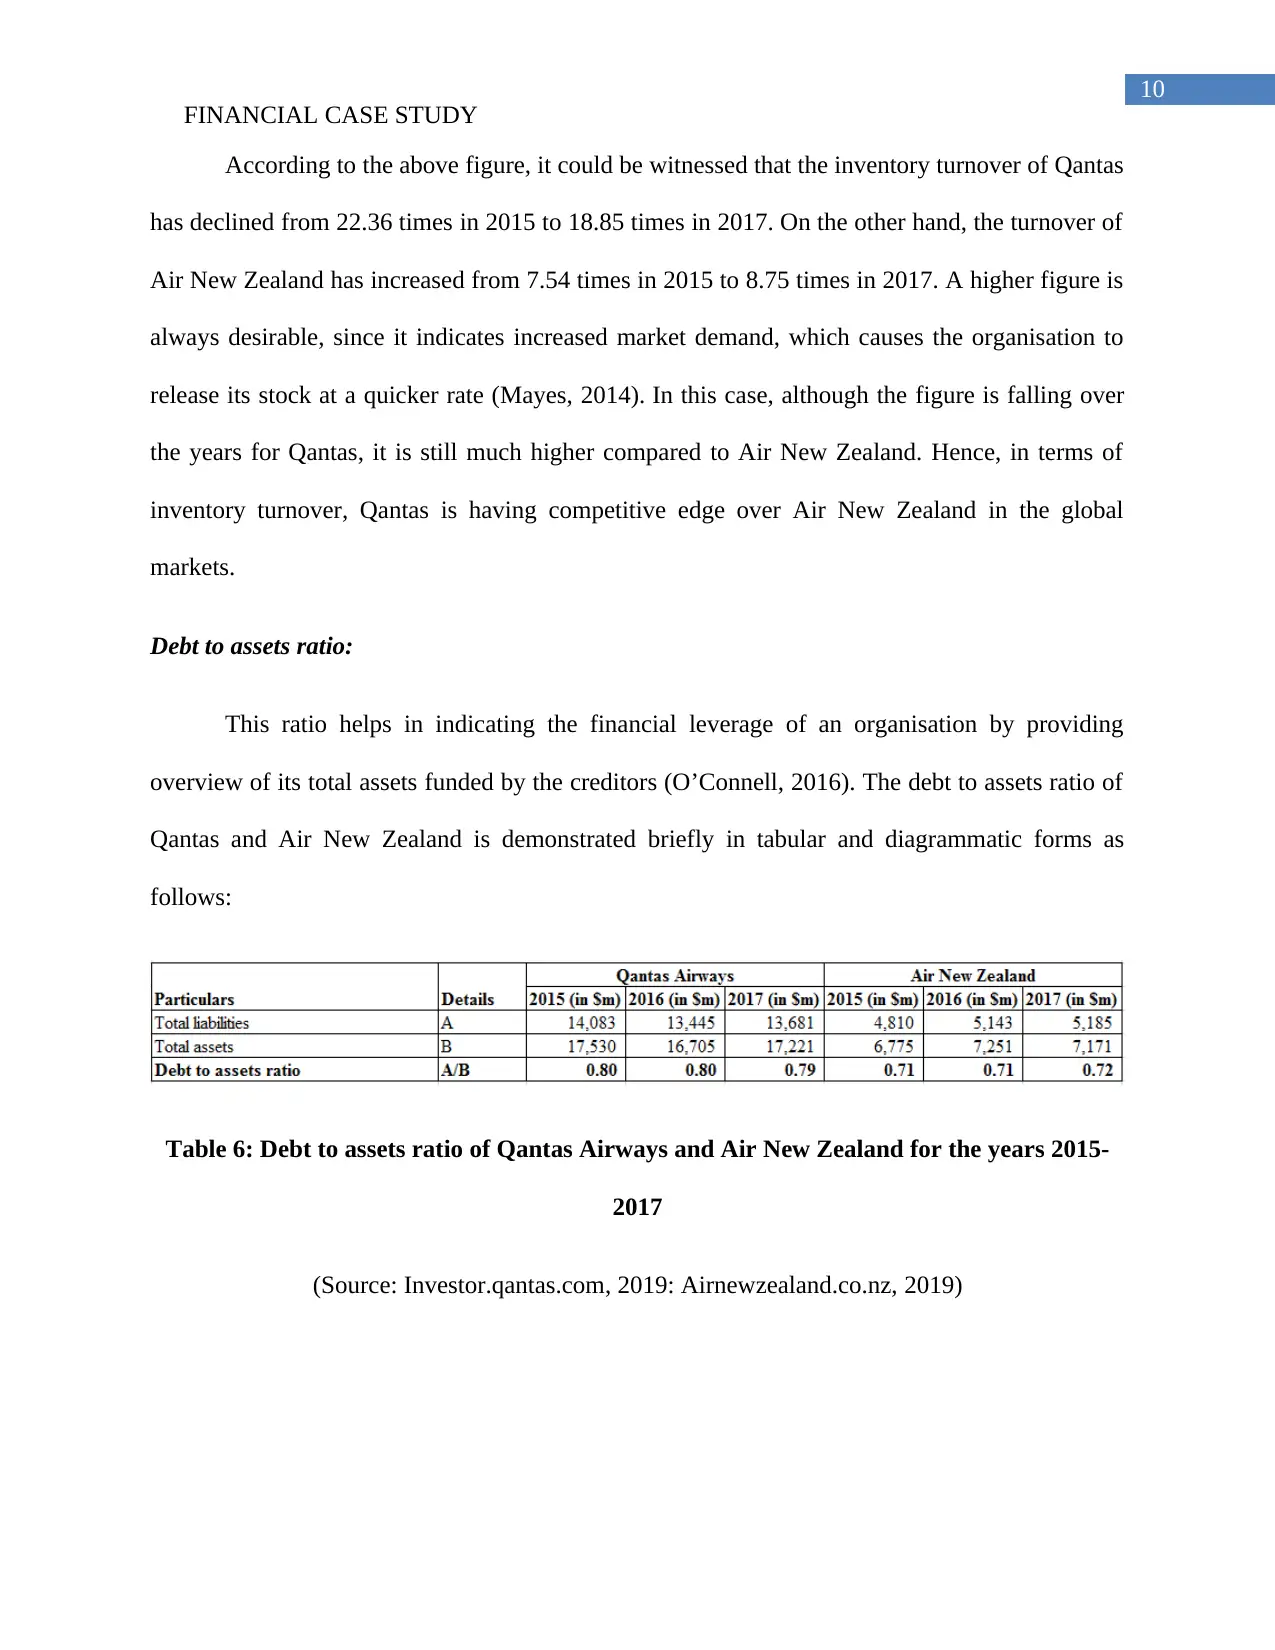
Debt to assets ratio:
This ratio helps in indicating the financial leverage of an organisation by providing
overview of its total assets funded by the creditors (O’Connell, 2016). The debt to assets ratio of
Qantas and Air New Zealand is demonstrated briefly in tabular and diagrammatic forms as
follows:
Table 6: Debt to assets ratio of Qantas Airways and Air New Zealand for the years 2015-
2017
(Source: Investor.qantas.com, 2019: Airnewzealand.co.nz, 2019)
FINANCIAL CASE STUDY
According to the above figure, it could be witnessed that the inventory turnover of Qantas
has declined from 22.36 times in 2015 to 18.85 times in 2017. On the other hand, the turnover of
Air New Zealand has increased from 7.54 times in 2015 to 8.75 times in 2017. A higher figure is
always desirable, since it indicates increased market demand, which causes the organisation to
release its stock at a quicker rate (Mayes, 2014). In this case, although the figure is falling over
the years for Qantas, it is still much higher compared to Air New Zealand. Hence, in terms of
inventory turnover, Qantas is having competitive edge over Air New Zealand in the global
markets.
Debt to assets ratio:
This ratio helps in indicating the financial leverage of an organisation by providing
overview of its total assets funded by the creditors (O’Connell, 2016). The debt to assets ratio of
Qantas and Air New Zealand is demonstrated briefly in tabular and diagrammatic forms as
follows:
Table 6: Debt to assets ratio of Qantas Airways and Air New Zealand for the years 2015-
2017
(Source: Investor.qantas.com, 2019: Airnewzealand.co.nz, 2019)
11
FINANCIAL CASE STUDY
2015 2016 2017 2015 2016 2017
Qantas Airways Air New Zealand
0.66
0.68
0.70
0.72
0.74
0.76
0.78
0.80
0.82 0.80 0.80 0.79
0.71 0.71
0.72
Debt to assets ratio
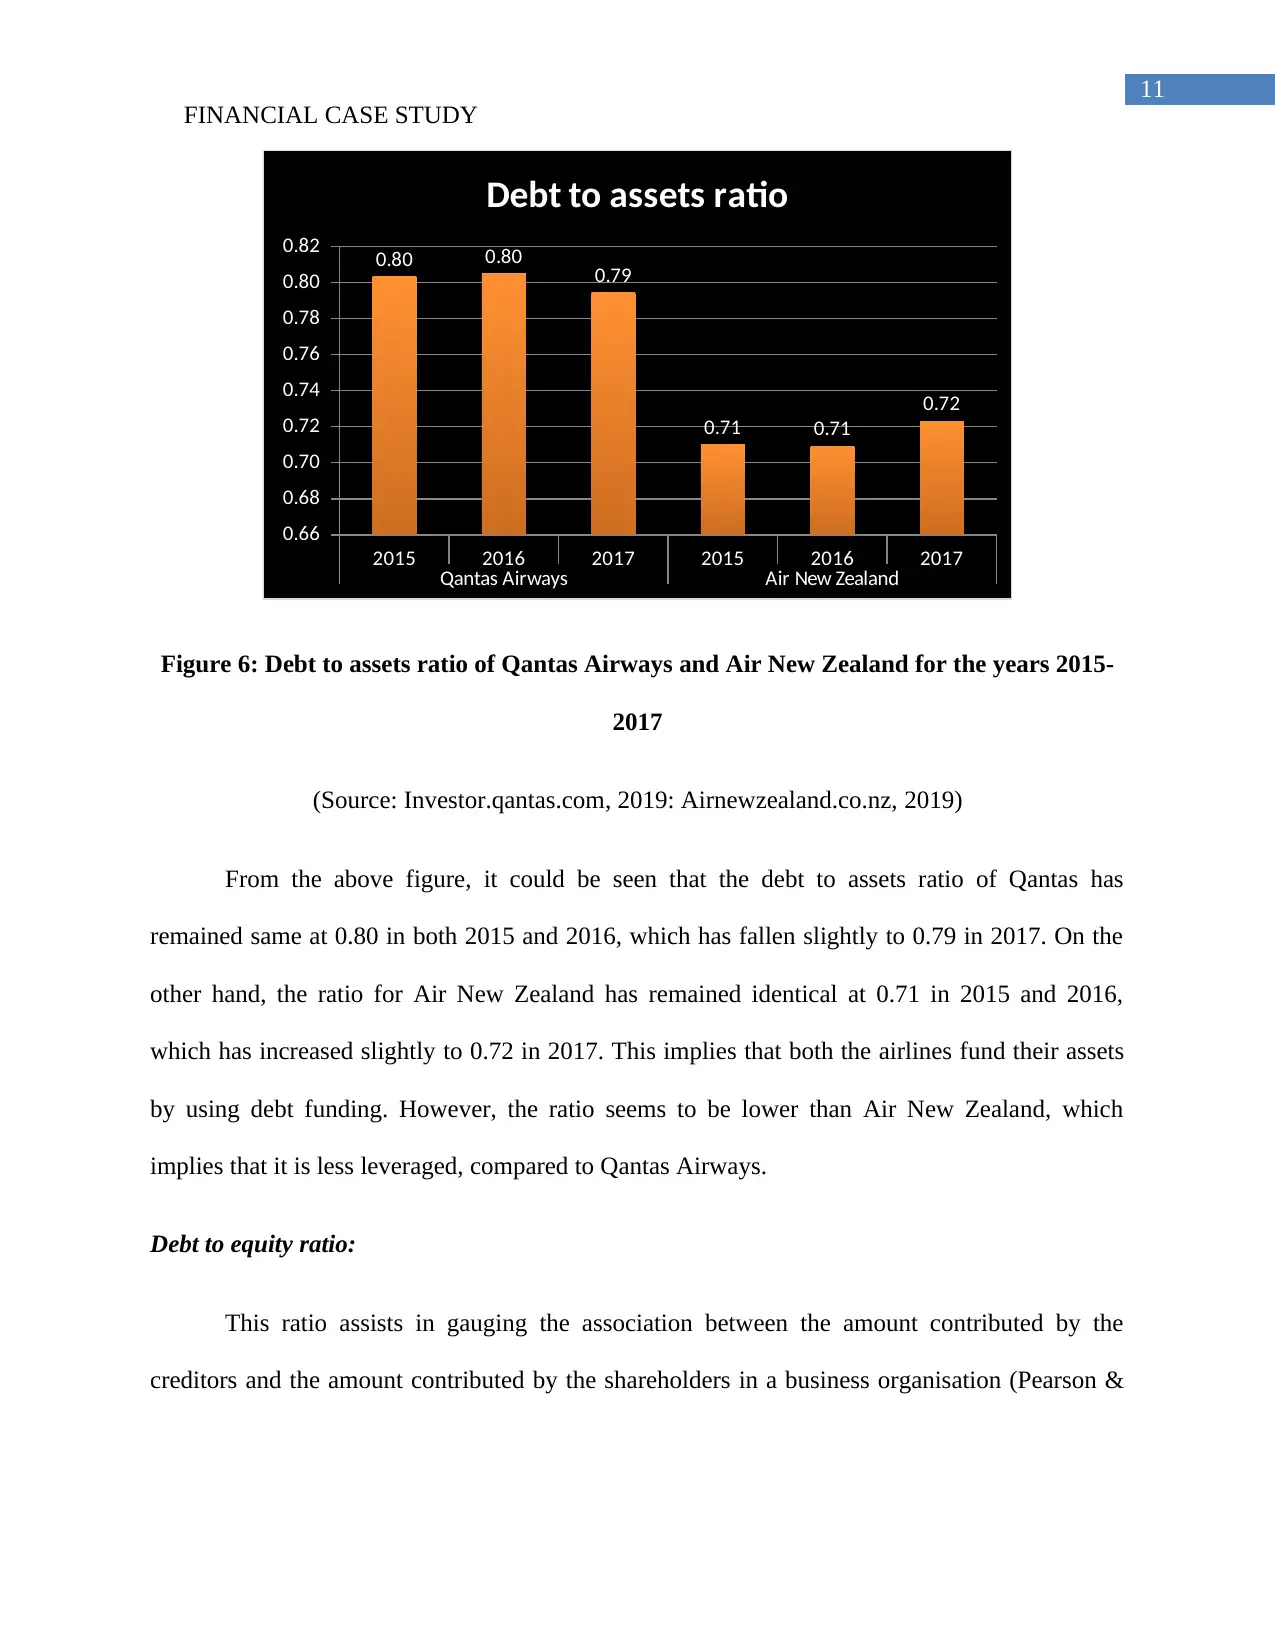
Figure 6: Debt to assets ratio of Qantas Airways and Air New Zealand for the years 2015-
2017
(Source: Investor.qantas.com, 2019: Airnewzealand.co.nz, 2019)
From the above figure, it could be seen that the debt to assets ratio of Qantas has
remained same at 0.80 in both 2015 and 2016, which has fallen slightly to 0.79 in 2017. On the
other hand, the ratio for Air New Zealand has remained identical at 0.71 in 2015 and 2016,
which has increased slightly to 0.72 in 2017. This implies that both the airlines fund their assets
by using debt funding. However, the ratio seems to be lower than Air New Zealand, which
implies that it is less leveraged, compared to Qantas Airways.
Debt to equity ratio:
This ratio assists in gauging the association between the amount contributed by the
creditors and the amount contributed by the shareholders in a business organisation (Pearson &
FINANCIAL CASE STUDY
2015 2016 2017 2015 2016 2017
Qantas Airways Air New Zealand
0.66
0.68
0.70
0.72
0.74
0.76
0.78
0.80
0.82 0.80 0.80 0.79
0.71 0.71
0.72
Debt to assets ratio
Figure 6: Debt to assets ratio of Qantas Airways and Air New Zealand for the years 2015-
2017
(Source: Investor.qantas.com, 2019: Airnewzealand.co.nz, 2019)
From the above figure, it could be seen that the debt to assets ratio of Qantas has
remained same at 0.80 in both 2015 and 2016, which has fallen slightly to 0.79 in 2017. On the
other hand, the ratio for Air New Zealand has remained identical at 0.71 in 2015 and 2016,
which has increased slightly to 0.72 in 2017. This implies that both the airlines fund their assets
by using debt funding. However, the ratio seems to be lower than Air New Zealand, which
implies that it is less leveraged, compared to Qantas Airways.
Debt to equity ratio:
This ratio assists in gauging the association between the amount contributed by the
creditors and the amount contributed by the shareholders in a business organisation (Pearson &
⊘ This is a preview!⊘
Do you want full access?
Subscribe today to unlock all pages.
Trusted by 1+ million students worldwide
1 out of 24
Related Documents


Your All-in-One AI-Powered Toolkit for Academic Success.
+13062052269
info@desklib.com
Available 24*7 on WhatsApp / Email
![[object Object]](/_next/static/media/star-bottom.7253800d.svg)
Unlock your academic potential
Copyright © 2020–2026 A2Z Services. All Rights Reserved. Developed and managed by ZUCOL.