Qantas Airways: Non-Current Assets Valuation and Depreciation Analysis

Verified

Added on  2022/09/17

|18
|2350
|40
Report
AI Summary
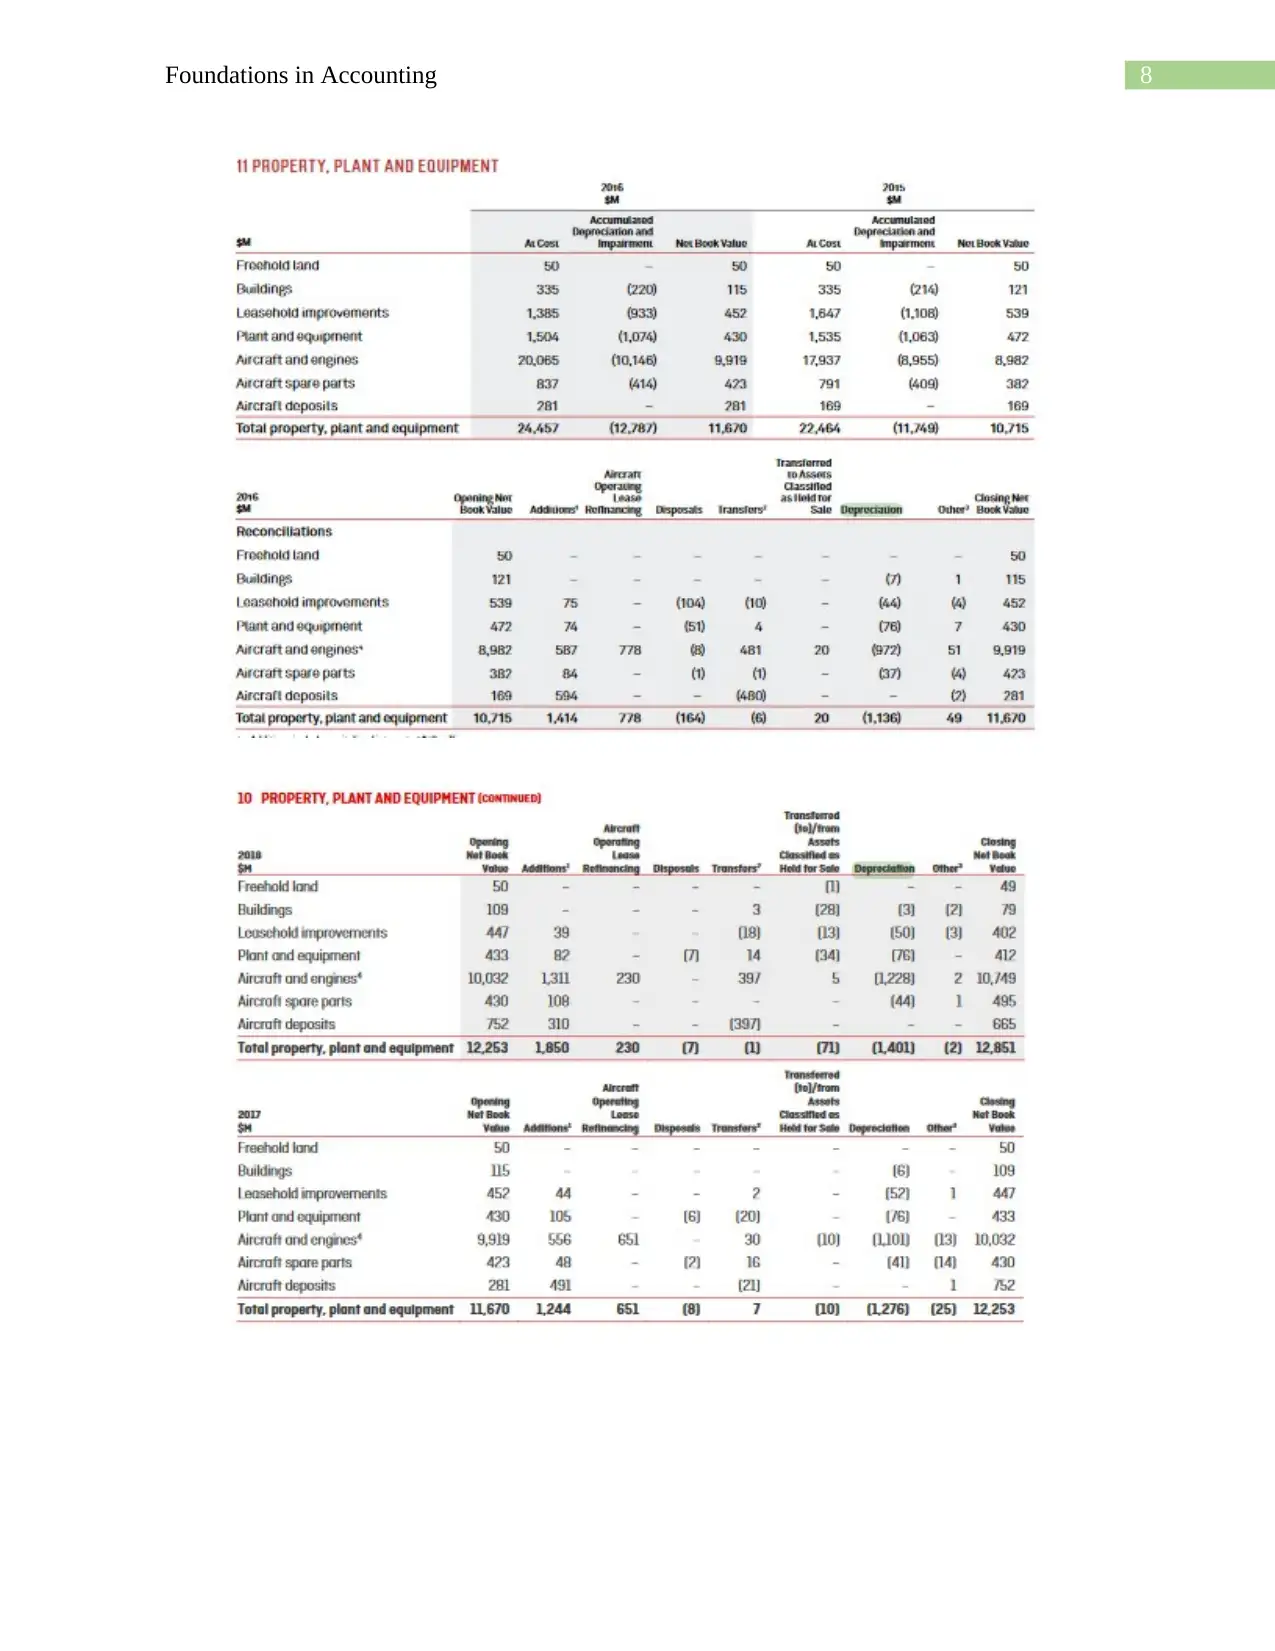
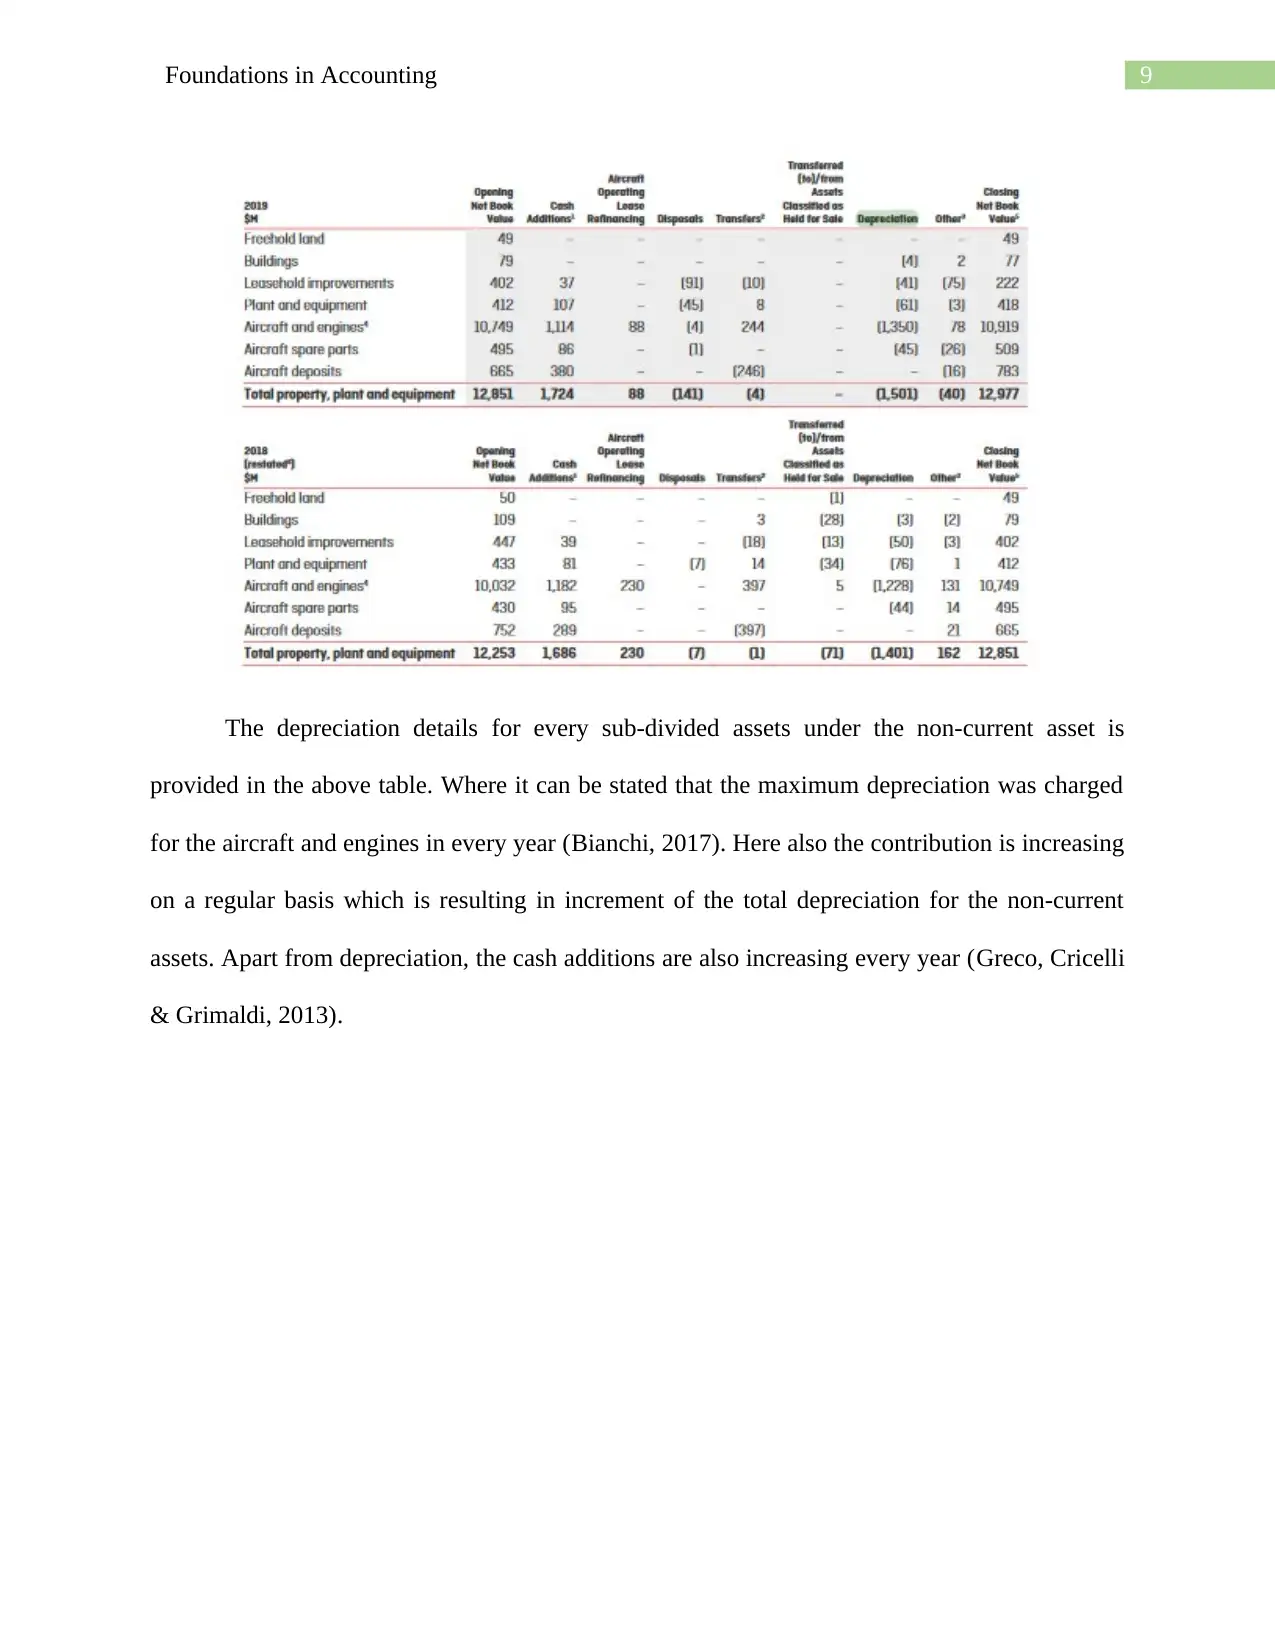
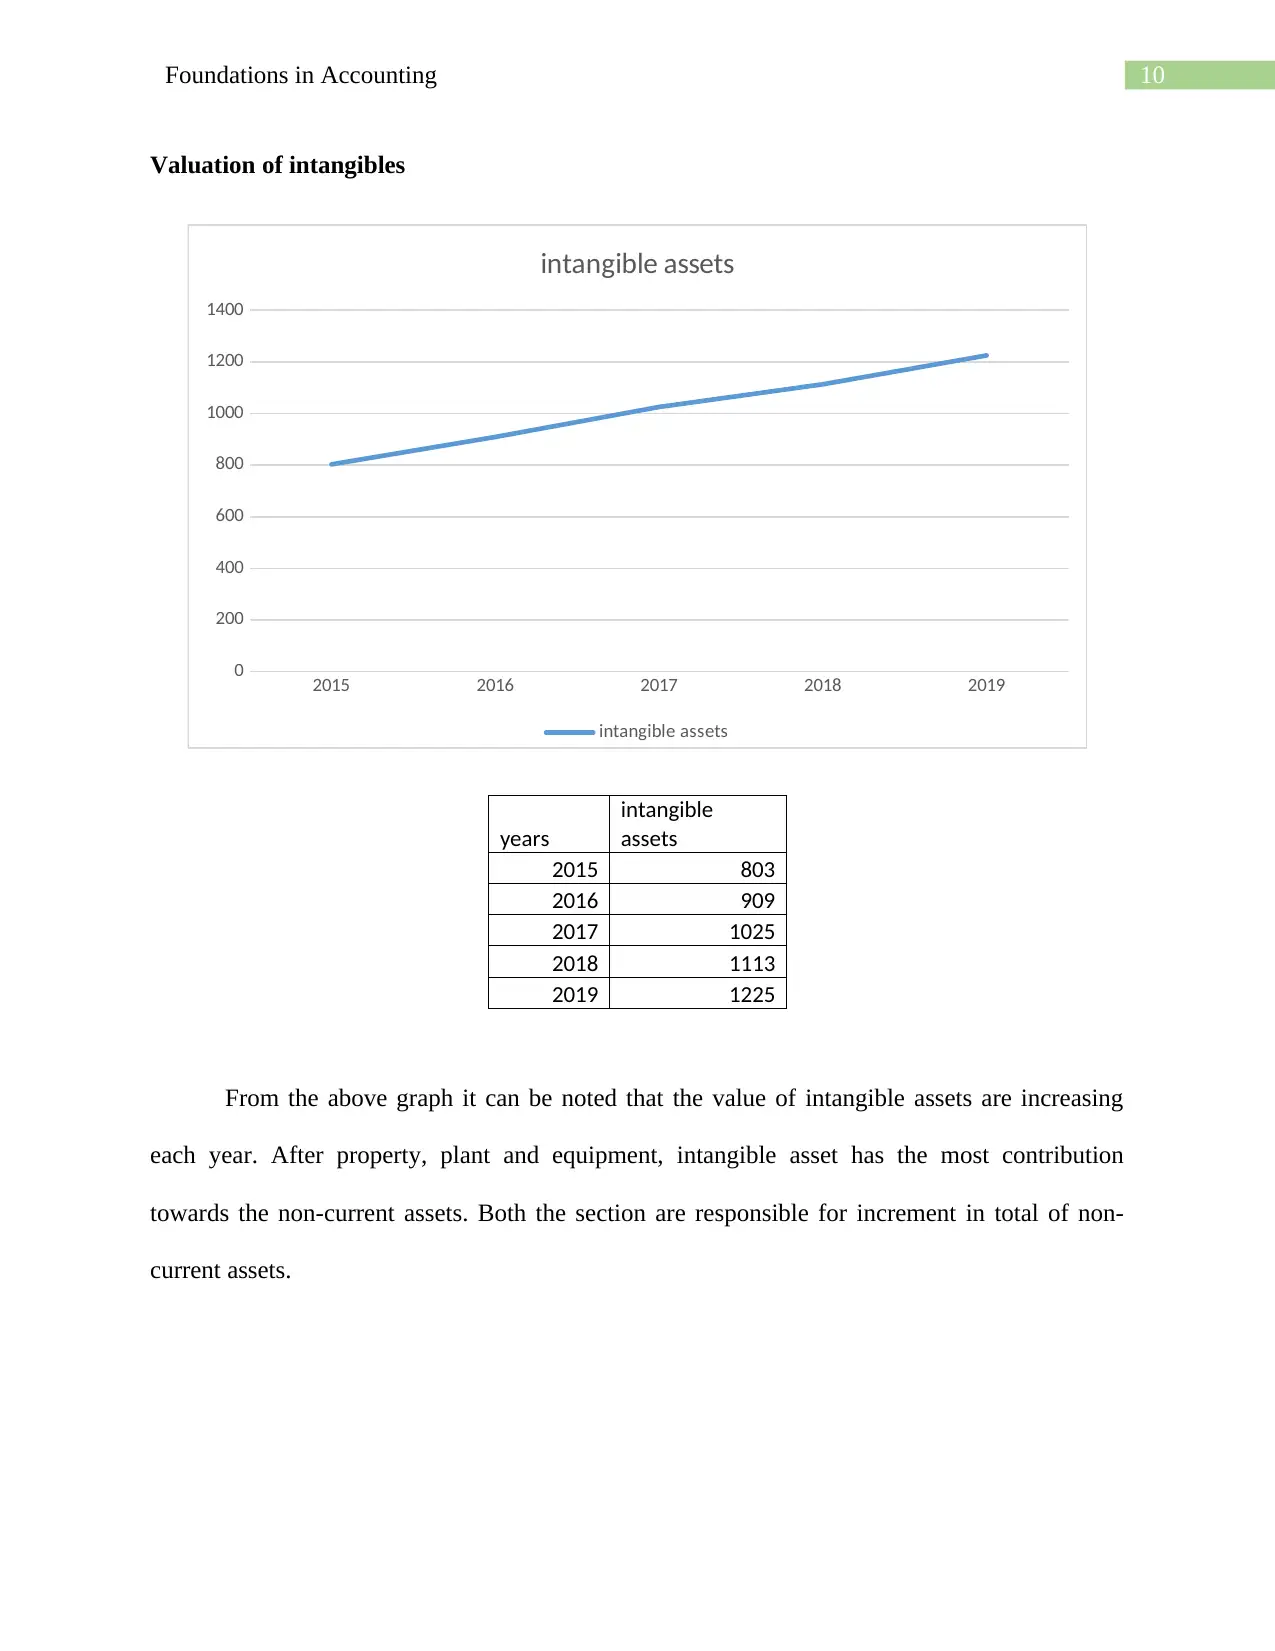
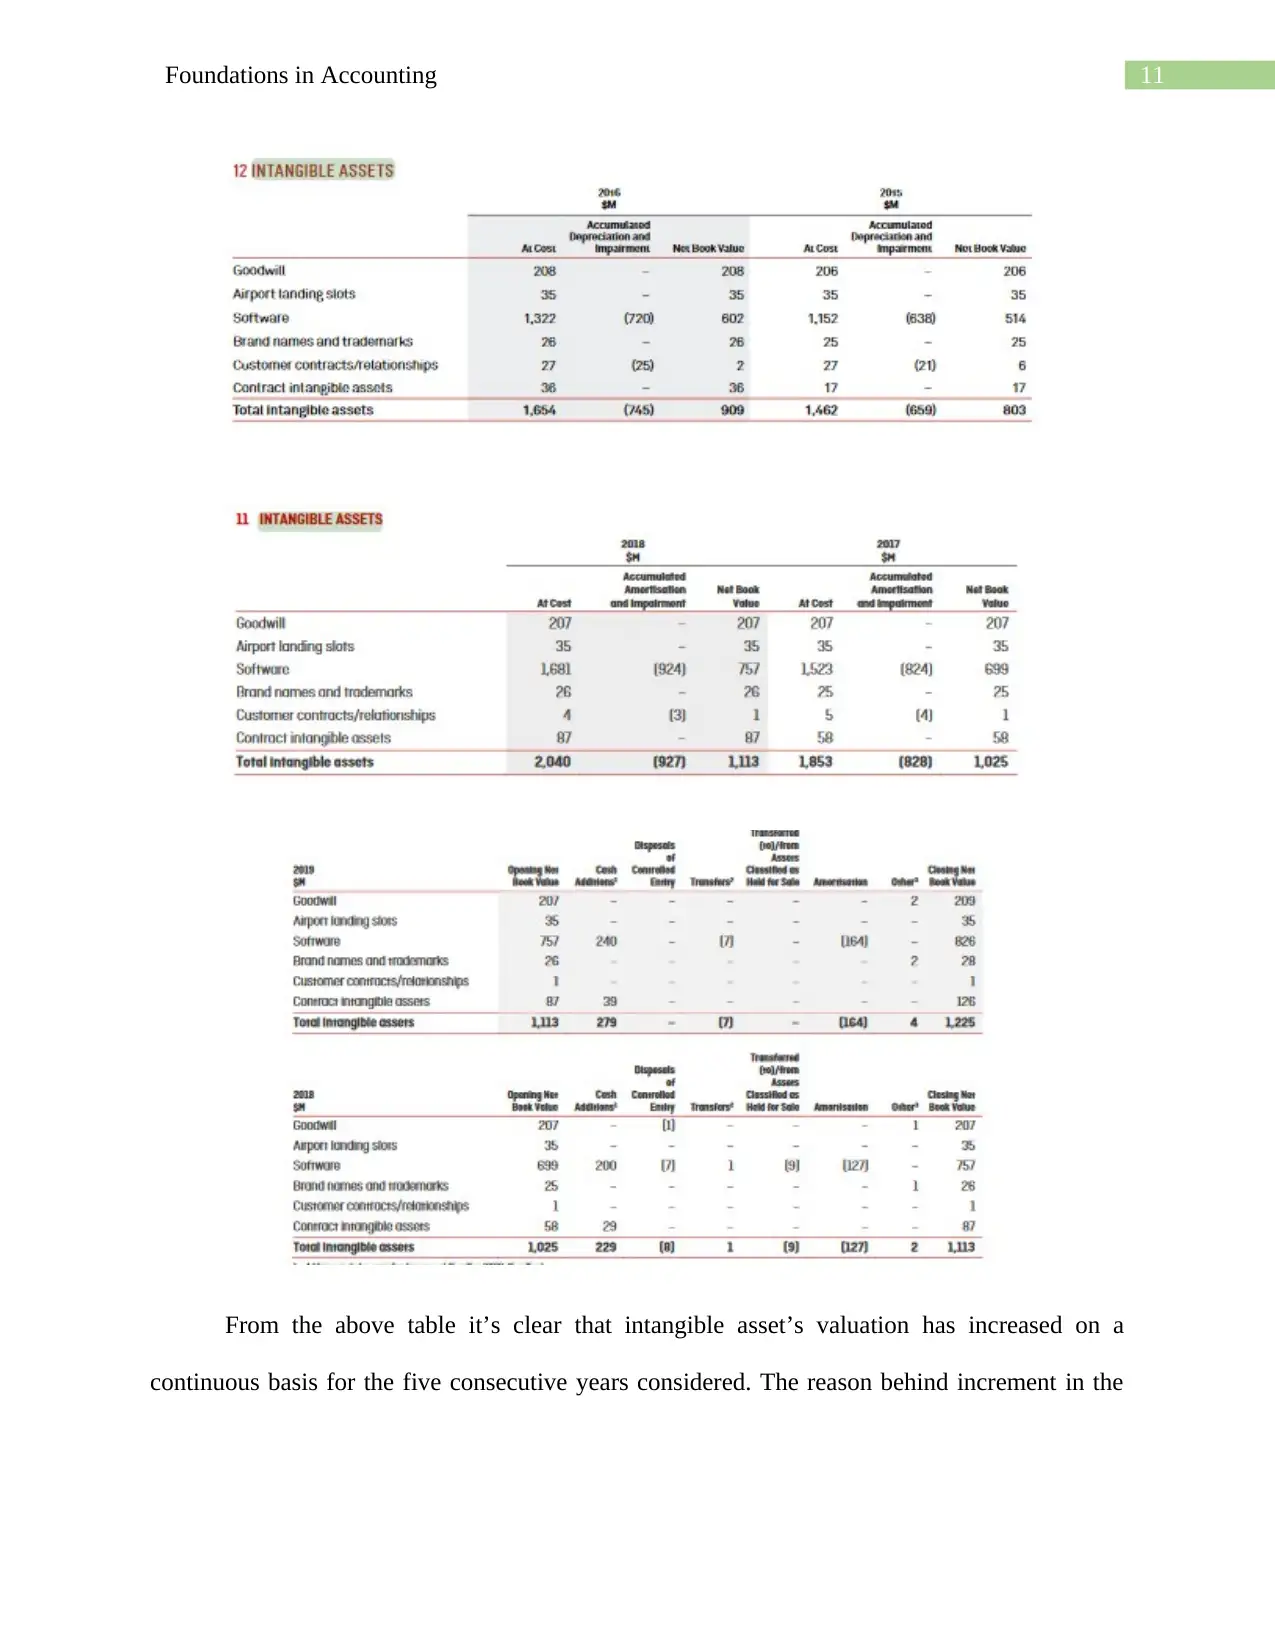
This report provides a comprehensive financial analysis of Qantas Airways, focusing on the valuation and depreciation of its non-current assets from 2015 to 2019. The report begins with a brief overview of Qantas, its industry, and its operational context, including the impact of the COVID-19 pandemic. It then delves into the company's property, plant, and equipment (PPE) and intangible assets, examining their valuation trends and the methods of depreciation and amortization used. The analysis reveals an increasing trend in the value of both PPE and intangible assets, along with corresponding increases in depreciation and amortization expenses. The report highlights the straight-line method used for depreciation and amortization and discusses the implications of these trends on Qantas's financial performance, concluding that despite increased depreciation and amortization, the overall value of the non-current assets has been maintained, indicating the company's growth and market position. The report references relevant accounting standards and financial concepts to support its findings.
Document Page
Running head: FOUNDATIONS IN ACCOUNTING
FOUNDATIONS IN ACCOUNTING
Name of the Student:
Name of the University:
Author Note:
tabler-icon-diamond-filled.svg

Paraphrase This Document

Need a fresh take? Get an instant paraphrase of this document with our AI Paraphraser
Document Page
1Foundations in Accounting
Executive Summary
A detailed report of the airline company Qantas is focused and their current annual financial
report is evaluated to find out the non-current assets valuation and their depreciation values as
well. A short description about the company along with the industry under which it is operating
is also provided. Five consecutive years starting from 2015 to 2019 is evaluated for the purpose
of the trendline analysis specifically for intangible assets and property, plant and equipment.
Document Page
2Foundations in Accounting
Table of Contents
1.1 Introduction...........................................................................................................................3
1.2 Discussion..................................................................................................................................3
1.3 Conclusion...............................................................................................................................12
Document Page
3Foundations in Accounting
1.1 Introduction
Qantas Airways Limited is a well-known jet company globally and their non-current
asset also has shown increment for previous few years. In this report, a short description of the
company along with the industry under which it operates is provided. Five consecutive years are
taken for the analysis of the performance of their no-current assets specifically the intangible
assets and property, plant and equipment of the company. Here the trend will be analyzed
properly and why there have been increment or decrement will also be discussed in detail. The
method of amortization used by the company along with the method used for depreciation is also
specified in the annual report.
1.2 Discussion
Qantas Airways Limited jet company is known to be the third biggest in the whole world.
It is also called as the flag carrier for Australia and it also has biggest airline which is of the fleet
size for connection with international flights and international destinations. It was found in 16th
November, 1920 in Winton, Queensland, Australia. This name is formed from ‘QANTAS’ which
is originated from “Queensland and Northern Territory Aerial Services”. It was also considered
as the flying kangaroo initially. It is the Oneworld airline alliance’s founding member. This
company have flourished since its origination and trading their shares under Australian Stock
exchange (ASX: QAN). Revenue of the company was calculated at A$17.96 billion during 2019
and the operating income was at A$1.64 billion during the same year. During 2014, the Qantas
had Australian domestic market’s 65% shares and they also added almost 14.9% of every
passengers who were travelling from and to Australia. Qantas owned another airline which was
Jetstar Airways at a low cost (Investor.qantas.com., 2020). However, due to the current
tabler-icon-diamond-filled.svg

Paraphrase This Document

Need a fresh take? Get an instant paraphrase of this document with our AI Paraphraser
Document Page
4Foundations in Accounting
pandemic situation the airways is facing a hug loss and they have decided to suspend almost 60%
of their domestic flights and 2/3rd of the employees will be provided leaves (Piosik &
Poniatowska, 2013).
This company and all the other companies who sells some kind of services to the
consumers are operating under Tertiary sector industry. Qantas’s service also falls under this
sector. It is the 3rd sector of this economy which is called as service sector. This sector provides
service or intangible goods to their consumers which is basically manufacturing of services and
not end products (Saunders & Brynjolfsson, 2016). Last 100 years was the transformational
period for this sector from primary sector and secondary sector. This period was considered as
tertiarisation. Now it is the only largest sector in western world. This sector is considered as the
fastest growing sector in the world. However, the challenges faced by sellers of this sector is also
much more than the challenges faced by other sellers form other sectors (Trifan & Anton, 2014).
The reason is service in intangible and it is difficult for the sellers to calculate the potential value
of it and the potential customers who will buy the service.
There are many issues which are related to the transaction of the non-current assets while
maintaining the IFRS standards (AccountingTools., 2020). This issues arises due to the
disposable nature. Current assets gets non-disposed and hence there are very less issues
regarding this and IFRS is not even applicable to the current assets. Non-current assets are also
called as group of disposal and also as “held for sale”. These non-current assets are considered as
group of disposal because it can be disposed by selling or otherwise. Held for sale asset is also
used to distinguish the operations as continuing asset and the discontinued asset. Here another
problem arises as to how the distinction must be done.
Valuation of property, plant and equipment
Document Page
5Foundations in Accounting
2015 2016 2017 2018 2019
0
2000
4000
6000
8000
10000
12000
14000
PPE
PPE
year PPE
2015 10715
2016 11670
2017 12253
2018 12851
2019 12977
From the valuation of PPE (Property, Plant and equipment) in their annual report for Five
consecutive years, it can be understand that the company has been earning profit continuously.
There is a increment in the value for non-current assets every year. Every year the depreciation
of those non-current assets are also increasing however, the increase in the value simultaneously
indicates that the company have successfully made enough profit in the financial year which is
increasing the value despite increment in the depreciation (Botelho et al., 2015).
Document Page
6Foundations in Accounting
From the above notes to financial statement, it can be stated that increment in the
depreciation and the net book value is actually decreasing the at cost value of PPE (property,
plant and equipment). There is a higher contribution of PPE in the non-current assets each year.
As the contribution amount grows, the value of non-current asset also improves.
Depreciation and Impairment of property, plant and equipment
tabler-icon-diamond-filled.svg

Paraphrase This Document

Need a fresh take? Get an instant paraphrase of this document with our AI Paraphraser
Document Page
7Foundations in Accounting
2015 2016 2017 2018 2019
0
2000
4000
6000
8000
10000
12000
14000
16000
depreciation
depriciation
YEAR
depreciatio
n
2015 11749
2016 12787
2017 13987
2018 14683
2019 14873
Form the above graph of depreciation it can be stated that there is an increment in the
depreciation of this company for the property, plant and equipment every year. There is also a
continuous increment in non-current asset’s valuation. It can be supposed that in the next year
also the depreciation will increase. Straight-line basis method is used on each and every item of
the PPE except the freehold land which cannot be depreciated (Net, A. R., 2018).
Document Page
8Foundations in Accounting
Document Page
9Foundations in Accounting
The depreciation details for every sub-divided assets under the non-current asset is
provided in the above table. Where it can be stated that the maximum depreciation was charged
for the aircraft and engines in every year (Bianchi, 2017). Here also the contribution is increasing
on a regular basis which is resulting in increment of the total depreciation for the non-current
assets. Apart from depreciation, the cash additions are also increasing every year (Greco, Cricelli
& Grimaldi, 2013).
tabler-icon-diamond-filled.svg

Paraphrase This Document

Need a fresh take? Get an instant paraphrase of this document with our AI Paraphraser
Document Page
10Foundations in Accounting
Valuation of intangibles
2015 2016 2017 2018 2019
0
200
400
600
800
1000
1200
1400
intangible assets
intangible assets
years
intangible
assets
2015 803
2016 909
2017 1025
2018 1113
2019 1225
From the above graph it can be noted that the value of intangible assets are increasing
each year. After property, plant and equipment, intangible asset has the most contribution
towards the non-current assets. Both the section are responsible for increment in total of non-
current assets.
Document Page
11Foundations in Accounting
From the above table it’s clear that intangible asset’s valuation has increased on a
continuous basis for the five consecutive years considered. The reason behind increment in the
chevron_up_icon
1 out of 18
circle_padding
hide_on_mobile
zoom_out_icon
[object Object]