Financial Management Report: Ramsay Health Care Performance Analysis
VerifiedAdded on 2023/06/09
|15
|4342
|190
Report
AI Summary
This report presents a financial analysis of Ramsay Health Care, evaluating its performance based on financial statements from 2016 and 2017. The analysis employs various financial ratios, including profitability, efficiency, liquidity, and capital structure ratios, to assess the company's financial health. The report examines key trends in profitability, such as net profit margin and return on equity, and assesses efficiency through ratios like asset turnover and inventory turnover. Liquidity and capital structure are also evaluated to understand the company's ability to meet short-term obligations and manage debt. The analysis compares the company's performance over the two years and against industry averages, offering insights into areas of strength and weakness, and concluding with recommendations for improvement. The executive summary highlights the increased profitability, market share, and the need to manage financial leverage effectively. The report also considers relevant financial theories such as profit maximization and shareholder interest theory to provide a comprehensive understanding of Ramsay Health Care's financial position and performance.
Ramsay Health company
Financial Management
Financial analysis
Name of the Author
Financial Management
Financial analysis
Name of the Author
Paraphrase This Document
Need a fresh take? Get an instant paraphrase of this document with our AI Paraphraser
Executive Summary
With the changes in ramified economy, each and every organization needs to take
imperative business decisions to manage its financial risk in its business. There are several
financial analysis tools which could be used to measure the financial performance of
company such as ratio analysis, top down analysis, bottom up analysis capital budgeting and
Du pont analysis. The Ramsay Health Care has increased its overall profitability by 17%
since last three years which reflects that company has created value on its investment. The
major positive part of the company is related to increased market share and overall turnover.
Nonetheless, company needs to lower down its financial leverage as it might be hard for
company to run its business in long run if it were to face low level of profitability due to
sluggish market condition.
INTRODUCTION
Financial management is process to raise the funds from the market and deploy the
same in business with a view to create value on the investment. When the financial health for
any concern is analysed, the financial ratios come to the rescue. Financial ratio establishes the
relation between the two factors to measure the financial performance of company. In this
report, Ramsay Health Care Company has been taken into consideration to analysis the
financial performance. The ratio analysis has been used with the consideration of financial
management theory to analysis the past and present financial performance company to
estimate whether company will have positive and negative outlook in the long run. After
assessing the financial performance of company, it is inferred that company has maintained
stable profitability since last three years. The capital structure of company is also moderate
which reflects low amount of financial leverage. Company could use more debt funding in its
busienss. The efficiency ratio divulges that company could lower down its blockage of funds
if it was used effectively. The net margin has increased over by 10%. However, the efficiency
ratios show a downward trend and make the efficiency of operation certainly questionable.
The liquidity ratios have set up a faith regarding the solvency structure of the entity. The
current report is an explanation of what the financial statements of Ramsay Health Care, a
company listed on Australian Stock Exchange, reveal. The analysis involves the computation
of various relevant ratios, for which the findings are presented here. The comparison has been
laid out for two latest financial years being financial year 2017 and financial year 2016. The
ratio analysis shall help in understanding whether the company has been in a better footing in
financial year 2017 when compared to financial year 2016. Not only an analysis is made, but
recommendations are also provided for improvement of the entity’s financial standing
(Ramsay Health care, 2017).
Ramsay Health Care is a global hospital group was primarily established in Australia in 1964
by Paul Ramsay, having 235 operating hospitals currently. It’s a listed company on
Australian stock exchange since 1997 and caters every kind of health solution ranging from
day surgeries, psychiatric, rehabilitation to highly complex surgeries. Ramsay Health Care is
known to have functioned sustainably over these years with good profitability and sound
financial management. The company is functioning globally across Australia, France,
Indonesia, Malaysia and United Kingdom (Ramsay Health care, 2017).
⊘ This is a preview!⊘
Do you want full access?
Subscribe today to unlock all pages.
Trusted by 1+ million students worldwide
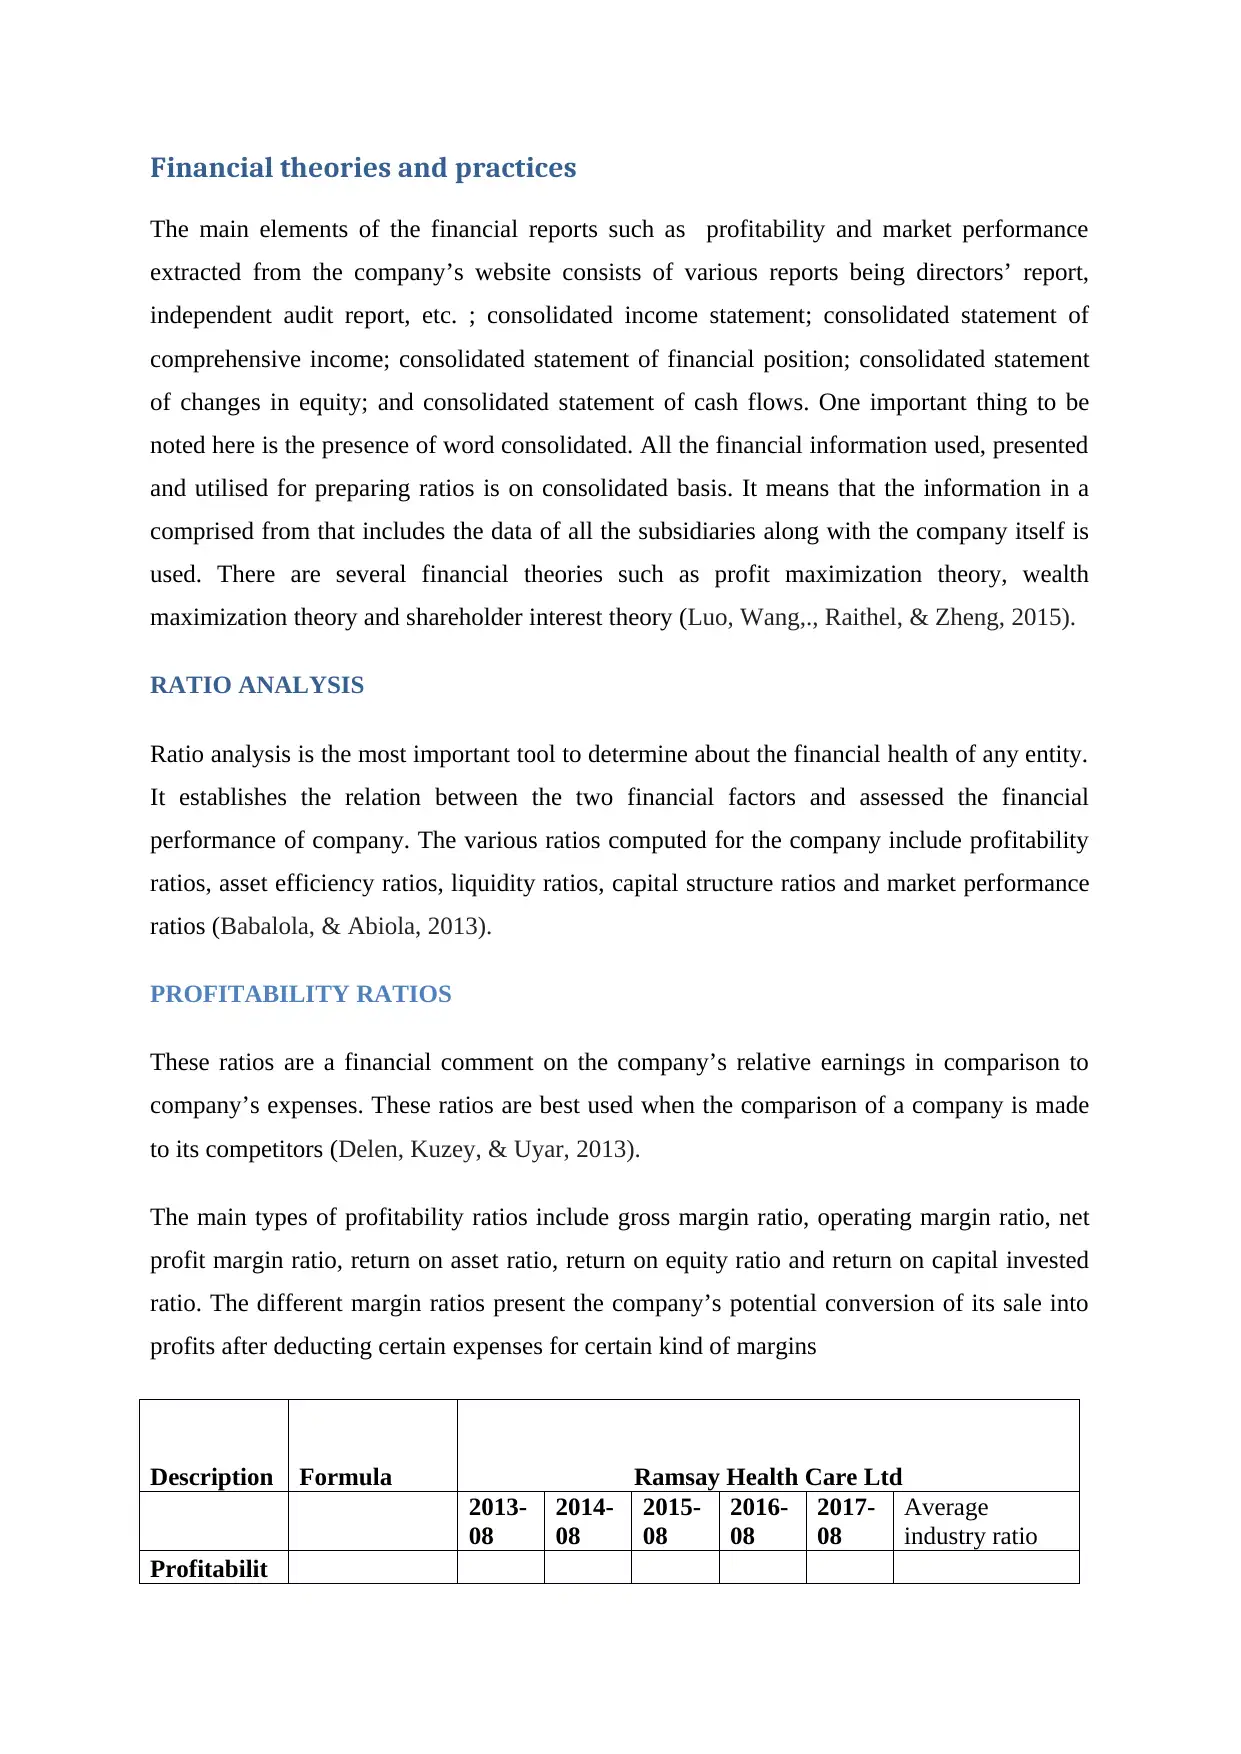
Financial theories and practices
The main elements of the financial reports such as profitability and market performance
extracted from the company’s website consists of various reports being directors’ report,
independent audit report, etc. ; consolidated income statement; consolidated statement of
comprehensive income; consolidated statement of financial position; consolidated statement
of changes in equity; and consolidated statement of cash flows. One important thing to be
noted here is the presence of word consolidated. All the financial information used, presented
and utilised for preparing ratios is on consolidated basis. It means that the information in a
comprised from that includes the data of all the subsidiaries along with the company itself is
used. There are several financial theories such as profit maximization theory, wealth
maximization theory and shareholder interest theory (Luo, Wang,., Raithel, & Zheng, 2015).
RATIO ANALYSIS
Ratio analysis is the most important tool to determine about the financial health of any entity.
It establishes the relation between the two financial factors and assessed the financial
performance of company. The various ratios computed for the company include profitability
ratios, asset efficiency ratios, liquidity ratios, capital structure ratios and market performance
ratios (Babalola, & Abiola, 2013).
PROFITABILITY RATIOS
These ratios are a financial comment on the company’s relative earnings in comparison to
company’s expenses. These ratios are best used when the comparison of a company is made
to its competitors (Delen, Kuzey, & Uyar, 2013).
The main types of profitability ratios include gross margin ratio, operating margin ratio, net
profit margin ratio, return on asset ratio, return on equity ratio and return on capital invested
ratio. The different margin ratios present the company’s potential conversion of its sale into
profits after deducting certain expenses for certain kind of margins
Description Formula Ramsay Health Care Ltd
2013-
08
2014-
08
2015-
08
2016-
08
2017-
08
Average
industry ratio
Profitabilit
Paraphrase This Document
Need a fresh take? Get an instant paraphrase of this document with our AI Paraphraser
y
Net profit
Margin
Net
profit/revenue
s 6% 6% 5% 5% 6% 8%
Return on
equity
Net
profit/Equity 17% 18% 21% 22% 21% 24%
Earnings per
share
Net profit/
Share
outstanding 0.50 0.25 .1.5 0.65 0.45 0.85
Return on
assets
Net profit/
Total sales 6% 6% 5% 5% 6% 8%
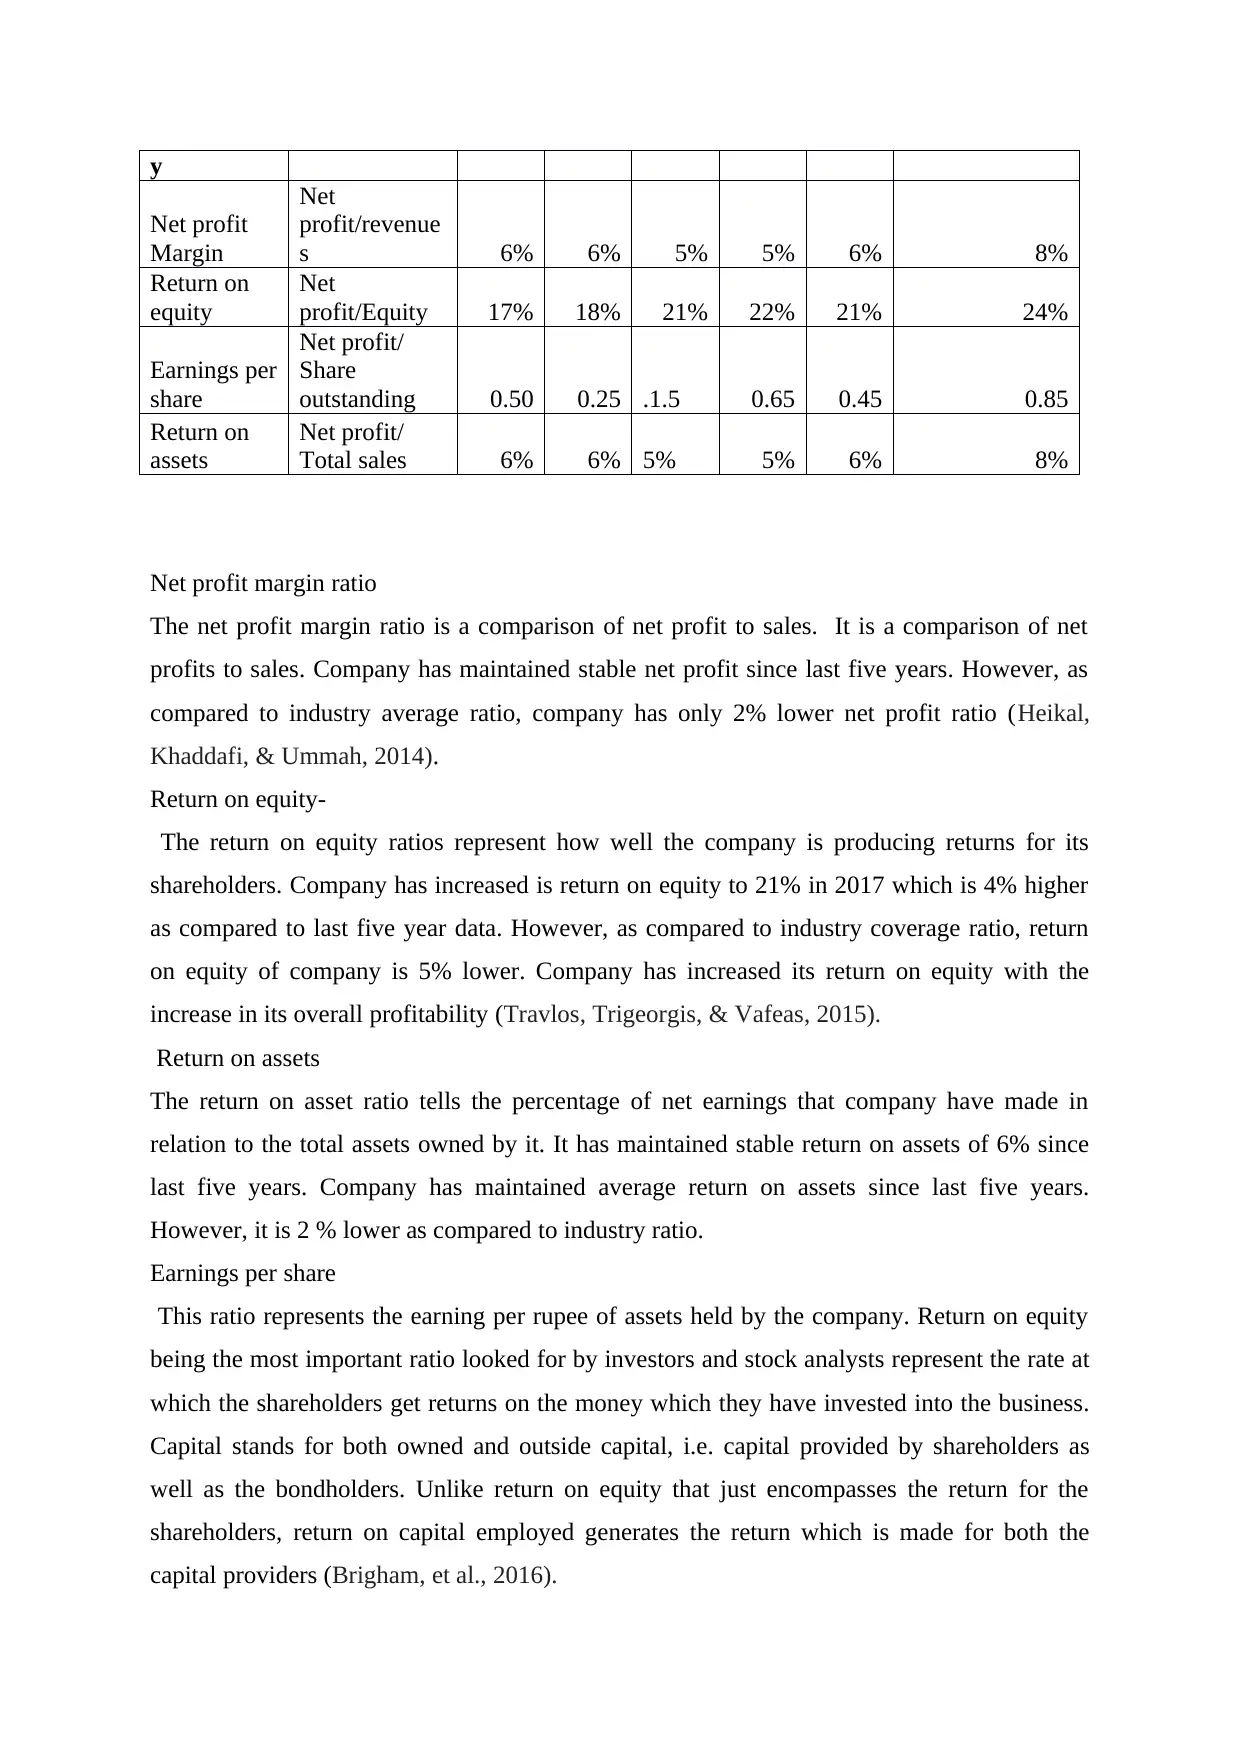
Net profit margin ratio
The net profit margin ratio is a comparison of net profit to sales. It is a comparison of net
profits to sales. Company has maintained stable net profit since last five years. However, as
compared to industry average ratio, company has only 2% lower net profit ratio (Heikal,
Khaddafi, & Ummah, 2014).
Return on equity-
The return on equity ratios represent how well the company is producing returns for its
shareholders. Company has increased is return on equity to 21% in 2017 which is 4% higher
as compared to last five year data. However, as compared to industry coverage ratio, return
on equity of company is 5% lower. Company has increased its return on equity with the
increase in its overall profitability (Travlos, Trigeorgis, & Vafeas, 2015).
Return on assets
The return on asset ratio tells the percentage of net earnings that company have made in
relation to the total assets owned by it. It has maintained stable return on assets of 6% since
last five years. Company has maintained average return on assets since last five years.
However, it is 2 % lower as compared to industry ratio.
Earnings per share
This ratio represents the earning per rupee of assets held by the company. Return on equity
being the most important ratio looked for by investors and stock analysts represent the rate at
which the shareholders get returns on the money which they have invested into the business.
Capital stands for both owned and outside capital, i.e. capital provided by shareholders as
well as the bondholders. Unlike return on equity that just encompasses the return for the
shareholders, return on capital employed generates the return which is made for both the
capital providers (Brigham, et al., 2016).
Net profit
Margin
Net
profit/revenue
s 6% 6% 5% 5% 6% 8%
Return on
equity
Net
profit/Equity 17% 18% 21% 22% 21% 24%
Earnings per
share
Net profit/
Share
outstanding 0.50 0.25 .1.5 0.65 0.45 0.85
Return on
assets
Net profit/
Total sales 6% 6% 5% 5% 6% 8%
Net profit margin ratio
The net profit margin ratio is a comparison of net profit to sales. It is a comparison of net
profits to sales. Company has maintained stable net profit since last five years. However, as
compared to industry average ratio, company has only 2% lower net profit ratio (Heikal,
Khaddafi, & Ummah, 2014).
Return on equity-
The return on equity ratios represent how well the company is producing returns for its
shareholders. Company has increased is return on equity to 21% in 2017 which is 4% higher
as compared to last five year data. However, as compared to industry coverage ratio, return
on equity of company is 5% lower. Company has increased its return on equity with the
increase in its overall profitability (Travlos, Trigeorgis, & Vafeas, 2015).
Return on assets
The return on asset ratio tells the percentage of net earnings that company have made in
relation to the total assets owned by it. It has maintained stable return on assets of 6% since
last five years. Company has maintained average return on assets since last five years.
However, it is 2 % lower as compared to industry ratio.
Earnings per share
This ratio represents the earning per rupee of assets held by the company. Return on equity
being the most important ratio looked for by investors and stock analysts represent the rate at
which the shareholders get returns on the money which they have invested into the business.
Capital stands for both owned and outside capital, i.e. capital provided by shareholders as
well as the bondholders. Unlike return on equity that just encompasses the return for the
shareholders, return on capital employed generates the return which is made for both the
capital providers (Brigham, et al., 2016).
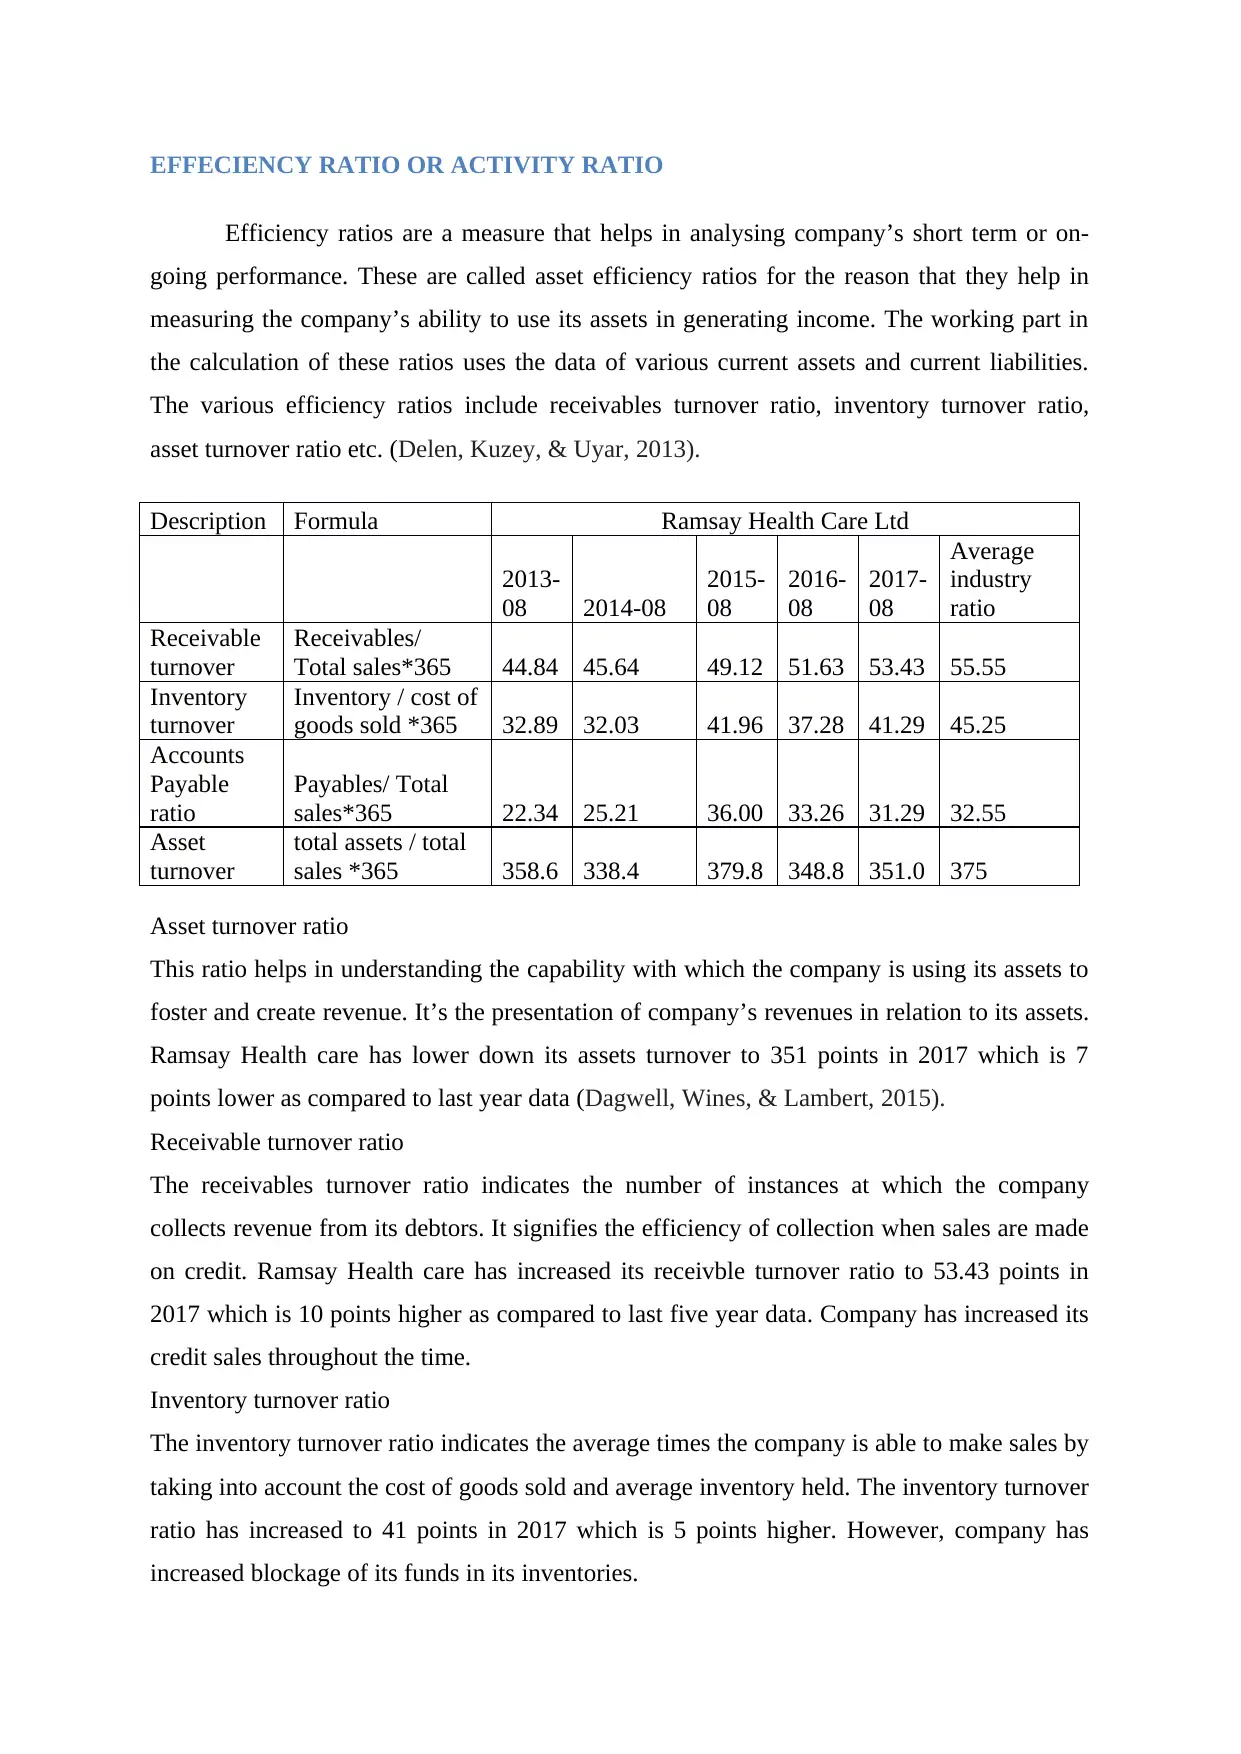
EFFECIENCY RATIO OR ACTIVITY RATIO
Efficiency ratios are a measure that helps in analysing company’s short term or on-
going performance. These are called asset efficiency ratios for the reason that they help in
measuring the company’s ability to use its assets in generating income. The working part in
the calculation of these ratios uses the data of various current assets and current liabilities.
The various efficiency ratios include receivables turnover ratio, inventory turnover ratio,
asset turnover ratio etc. (Delen, Kuzey, & Uyar, 2013).
Description Formula Ramsay Health Care Ltd
2013-
08 2014-08
2015-
08
2016-
08
2017-
08
Average
industry
ratio
Receivable
turnover
Receivables/
Total sales*365 44.84 45.64 49.12 51.63 53.43 55.55
Inventory
turnover
Inventory / cost of
goods sold *365 32.89 32.03 41.96 37.28 41.29 45.25
Accounts
Payable
ratio
Payables/ Total
sales*365 22.34 25.21 36.00 33.26 31.29 32.55
Asset
turnover
total assets / total
sales *365 358.6 338.4 379.8 348.8 351.0 375
Asset turnover ratio
This ratio helps in understanding the capability with which the company is using its assets to
foster and create revenue. It’s the presentation of company’s revenues in relation to its assets.
Ramsay Health care has lower down its assets turnover to 351 points in 2017 which is 7
points lower as compared to last year data (Dagwell, Wines, & Lambert, 2015).
Receivable turnover ratio
The receivables turnover ratio indicates the number of instances at which the company
collects revenue from its debtors. It signifies the efficiency of collection when sales are made
on credit. Ramsay Health care has increased its receivble turnover ratio to 53.43 points in
2017 which is 10 points higher as compared to last five year data. Company has increased its
credit sales throughout the time.
Inventory turnover ratio
The inventory turnover ratio indicates the average times the company is able to make sales by
taking into account the cost of goods sold and average inventory held. The inventory turnover
ratio has increased to 41 points in 2017 which is 5 points higher. However, company has
increased blockage of its funds in its inventories.
⊘ This is a preview!⊘
Do you want full access?
Subscribe today to unlock all pages.
Trusted by 1+ million students worldwide
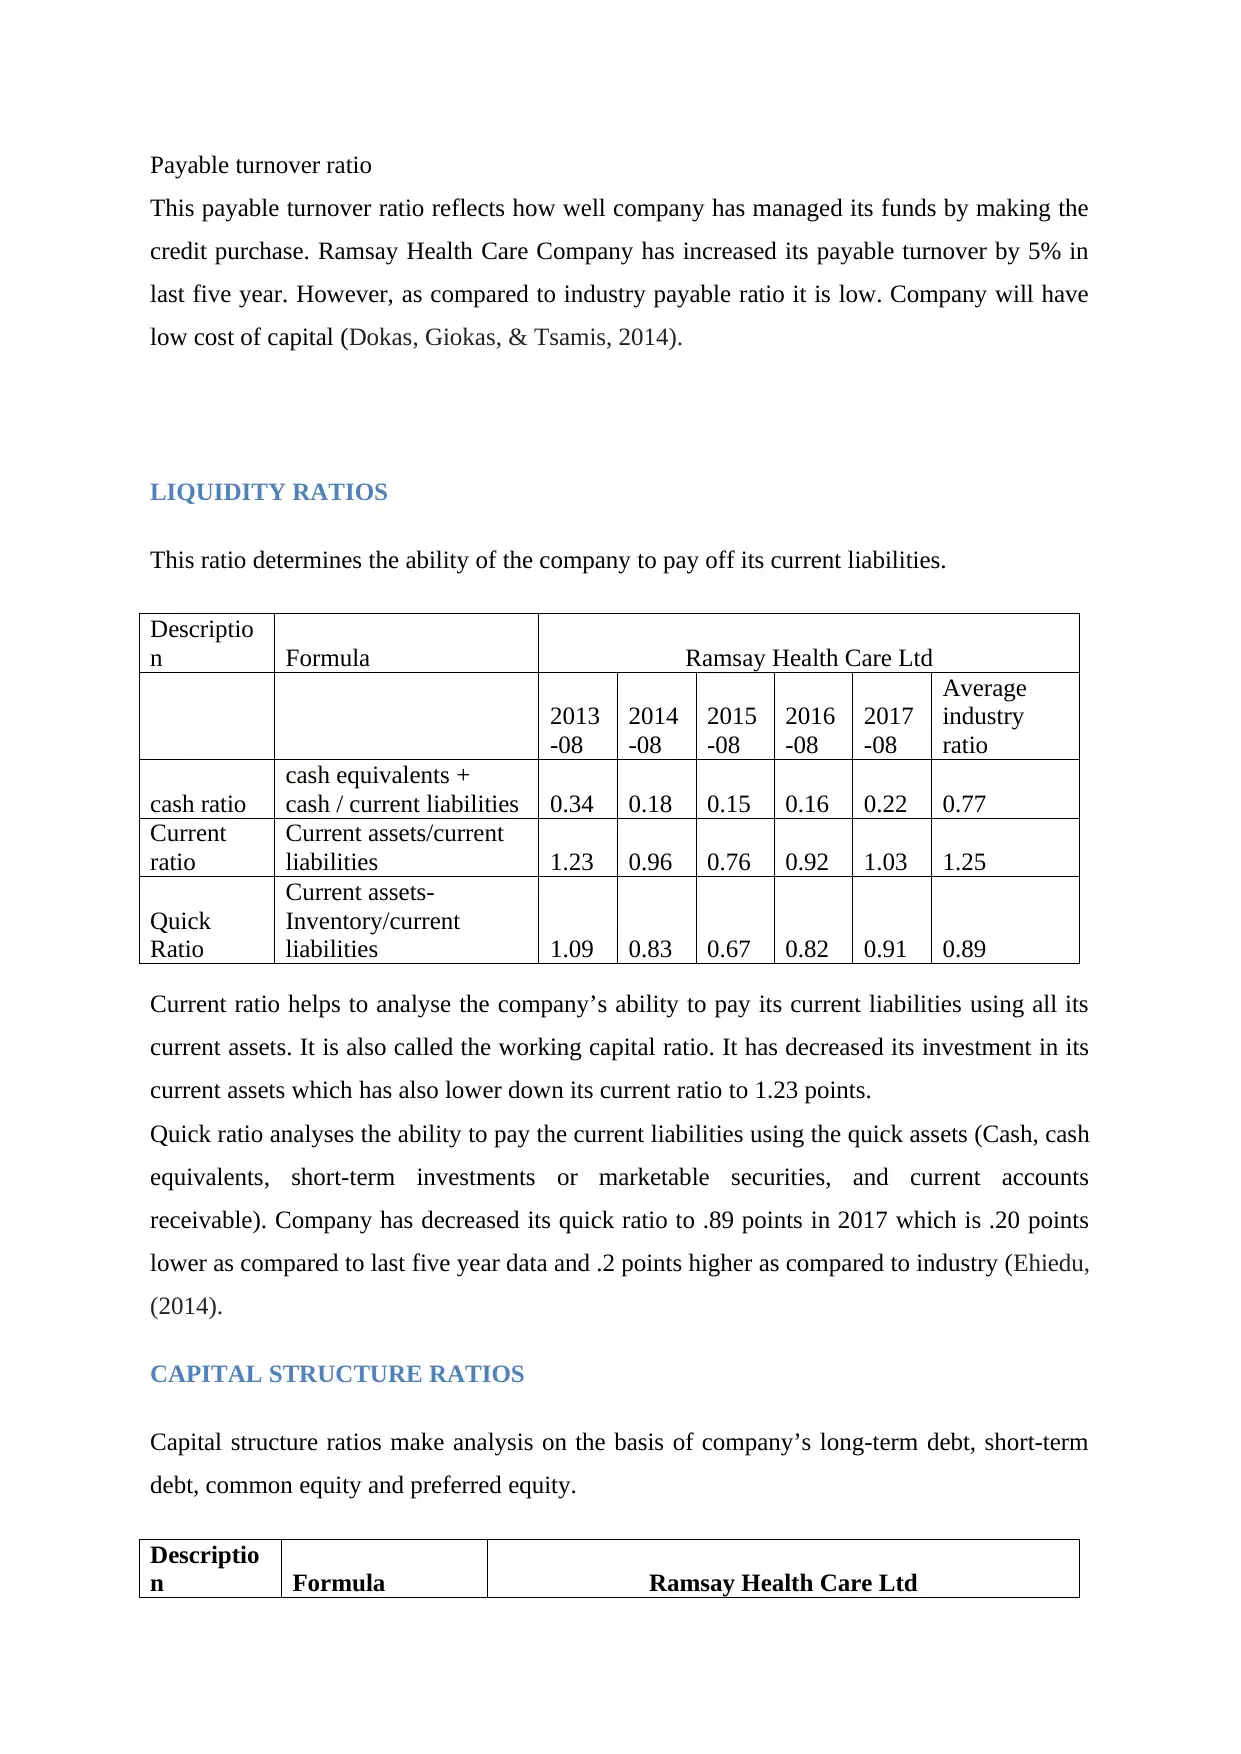
Payable turnover ratio
This payable turnover ratio reflects how well company has managed its funds by making the
credit purchase. Ramsay Health Care Company has increased its payable turnover by 5% in
last five year. However, as compared to industry payable ratio it is low. Company will have
low cost of capital (Dokas, Giokas, & Tsamis, 2014).
LIQUIDITY RATIOS
This ratio determines the ability of the company to pay off its current liabilities.
Descriptio
n Formula Ramsay Health Care Ltd
2013
-08
2014
-08
2015
-08
2016
-08
2017
-08
Average
industry
ratio
cash ratio
cash equivalents +
cash / current liabilities 0.34 0.18 0.15 0.16 0.22 0.77
Current
ratio
Current assets/current
liabilities 1.23 0.96 0.76 0.92 1.03 1.25
Quick
Ratio
Current assets-
Inventory/current
liabilities 1.09 0.83 0.67 0.82 0.91 0.89
Current ratio helps to analyse the company’s ability to pay its current liabilities using all its
current assets. It is also called the working capital ratio. It has decreased its investment in its
current assets which has also lower down its current ratio to 1.23 points.
Quick ratio analyses the ability to pay the current liabilities using the quick assets (Cash, cash
equivalents, short-term investments or marketable securities, and current accounts
receivable). Company has decreased its quick ratio to .89 points in 2017 which is .20 points
lower as compared to last five year data and .2 points higher as compared to industry (Ehiedu,
(2014).
CAPITAL STRUCTURE RATIOS
Capital structure ratios make analysis on the basis of company’s long-term debt, short-term
debt, common equity and preferred equity.
Descriptio
n Formula Ramsay Health Care Ltd
Paraphrase This Document
Need a fresh take? Get an instant paraphrase of this document with our AI Paraphraser
2013-
08 2014-08
2015-
08
2016-
08
2017-
08
Average
industry
ratio
Times
interest
earned
EBIT / Interest
expenses 6.0 6.6 6.0 6.3 6.6 7.6
Cash
coverage
ratio
EBIT + non-cash
expenses / interest
expenses
407.0
0 501.00
733.0
0
820.0
0
848.0
0 858
Debt to
Equity
Ratio Debt/ Equity 1.63 1.67 3.10 3.09 2.66 3.7
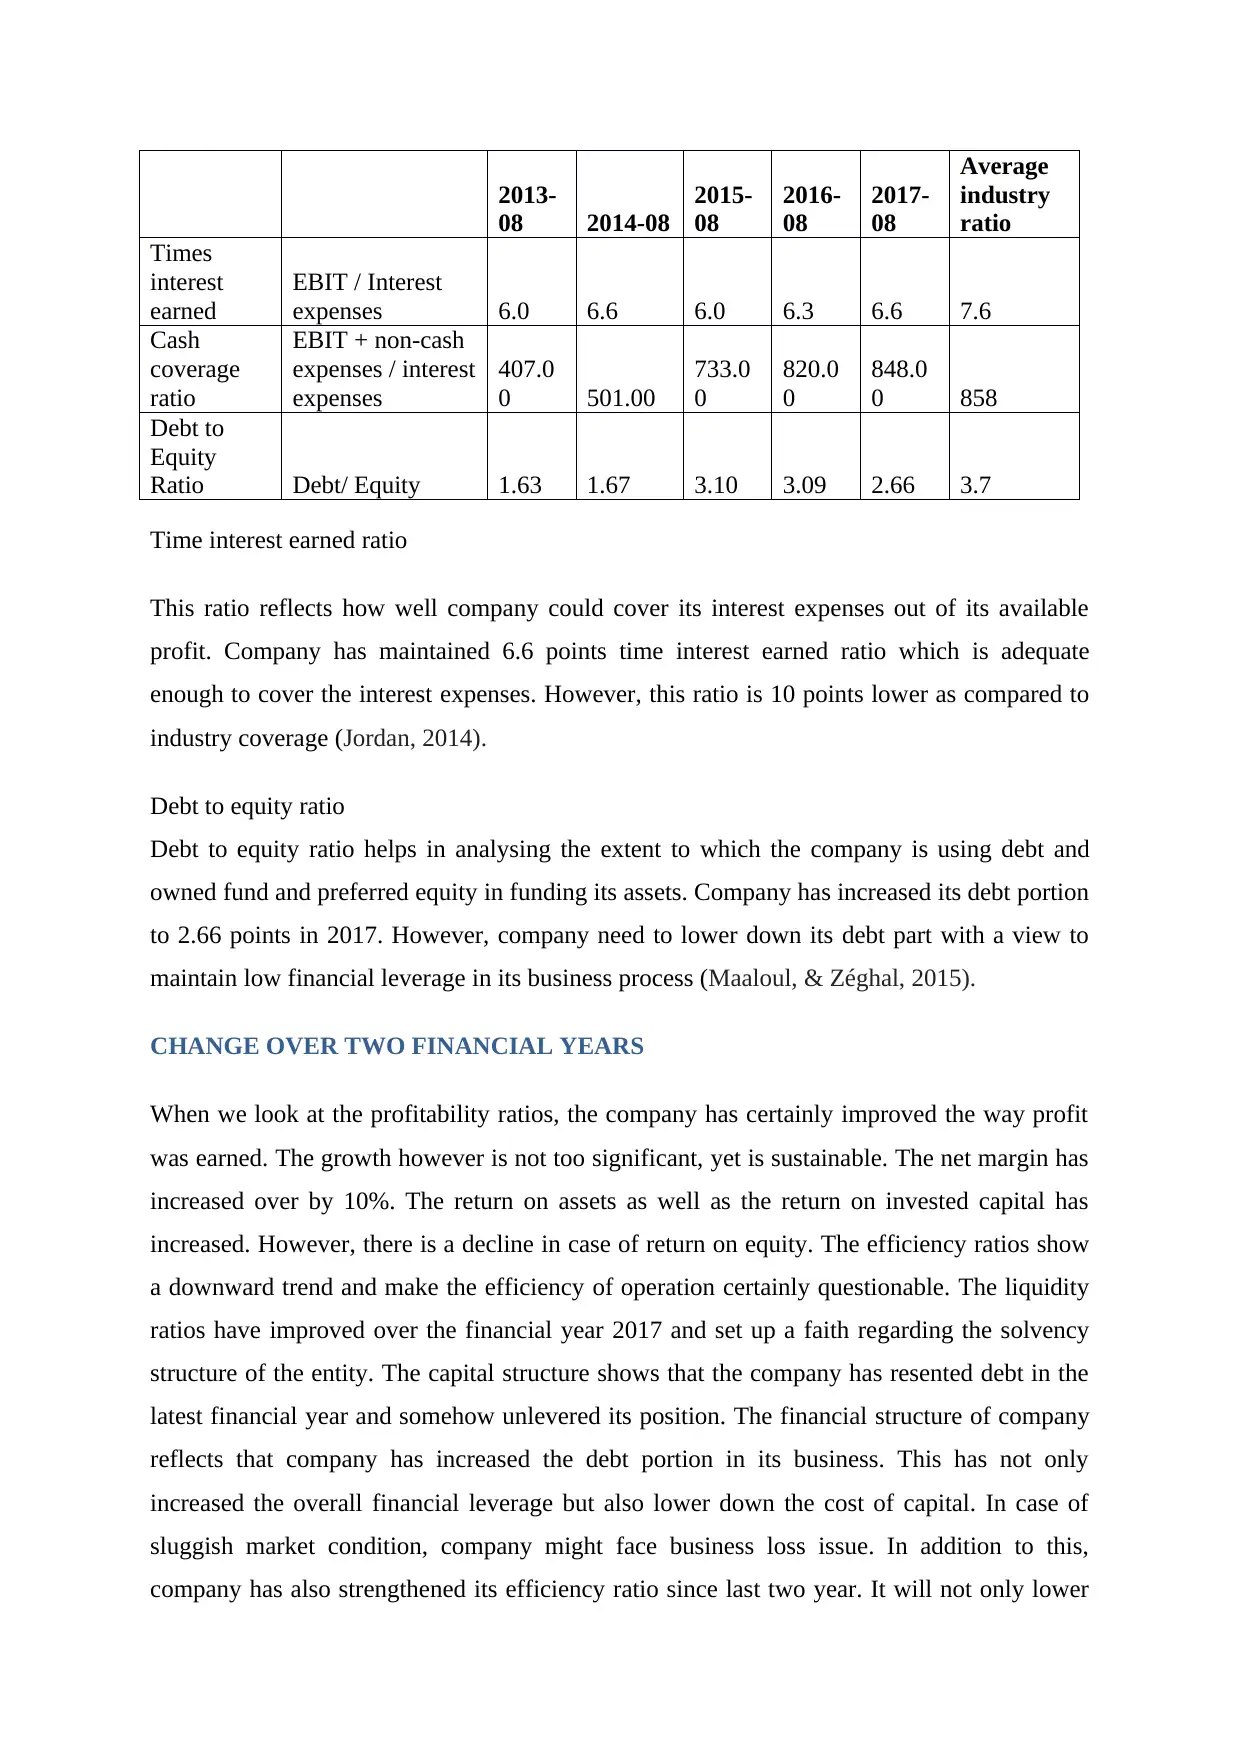
Time interest earned ratio
This ratio reflects how well company could cover its interest expenses out of its available
profit. Company has maintained 6.6 points time interest earned ratio which is adequate
enough to cover the interest expenses. However, this ratio is 10 points lower as compared to
industry coverage (Jordan, 2014).
Debt to equity ratio
Debt to equity ratio helps in analysing the extent to which the company is using debt and
owned fund and preferred equity in funding its assets. Company has increased its debt portion
to 2.66 points in 2017. However, company need to lower down its debt part with a view to
maintain low financial leverage in its business process (Maaloul, & Zéghal, 2015).
CHANGE OVER TWO FINANCIAL YEARS
When we look at the profitability ratios, the company has certainly improved the way profit
was earned. The growth however is not too significant, yet is sustainable. The net margin has
increased over by 10%. The return on assets as well as the return on invested capital has
increased. However, there is a decline in case of return on equity. The efficiency ratios show
a downward trend and make the efficiency of operation certainly questionable. The liquidity
ratios have improved over the financial year 2017 and set up a faith regarding the solvency
structure of the entity. The capital structure shows that the company has resented debt in the
latest financial year and somehow unlevered its position. The financial structure of company
reflects that company has increased the debt portion in its business. This has not only
increased the overall financial leverage but also lower down the cost of capital. In case of
sluggish market condition, company might face business loss issue. In addition to this,
company has also strengthened its efficiency ratio since last two year. It will not only lower
08 2014-08
2015-
08
2016-
08
2017-
08
Average
industry
ratio
Times
interest
earned
EBIT / Interest
expenses 6.0 6.6 6.0 6.3 6.6 7.6
Cash
coverage
ratio
EBIT + non-cash
expenses / interest
expenses
407.0
0 501.00
733.0
0
820.0
0
848.0
0 858
Debt to
Equity
Ratio Debt/ Equity 1.63 1.67 3.10 3.09 2.66 3.7
Time interest earned ratio
This ratio reflects how well company could cover its interest expenses out of its available
profit. Company has maintained 6.6 points time interest earned ratio which is adequate
enough to cover the interest expenses. However, this ratio is 10 points lower as compared to
industry coverage (Jordan, 2014).
Debt to equity ratio
Debt to equity ratio helps in analysing the extent to which the company is using debt and
owned fund and preferred equity in funding its assets. Company has increased its debt portion
to 2.66 points in 2017. However, company need to lower down its debt part with a view to
maintain low financial leverage in its business process (Maaloul, & Zéghal, 2015).
CHANGE OVER TWO FINANCIAL YEARS
When we look at the profitability ratios, the company has certainly improved the way profit
was earned. The growth however is not too significant, yet is sustainable. The net margin has
increased over by 10%. The return on assets as well as the return on invested capital has
increased. However, there is a decline in case of return on equity. The efficiency ratios show
a downward trend and make the efficiency of operation certainly questionable. The liquidity
ratios have improved over the financial year 2017 and set up a faith regarding the solvency
structure of the entity. The capital structure shows that the company has resented debt in the
latest financial year and somehow unlevered its position. The financial structure of company
reflects that company has increased the debt portion in its business. This has not only
increased the overall financial leverage but also lower down the cost of capital. In case of
sluggish market condition, company might face business loss issue. In addition to this,
company has also strengthened its efficiency ratio since last two year. It will not only lower
down the cost of capital but also increase the efficiency of the business. Company has also
planned to invest its capital in other business with a view to diversify its business and
expanding the market (Rakićević, Milošević, Petrović, & Radojević, 2016). The management
department of Ramsay Health care needs to focus on increasing the overall turnover.
Looking at the growth structure of the company, it’s evident that there is a decline in the
growth percentage. But, the ratios do reveal that profitability has risen. The payout ratio has
risen which is certainly a good news for the current investors. As a result it is sure that the
company is on better footing as compared to financial year 2016. Company has been
planning to enter into the strategic alliance with other organizations so that it could expand its
business in long run (Weygandt., Kimmel, & Kieso, 2015).
In context with the external environmental factors, it is analyzed that company needs to focus
on developing the cost leadership and product differentiation strategy in market. This strategy
will not only increase the overall outcomes but also strengthen the business position of
company in long run. Nonetheless, the cost leadership strategy will assist Ramsay company
to increase its overall turnover and profitability as well. The political environment of UK has
been very stable which could be used by company to expand its business by undertaking the
existing political factors (Yahoo Finance., 2017).
RECOMMENDATION
With the changes in business situation and economic condition, it could be suggested that
Ramsay Company needs to bring several changes in its business process to strengthen its
business process in long run. The main changes would be to change the capital structure to
eliminate the financial leverage risk in its business. Although there are strong chances of the
company to perfectly succeed, however there may be certain things that can be followed to
keep the pace on to increase the overall market share and lower down the external risk of the
business (Yahoo Finance. 2017).
The company can look after for the competitors in the same field and try to figure things for a
business merger in order to capture large market area and avoid competition. The merger and
amalgamation with the other organizations may be the good resort for company to strengthen
its brand image and increasing the overall business output.
⊘ This is a preview!⊘
Do you want full access?
Subscribe today to unlock all pages.
Trusted by 1+ million students worldwide
The recent government policies should be exploited to make business policies that benefit out
of the political scenario. Ramsay could use the benefit of double taxation avoidance
agreement and other tax treaty to strengthen the overall business situation in market.
As per the stakeholder’s theory, company should keep its business transparent by following
the IFRS rules and regulation in its reporting frameworks. Nonetheless, Meeting should be
held with the shareholders to figure out whether the dividend amount should be raised or
reinvested in business to attain higher growth (Travlos, Trigeorgis, & Vafeas, 2015). Ramsay
should increase the overall return on capital employed and return on equity for its
shareholders. It will assist company to raise more capital from the market from its
shareholders. If shareholders find that company is creating value on its investment then they
would be ready to invest more capital in Ramsay Health care.
The credit policies should be revised in order to improvise the company’s ability to collect
cash faster and avoid chances of bad debts. The efficiency ratio has reflected that company
needs to improve its credit policies which would assist company to efficiently deploy its
funds in process.
The marketing agenda should be revamped to inculcate such policies that focus on increasing
the sales of company. Ramsay health care needs to undertake online system to promote its
marketing plan and strengthen the communication with its clients. It will assist company to
grasp potential clients in long run.
More focus should be made on corporate social responsibility activities, to make the company
more socially acceptable and popular (Luo, Wang, Raithel, & Zheng, 2015). However,
Ramsay has been contributing 5% of its average five year net profit in its CSR activities. This
will assist company to set up strong brand image in long run.
As per the wealth maximization theory, company should consistently issue dividend and
bonus to its shareholders so that it could increase the overall return available to equity
shareholders (Zainudin, & Hashim, 2016).
Company also needs to hire more expert employees and staff members who could assist its
clients in their better satisfaction.
Paraphrase This Document
Need a fresh take? Get an instant paraphrase of this document with our AI Paraphraser
Conclusion
The financial ratio analysis has assisted in assessment of the financial performance of
Ramsay Healthcare in long run. It is analyzed that Company has high financial leverage in its
business which needs to be lower down by company with a view to make sustainable
business in sluggish market condition. In addition to this, company should also take merger
and amalgamation with other organizations with a view to cope up with the advance
technologies challenges and ramified economic demand. Company has good amount of
profitability in its business and increasing its overall turnover throughout the time. However,
company should invest more capital in installing new technologies and services to expand its
business by increasing its overall turnover. Now in the end, it could be inferred that company
should increase its investment in its current assets. Company should increase the overall
return on equity available to equity shareholders if it wants to attract more capital for its
business expansion.
REFERENCES
Babalola, Y. A., & Abiola, F. R. (2013). Financial ratio analysis of firms: A tool for decision
making. International journal of management sciences, 1(4), 132-137.
Brigham, E.F., Ehrhardt, M.C., Nason, R.R. & Gessaroli, J., 2016. Financial Managment:
Theory and Practice, Canadian Edition. Nelson Education.
Dagwell, R., Wines, G. & Lambert, C., (2015). Corporate accounting in Australia. Pearson
Higher Education AU.
Delen, D., Kuzey, C., & Uyar, A. (2013). Measuring firm performance using financial ratios:
A decision tree approach. Expert Systems with Applications, 40(10), 3970-3983.
Dokas, I., Giokas, D. & Tsamis, A., (2014). Liquidity efficiency in the Greek listed firms: a
financial ratio based on data envelopment analysis. International Journal of
Corporate Finance and Accounting (IJCFA), 1(1), pp.40-59.
Ehiedu, V.C., (2014). The impact of liquidity on profitability of some selected companies:
The financial statement analysis (FSA) approach. Research Journal of Finance and
Accounting, 5(5), pp.81-90.
Heikal, M., Khaddafi, M., & Ummah, A. (2014). Influence analysis of return on assets
(ROA), return on equity (ROE), net profit margin (NPM), debt to equity ratio (DER),
and current ratio (CR), against corporate profit growth in automotive in Indonesia
Stock Exchange. International Journal of Academic Research in Business and Social
Sciences, 4(12), 101.
Jordan, B., (2014). Fundamentals of investments. McGraw-Hill Higher Education.
Luo, X., Wang, H., Raithel, S., & Zheng, Q. (2015). Corporate social performance, analyst
stock recommendations, and firm future returns. Strategic Management
Journal, 36(1), 123-136.
Maaloul, A. & Zéghal, D., (2015). Financial statement informativeness and intellectual
capital disclosure: An empirical analysis. Journal of Financial Reporting and
Accounting, 13(1), pp.66-90.
⊘ This is a preview!⊘
Do you want full access?
Subscribe today to unlock all pages.
Trusted by 1+ million students worldwide
1 out of 15
Related Documents


Your All-in-One AI-Powered Toolkit for Academic Success.
+13062052269
info@desklib.com
Available 24*7 on WhatsApp / Email
![[object Object]](/_next/static/media/star-bottom.7253800d.svg)
Unlock your academic potential
Copyright © 2020–2026 A2Z Services. All Rights Reserved. Developed and managed by ZUCOL.