Financial Market Analysis: Abacus vs. Aveo Real Estate Companies
VerifiedAdded on 2020/10/04
|18
|4077
|36
Report
AI Summary
This report presents a comprehensive financial analysis of the Australian real estate market, focusing on Abacus Property Group Stapled (ABP) and Aveo Group Stapled (AOG), both listed on the Australian Securities Exchange (ASX). The analysis employs a top-down approach, examining the impact of economic fundamentals such as interest rates, currency value, GDP, inflation, and exchange rates on the performance and share prices of these companies. A bottom-up analysis is also conducted, utilizing financial ratios for 2016 and 2017 to assess profitability, liquidity, efficiency, solvency, and dividend payout. The report compares the performance of ABP and AOG, providing insights into their financial health relative to industry standards. The conclusion offers recommendations for both firms and investors based on the findings.

PRINCIPLE OF
FINANCIAL MARKETING
FINANCIAL MARKETING
Paraphrase This Document
Need a fresh take? Get an instant paraphrase of this document with our AI Paraphraser
EXECUTIVE SUMMARY
Financial market is a place where different typeof securities, stock, fungible items,
derivatives and commodities are traded among the buyers and sellers. Generally, transactions are
done at low cost within the markets for gaining higher returns. Under this, stock, equity,
preference shares, bonds, etc., are included whereas commodity comprises with metal,
agricultural items, precious stones etc. The present study isbased upona fundamental analysis of
the companies that are listed in the stock market. Real estate industry is taken as a base where
Abacus Property Group Stapled and Aveo Group Stapled firms are taken into consideration.
Both these companies are listed in the Australian Securities Exchange (ASX) market. There are
wide range of aspects included in the economic environment that creates either negative or
positive impact on firm's performance. Along with this, the value of business and prices of shares
also get affected by such factors. Economic fundamentals affecting includes interest, inflation,
GDP, exchange rate, currency value etc. Apart from this, by considering accounting information
of Abacus and Aveo companies, business performance is also being measured over here.
Performance of both these firms are also compared with the real industry in the study of financial
market.
TABLE OF CONTENTS
INTRODUCTION...........................................................................................................................1
Introduction of the Australian real estate industry.................................................................1
Mission statement of selected firms.......................................................................................1
SECTION 1: TOP – DOWN ANALYSIS.......................................................................................2
Impact of economic fundamental changes on chosen business performance and its share prices
................................................................................................................................................2
SECTION 2: BOTTOM – UP ANALYSIS.....................................................................................3
Financial ratios of Abacus property and Aveo group for the year ended 2016 and 2017......3
Comparison with industry standards....................................................................................11
SUMMARY AND RECOMMENDATIONS................................................................................12
REFERENCES .............................................................................................................................14
⊘ This is a preview!⊘
Do you want full access?
Subscribe today to unlock all pages.
Trusted by 1+ million students worldwide
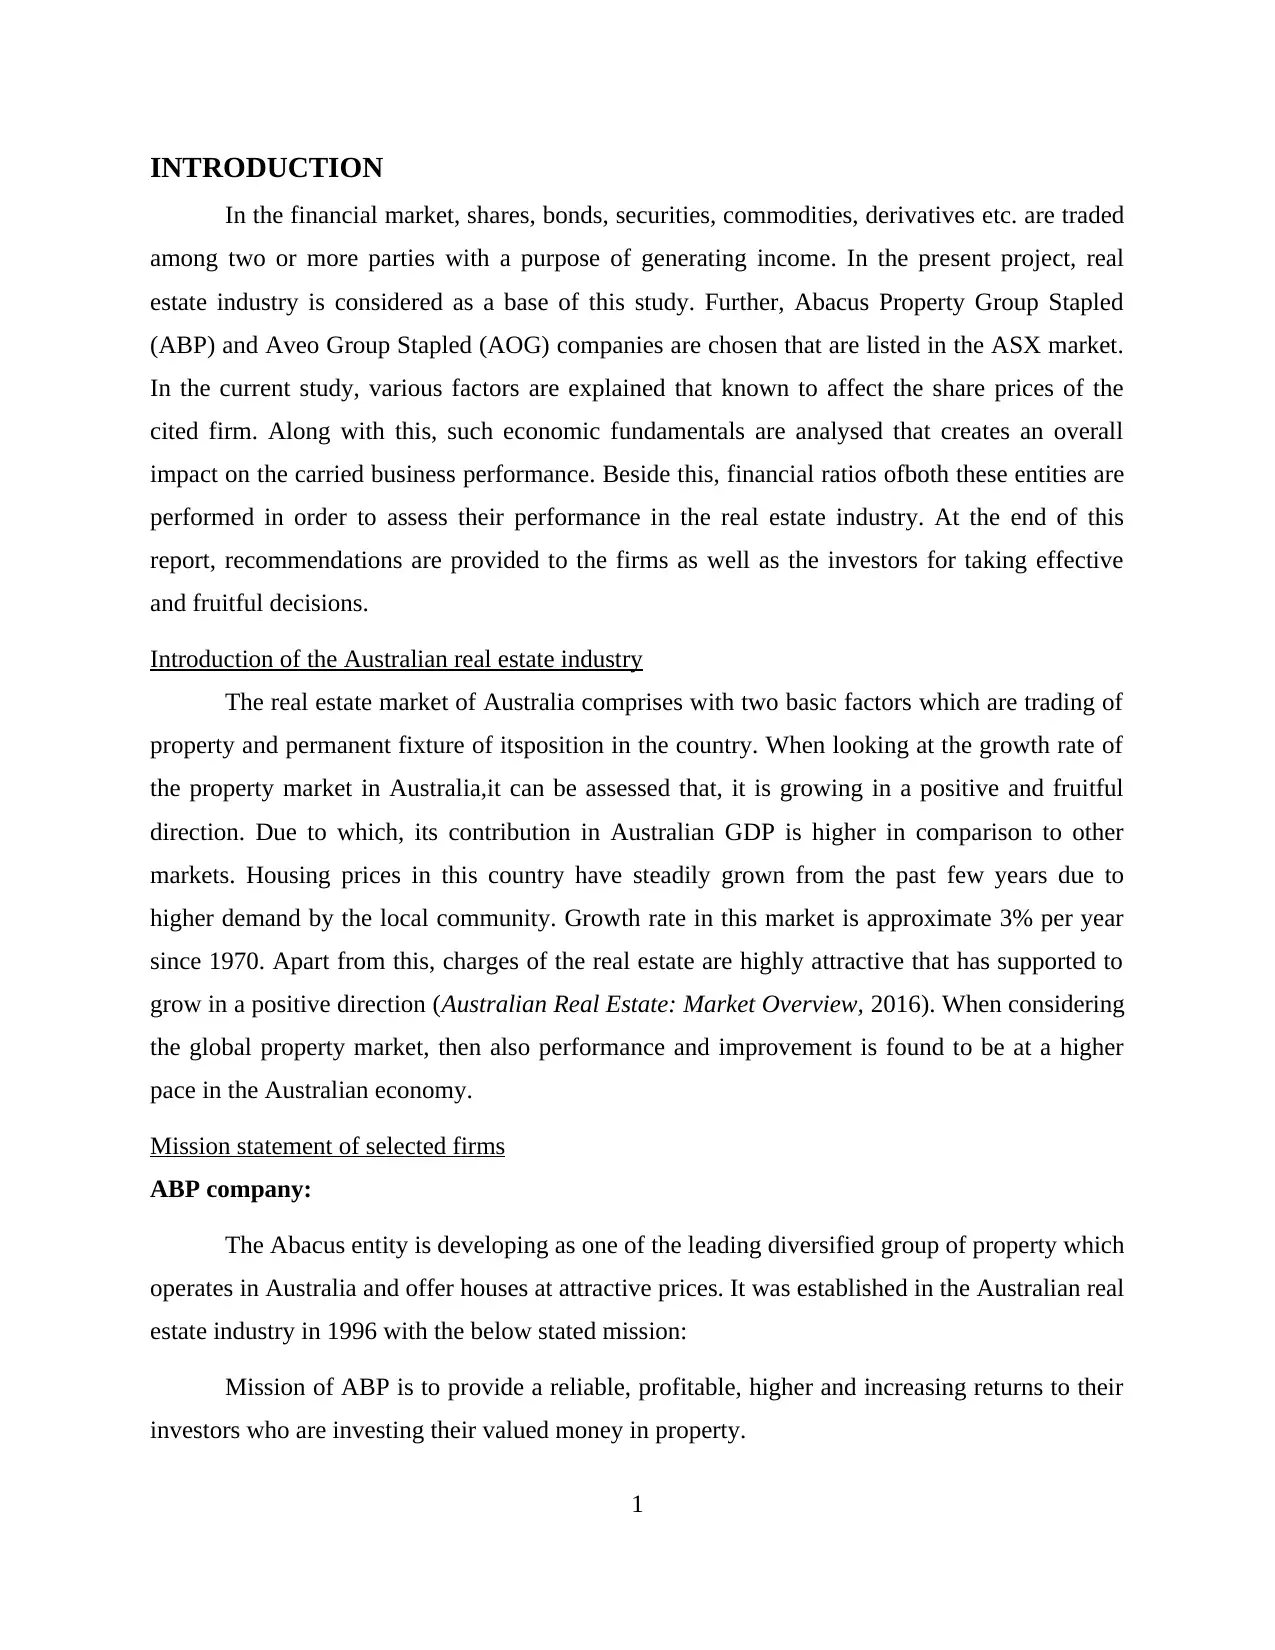
INTRODUCTION
In the financial market, shares, bonds, securities, commodities, derivatives etc. are traded
among two or more parties with a purpose of generating income. In the present project, real
estate industry is considered as a base of this study. Further, Abacus Property Group Stapled
(ABP) and Aveo Group Stapled (AOG) companies are chosen that are listed in the ASX market.
In the current study, various factors are explained that known to affect the share prices of the
cited firm. Along with this, such economic fundamentals are analysed that creates an overall
impact on the carried business performance. Beside this, financial ratios ofboth these entities are
performed in order to assess their performance in the real estate industry. At the end of this
report, recommendations are provided to the firms as well as the investors for taking effective
and fruitful decisions.
Introduction of the Australian real estate industry
The real estate market of Australia comprises with two basic factors which are trading of
property and permanent fixture of itsposition in the country. When looking at the growth rate of
the property market in Australia,it can be assessed that, it is growing in a positive and fruitful
direction. Due to which, its contribution in Australian GDP is higher in comparison to other
markets. Housing prices in this country have steadily grown from the past few years due to
higher demand by the local community. Growth rate in this market is approximate 3% per year
since 1970. Apart from this, charges of the real estate are highly attractive that has supported to
grow in a positive direction (Australian Real Estate: Market Overview, 2016). When considering
the global property market, then also performance and improvement is found to be at a higher
pace in the Australian economy.
Mission statement of selected firms
ABP company:
The Abacus entity is developing as one of the leading diversified group of property which
operates in Australia and offer houses at attractive prices. It was established in the Australian real
estate industry in 1996 with the below stated mission:
Mission of ABP is to provide a reliable, profitable, higher and increasing returns to their
investors who are investing their valued money in property.
1
Paraphrase This Document
Need a fresh take? Get an instant paraphrase of this document with our AI Paraphraser
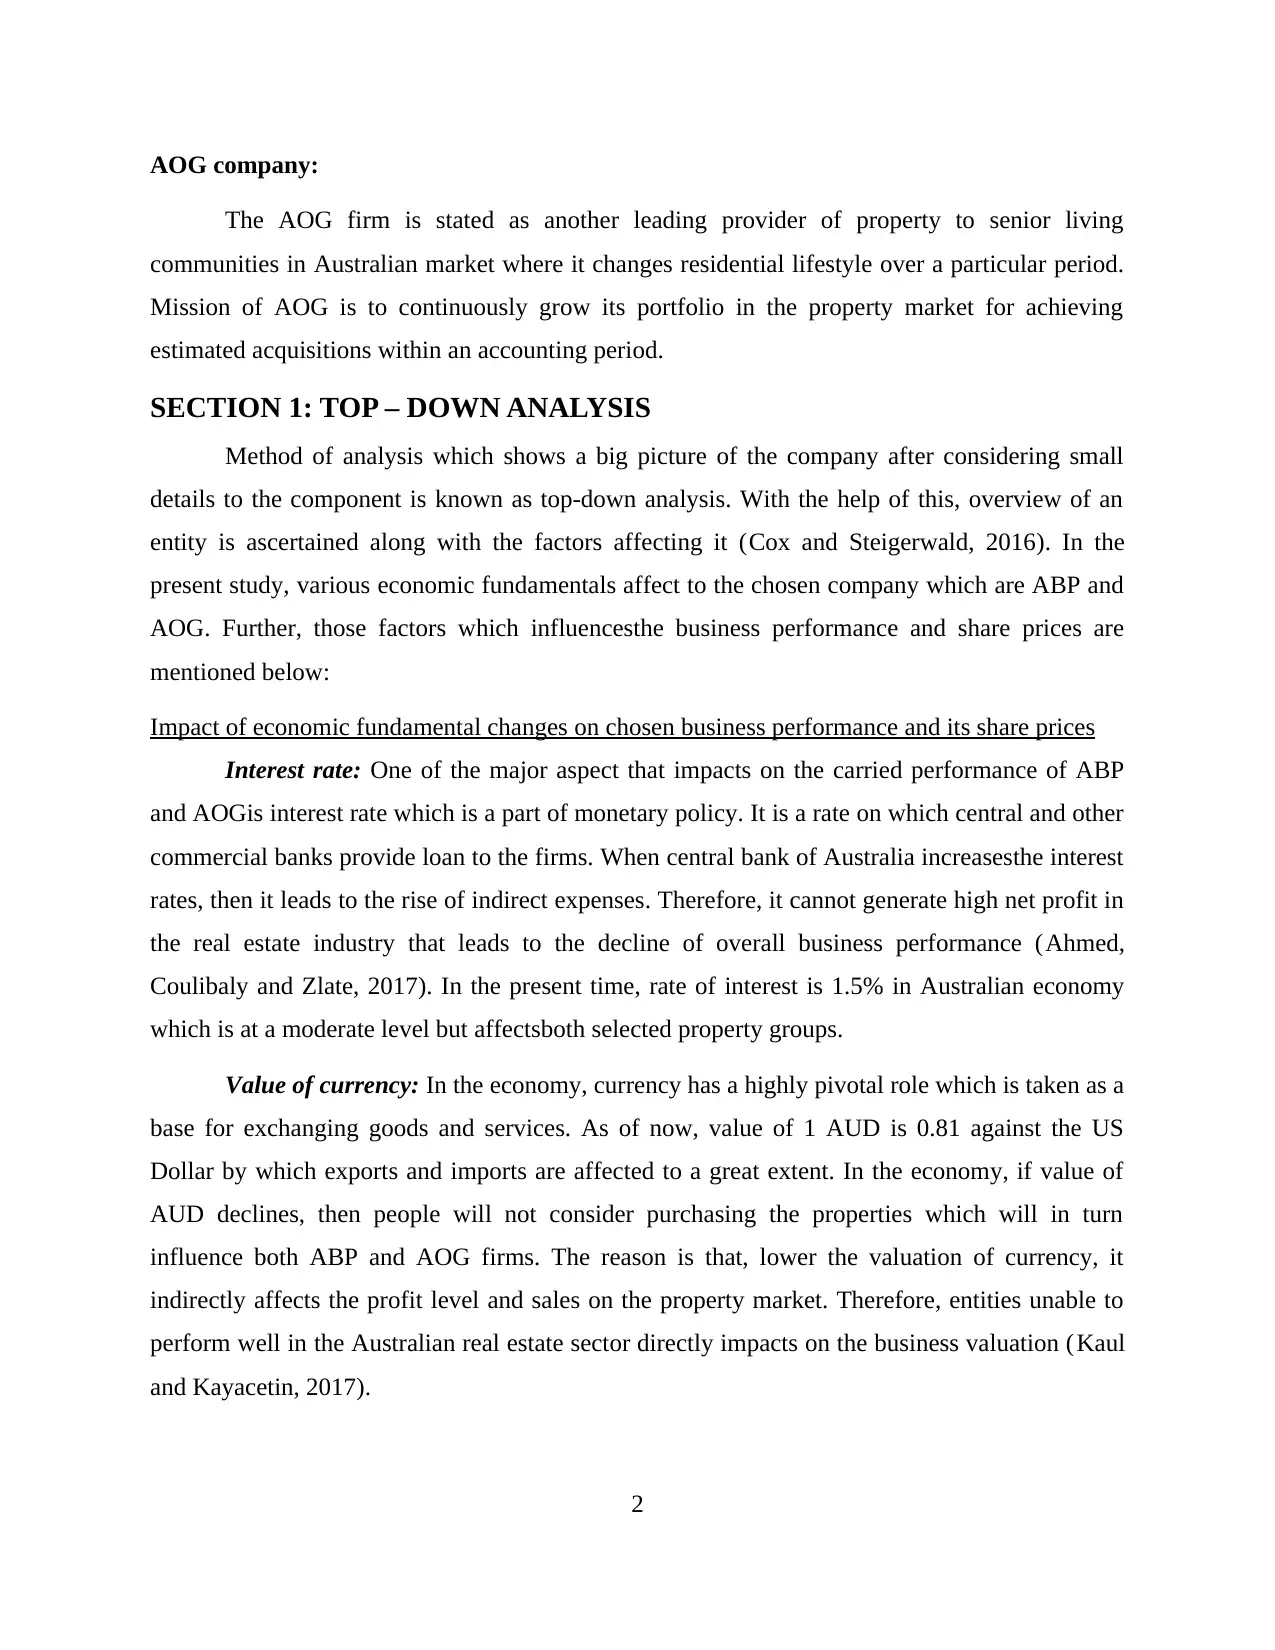
AOG company:
The AOG firm is stated as another leading provider of property to senior living
communities in Australian market where it changes residential lifestyle over a particular period.
Mission of AOG is to continuously grow its portfolio in the property market for achieving
estimated acquisitions within an accounting period.
SECTION 1: TOP – DOWN ANALYSIS
Method of analysis which shows a big picture of the company after considering small
details to the component is known as top-down analysis. With the help of this, overview of an
entity is ascertained along with the factors affecting it (Cox and Steigerwald, 2016). In the
present study, various economic fundamentals affect to the chosen company which are ABP and
AOG. Further, those factors which influencesthe business performance and share prices are
mentioned below:
Impact of economic fundamental changes on chosen business performance and its share prices
Interest rate: One of the major aspect that impacts on the carried performance of ABP
and AOGis interest rate which is a part of monetary policy. It is a rate on which central and other
commercial banks provide loan to the firms. When central bank of Australia increasesthe interest
rates, then it leads to the rise of indirect expenses. Therefore, it cannot generate high net profit in
the real estate industry that leads to the decline of overall business performance (Ahmed,
Coulibaly and Zlate, 2017). In the present time, rate of interest is 1.5% in Australian economy
which is at a moderate level but affectsboth selected property groups.
Value of currency: In the economy, currency has a highly pivotal role which is taken as a
base for exchanging goods and services. As of now, value of 1 AUD is 0.81 against the US
Dollar by which exports and imports are affected to a great extent. In the economy, if value of
AUD declines, then people will not consider purchasing the properties which will in turn
influence both ABP and AOG firms. The reason is that, lower the valuation of currency, it
indirectly affects the profit level and sales on the property market. Therefore, entities unable to
perform well in the Australian real estate sector directly impacts on the business valuation (Kaul
and Kayacetin, 2017).
2
Gross Domestic Product (GDP): The rate which reflects position of an economy within a
nation is called GDP and is one of the significant part of every country. With an enhanced rate of
GDP in Australia,businesses will beable to earn high level of sales and profit. The reason behind
this is high growth rate income of people which leads to enhance their purchasing power in the
economy. Therefore, AOG and ABP companies become more profitable and boost up
performance in the relevant sector. Current GDP of Australia is worth 1204.62 billion US dollars
which is lower than previous year’s statistics.
Inflation rate: Another fundamental of an economy through which performance of AOG
and Abacus affected is inflation rate. In the Australian economy, this rate is 1.9% as per the
analysis of July 2017 which has shown an increment from the last year (Inflation rate of
Australia, 2017). As the rate of inflation enhances in economy, this also leads to an increased
priceby to declining the sale of property in the market. Therefore, profit directly influences up to
a higher extent and cannot perform well in the industry. In overall economy, inflation is a highly
and directly influential component on the businesses of any industry.
Exchange rate: Other than the above stated economic aspects, exchange rate also has a
major impact on both cited enterprises. When rate of exchange is high or declines, then exports
and imports of the firm directly affectsthe economy (Smith, 2017). Hence, change in this
particular fundamental of economy influencesboth sales and business performance.
When looking at the share price which is influenced from economic factors,it can be said
that, through such fundamentals, they unable to boost up profit and performance as well.
Therefore, value of businesses in the market and relevant sector highly affected in same
direction. For instance: if income and performance of AOG and ABP declines due to GDP,then
valuation will obviouslyget influenced. Lower the business valuation, better for the listed firm
for raising share prices in ASX market (Grossmann, Paul and Simpson, 2017). Hence, if value of
companies reduces, then stock prices will also decline and vice-versa.
SECTION 2: BOTTOM – UP ANALYSIS
The approach in which only internal aspects are considered in order to perform
investigation of a particular company is identified as bottom-up analysis. It includes different
number of ways where financial ratio is one of the best technique (Cashin, Mohaddes and Raissi,
3
⊘ This is a preview!⊘
Do you want full access?
Subscribe today to unlock all pages.
Trusted by 1+ million students worldwide
2017). In the current case scenario, by using various ratios and industry averages performance of
ABP and AOG is being analysed.
Financial ratios of Abacus property and Aveo group for the year ended 2016 and 2017
Financial ratios of accounting period 2016
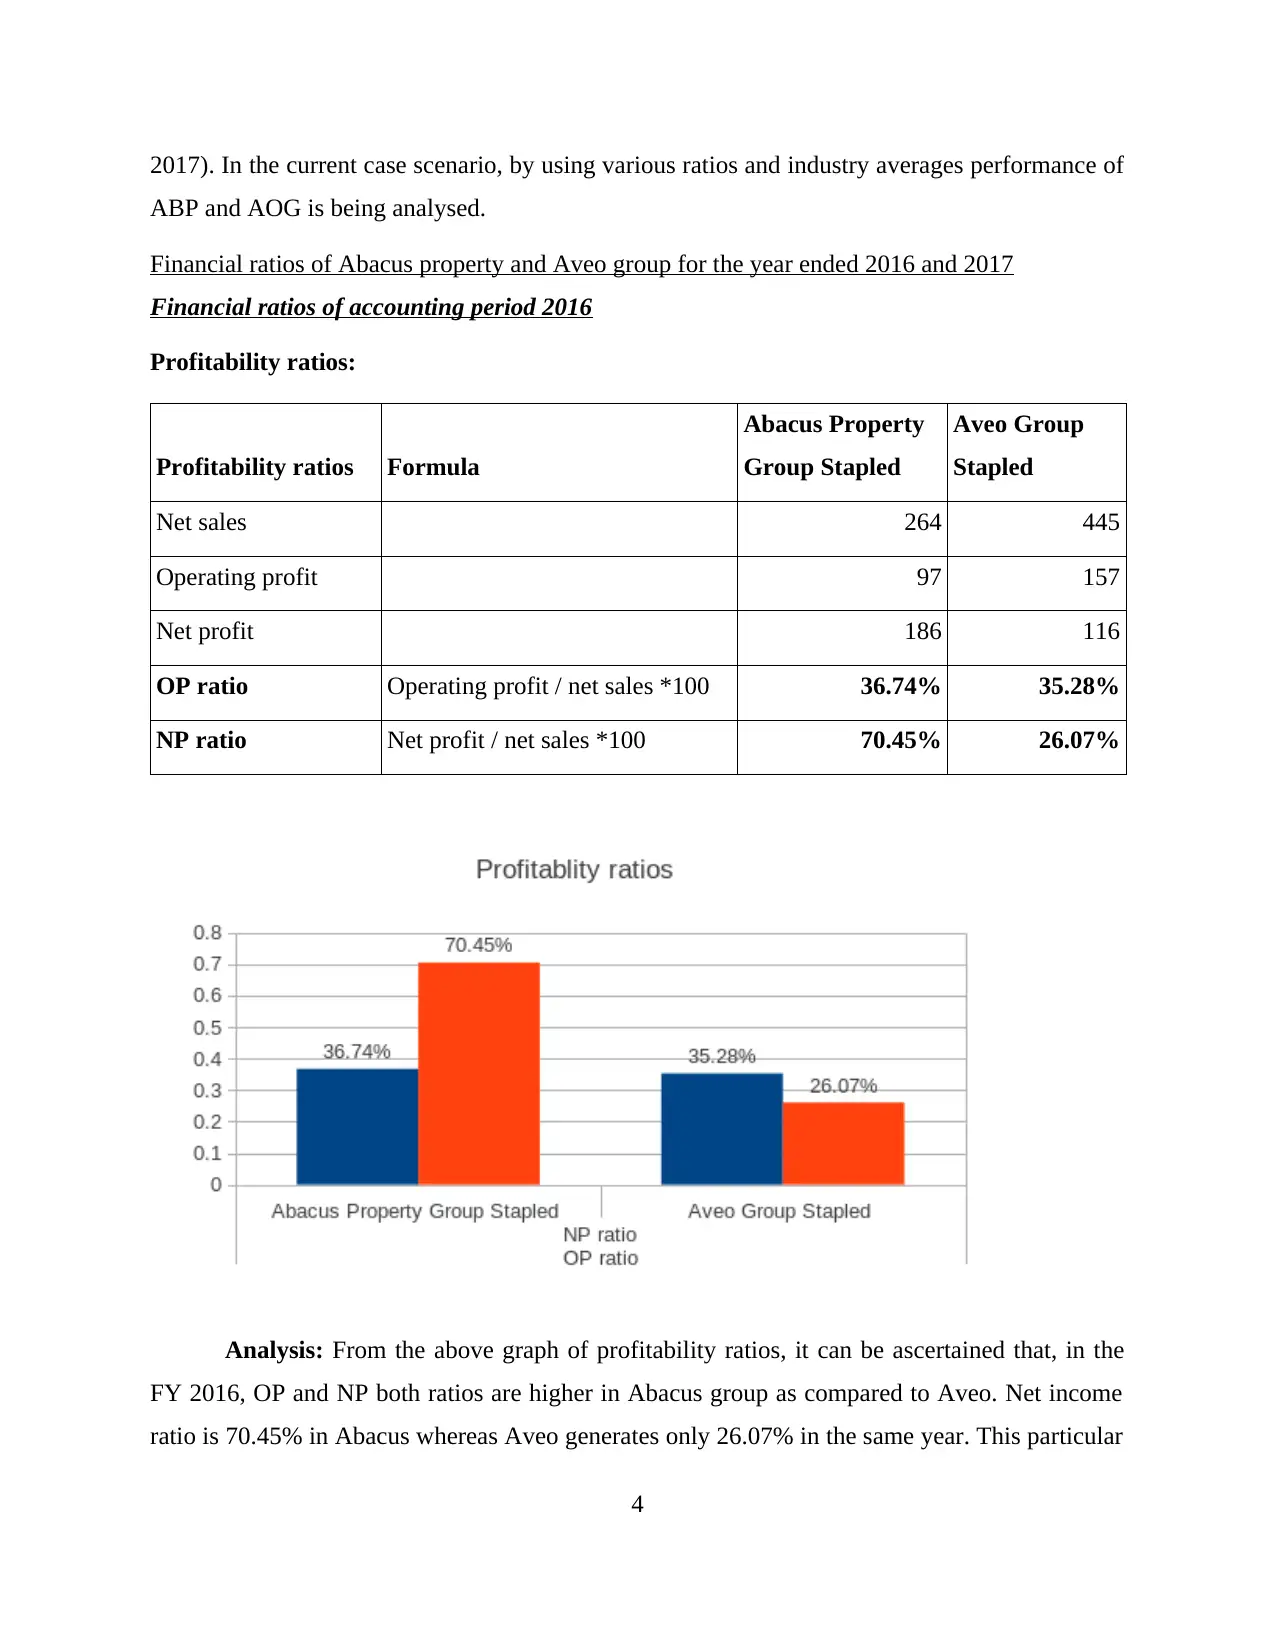
Profitability ratios:
Profitability ratios Formula
Abacus Property
Group Stapled
Aveo Group
Stapled
Net sales 264 445
Operating profit 97 157
Net profit 186 116
OP ratio Operating profit / net sales *100 36.74% 35.28%
NP ratio Net profit / net sales *100 70.45% 26.07%
Analysis: From the above graph of profitability ratios, it can be ascertained that, in the
FY 2016, OP and NP both ratios are higher in Abacus group as compared to Aveo. Net income
ratio is 70.45% in Abacus whereas Aveo generates only 26.07% in the same year. This particular
4
ABP and AOG is being analysed.
Financial ratios of Abacus property and Aveo group for the year ended 2016 and 2017
Financial ratios of accounting period 2016
Profitability ratios:
Profitability ratios Formula
Abacus Property
Group Stapled
Aveo Group
Stapled
Net sales 264 445
Operating profit 97 157
Net profit 186 116
OP ratio Operating profit / net sales *100 36.74% 35.28%
NP ratio Net profit / net sales *100 70.45% 26.07%
Analysis: From the above graph of profitability ratios, it can be ascertained that, in the
FY 2016, OP and NP both ratios are higher in Abacus group as compared to Aveo. Net income
ratio is 70.45% in Abacus whereas Aveo generates only 26.07% in the same year. This particular
4
Paraphrase This Document
Need a fresh take? Get an instant paraphrase of this document with our AI Paraphraser
situation clearly shows that Aveo was not able to manage and decline indirect expenses in the
financial period of 2015-16.
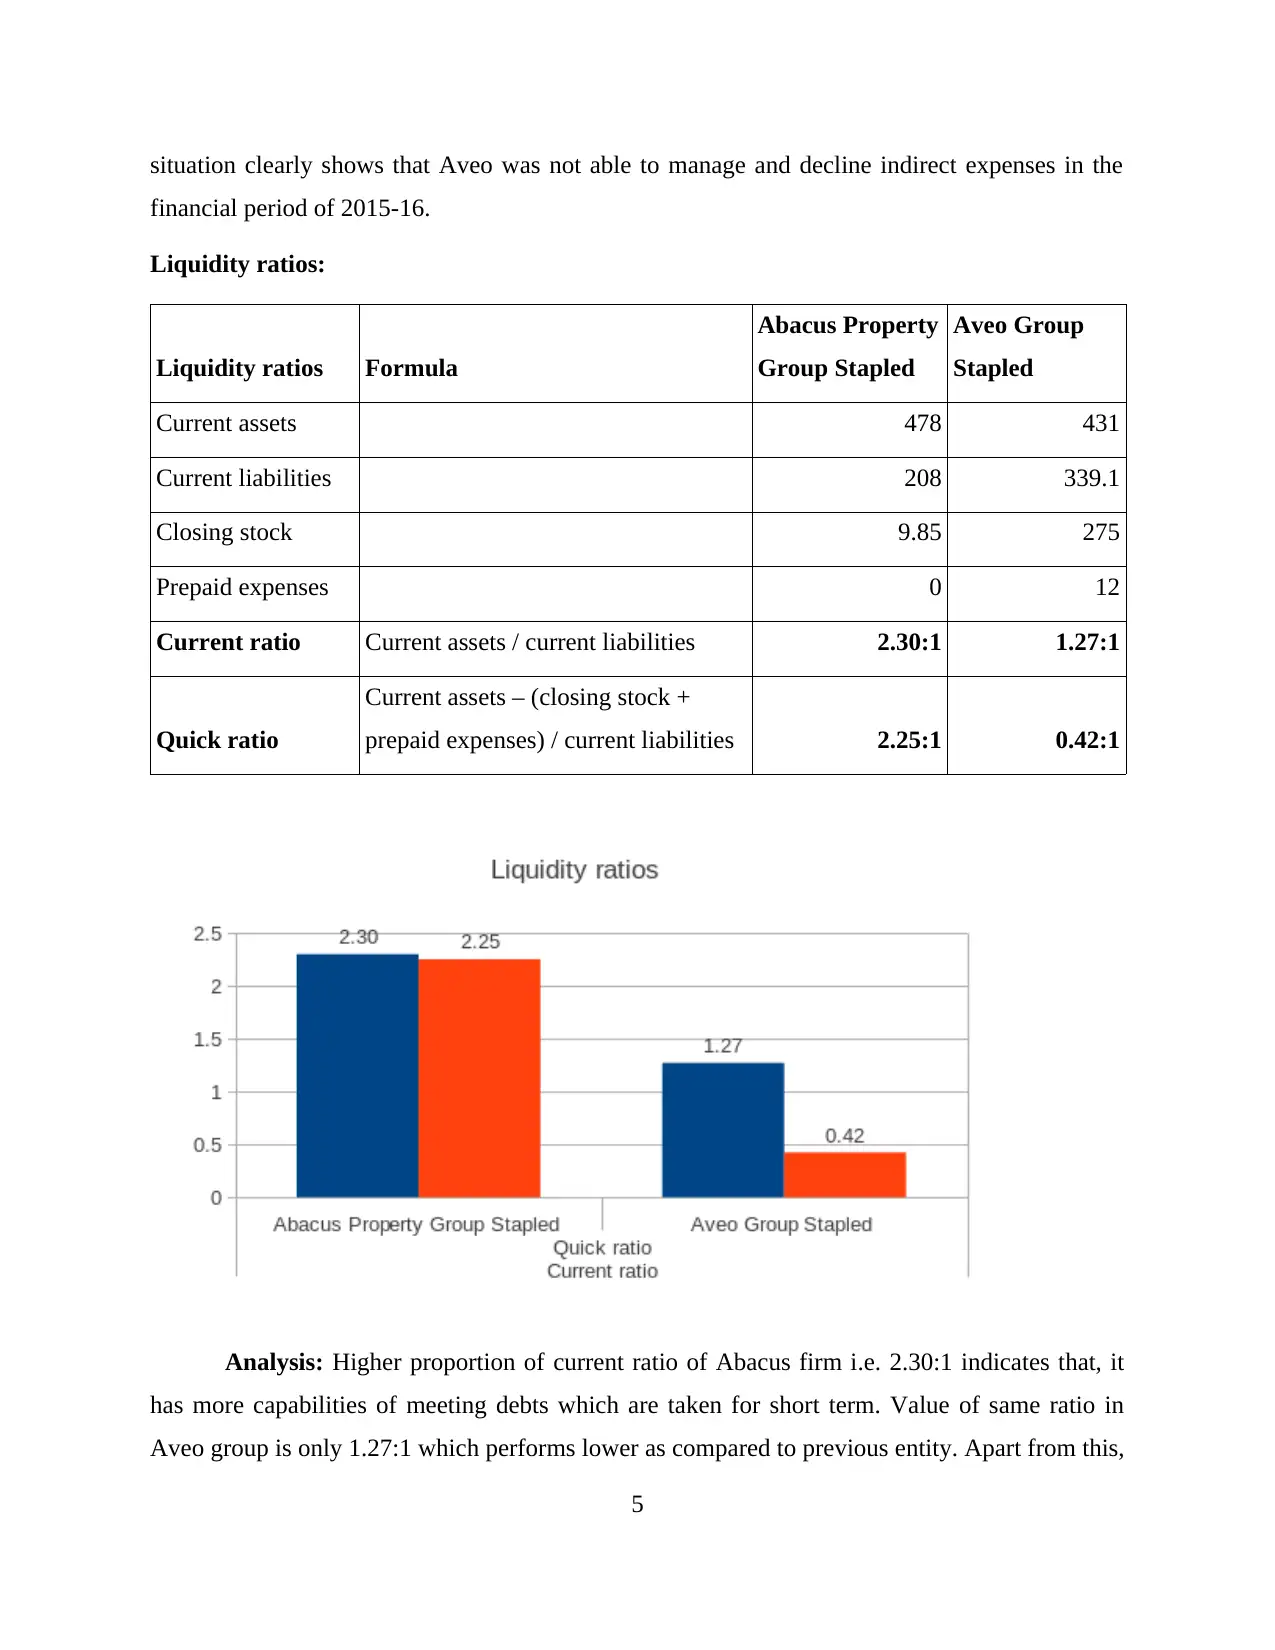
Liquidity ratios:
Liquidity ratios Formula
Abacus Property
Group Stapled
Aveo Group
Stapled
Current assets 478 431
Current liabilities 208 339.1
Closing stock 9.85 275
Prepaid expenses 0 12
Current ratio Current assets / current liabilities 2.30:1 1.27:1
Quick ratio
Current assets – (closing stock +
prepaid expenses) / current liabilities 2.25:1 0.42:1
Analysis: Higher proportion of current ratio of Abacus firm i.e. 2.30:1 indicates that, it
has more capabilities of meeting debts which are taken for short term. Value of same ratio in
Aveo group is only 1.27:1 which performs lower as compared to previous entity. Apart from this,
5
financial period of 2015-16.
Liquidity ratios:
Liquidity ratios Formula
Abacus Property
Group Stapled
Aveo Group
Stapled
Current assets 478 431
Current liabilities 208 339.1
Closing stock 9.85 275
Prepaid expenses 0 12
Current ratio Current assets / current liabilities 2.30:1 1.27:1
Quick ratio
Current assets – (closing stock +
prepaid expenses) / current liabilities 2.25:1 0.42:1
Analysis: Higher proportion of current ratio of Abacus firm i.e. 2.30:1 indicates that, it
has more capabilities of meeting debts which are taken for short term. Value of same ratio in
Aveo group is only 1.27:1 which performs lower as compared to previous entity. Apart from this,
5
quick ratio of ABP and AOG is 2.25:1 and 0.42:1 respectively in the year end of 2016 in which
Abacus has also performed well (Financials of Abacus Property Group, 2017).
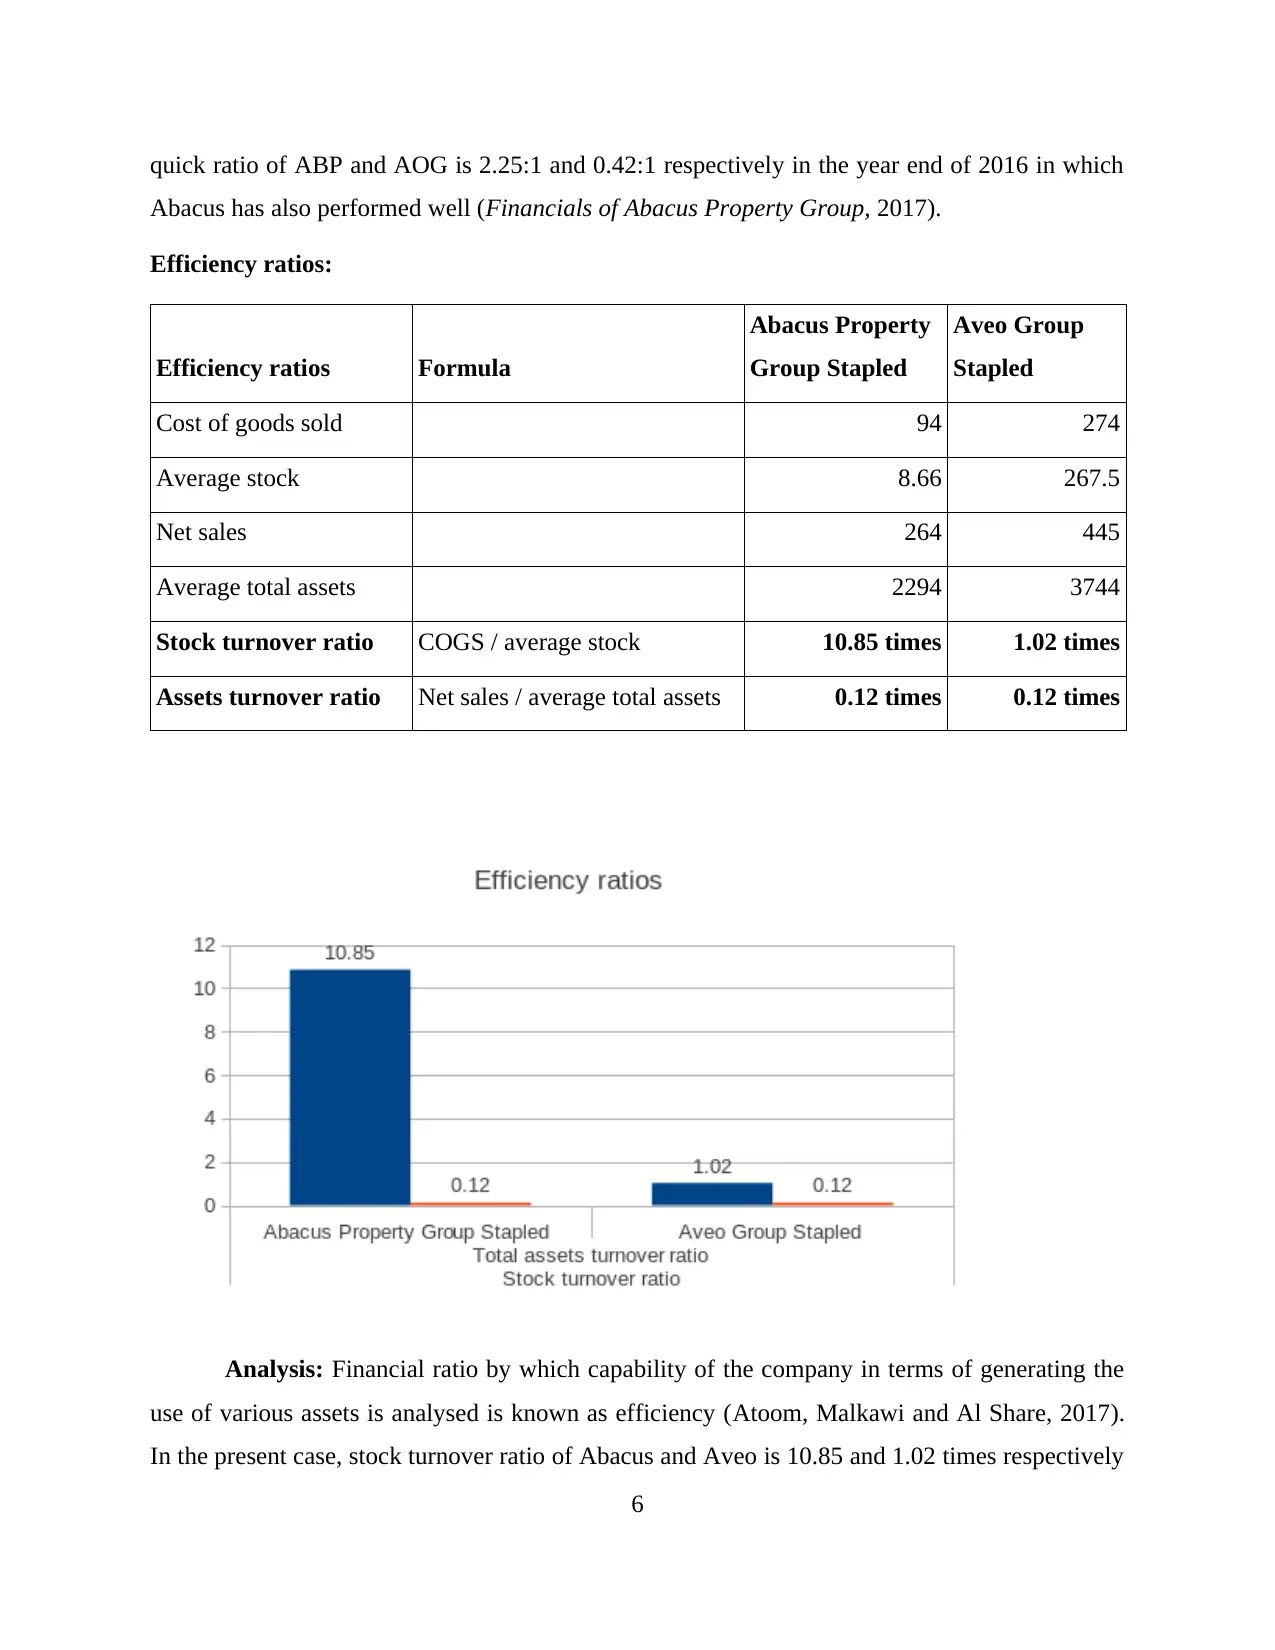
Efficiency ratios:
Efficiency ratios Formula
Abacus Property
Group Stapled
Aveo Group
Stapled
Cost of goods sold 94 274
Average stock 8.66 267.5
Net sales 264 445
Average total assets 2294 3744
Stock turnover ratio COGS / average stock 10.85 times 1.02 times
Assets turnover ratio Net sales / average total assets 0.12 times 0.12 times
Analysis: Financial ratio by which capability of the company in terms of generating the
use of various assets is analysed is known as efficiency (Atoom, Malkawi and Al Share, 2017).
In the present case, stock turnover ratio of Abacus and Aveo is 10.85 and 1.02 times respectively
6
Abacus has also performed well (Financials of Abacus Property Group, 2017).
Efficiency ratios:
Efficiency ratios Formula
Abacus Property
Group Stapled
Aveo Group
Stapled
Cost of goods sold 94 274
Average stock 8.66 267.5
Net sales 264 445
Average total assets 2294 3744
Stock turnover ratio COGS / average stock 10.85 times 1.02 times
Assets turnover ratio Net sales / average total assets 0.12 times 0.12 times
Analysis: Financial ratio by which capability of the company in terms of generating the
use of various assets is analysed is known as efficiency (Atoom, Malkawi and Al Share, 2017).
In the present case, stock turnover ratio of Abacus and Aveo is 10.85 and 1.02 times respectively
6
⊘ This is a preview!⊘
Do you want full access?
Subscribe today to unlock all pages.
Trusted by 1+ million students worldwide
in the fiscal period 2016. It reflects that, ABP utilisation is anaccessible inventory in an optimum
direction for generating revenue within workplace. When looking at another efficiency ratio,
then it can be said that, both performs equally in the year 2016. However, total assets turnover is
only 0.12 times which is extremely low.
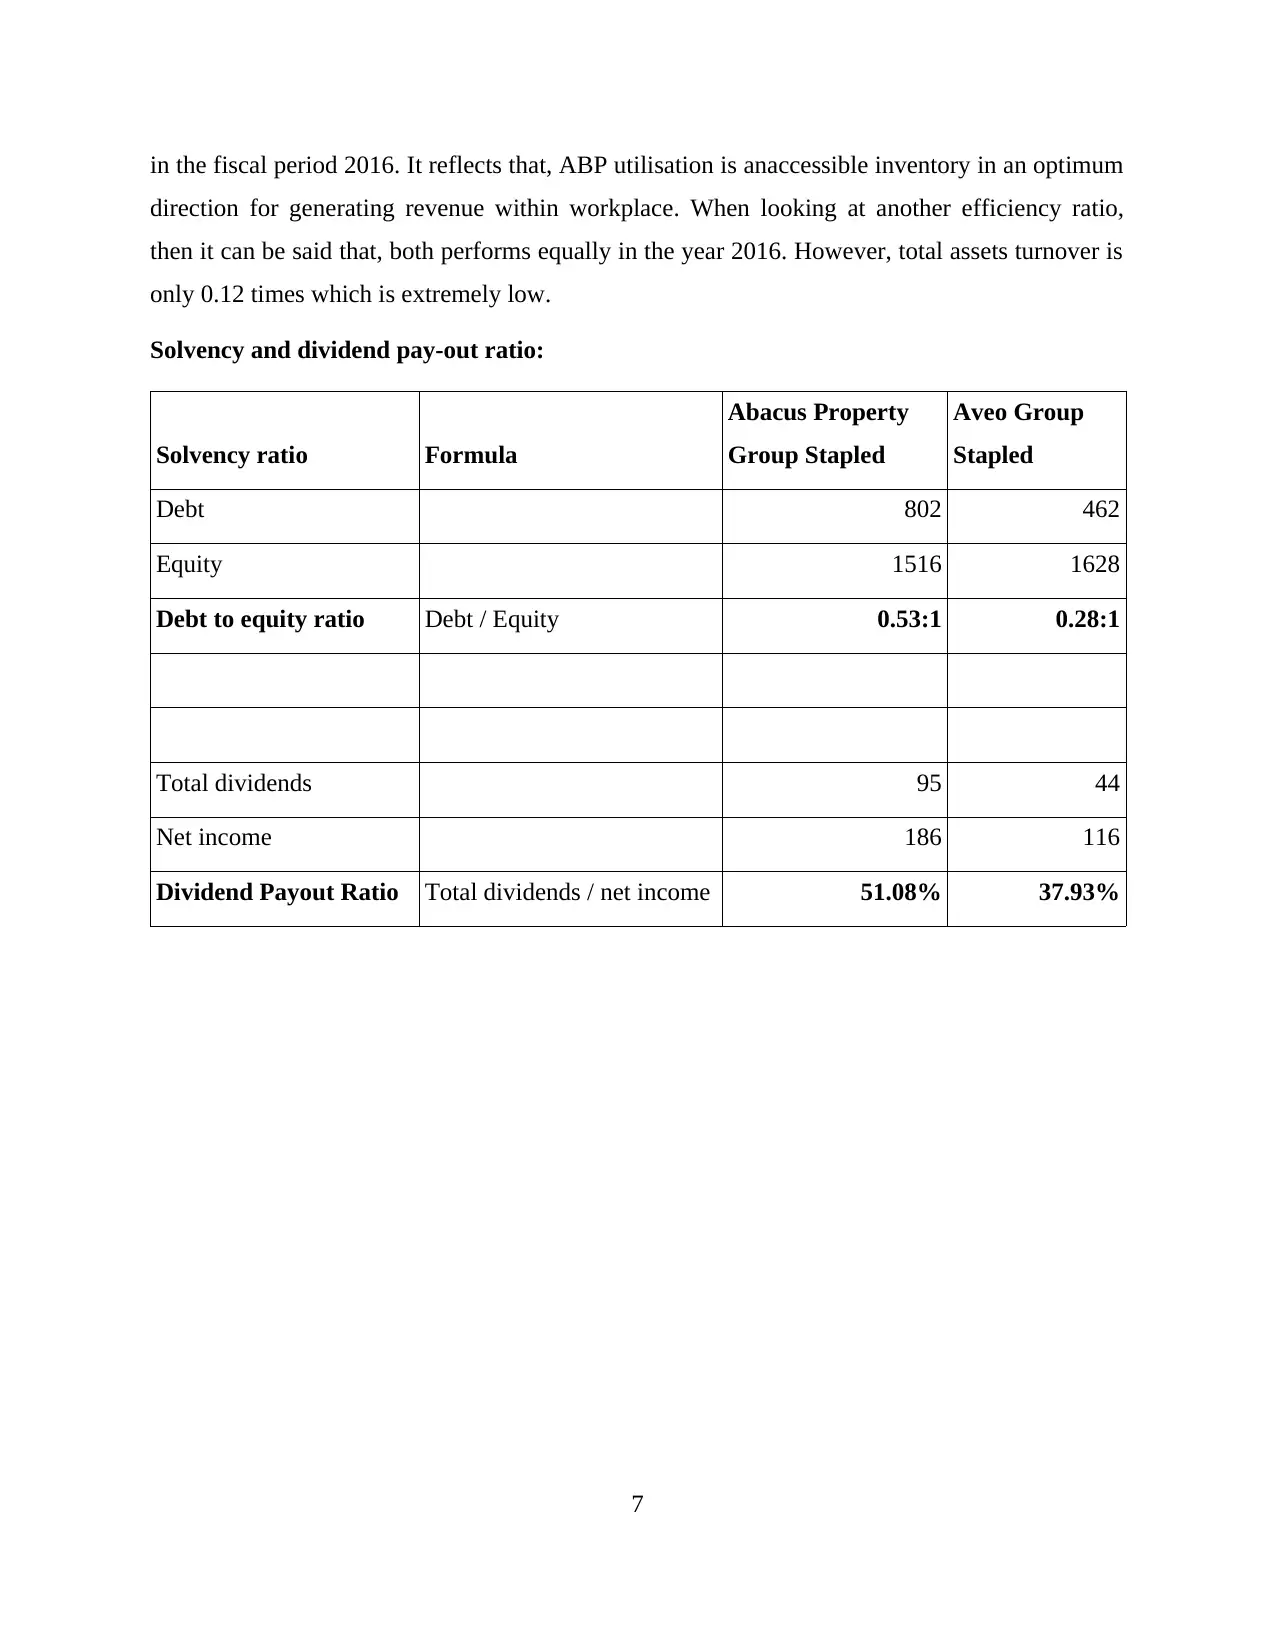
Solvency and dividend pay-out ratio:
Solvency ratio Formula
Abacus Property
Group Stapled
Aveo Group
Stapled
Debt 802 462
Equity 1516 1628
Debt to equity ratio Debt / Equity 0.53:1 0.28:1
Total dividends 95 44
Net income 186 116
Dividend Payout Ratio Total dividends / net income 51.08% 37.93%
7
direction for generating revenue within workplace. When looking at another efficiency ratio,
then it can be said that, both performs equally in the year 2016. However, total assets turnover is
only 0.12 times which is extremely low.
Solvency and dividend pay-out ratio:
Solvency ratio Formula
Abacus Property
Group Stapled
Aveo Group
Stapled
Debt 802 462
Equity 1516 1628
Debt to equity ratio Debt / Equity 0.53:1 0.28:1
Total dividends 95 44
Net income 186 116
Dividend Payout Ratio Total dividends / net income 51.08% 37.93%
7
Paraphrase This Document
Need a fresh take? Get an instant paraphrase of this document with our AI Paraphraser
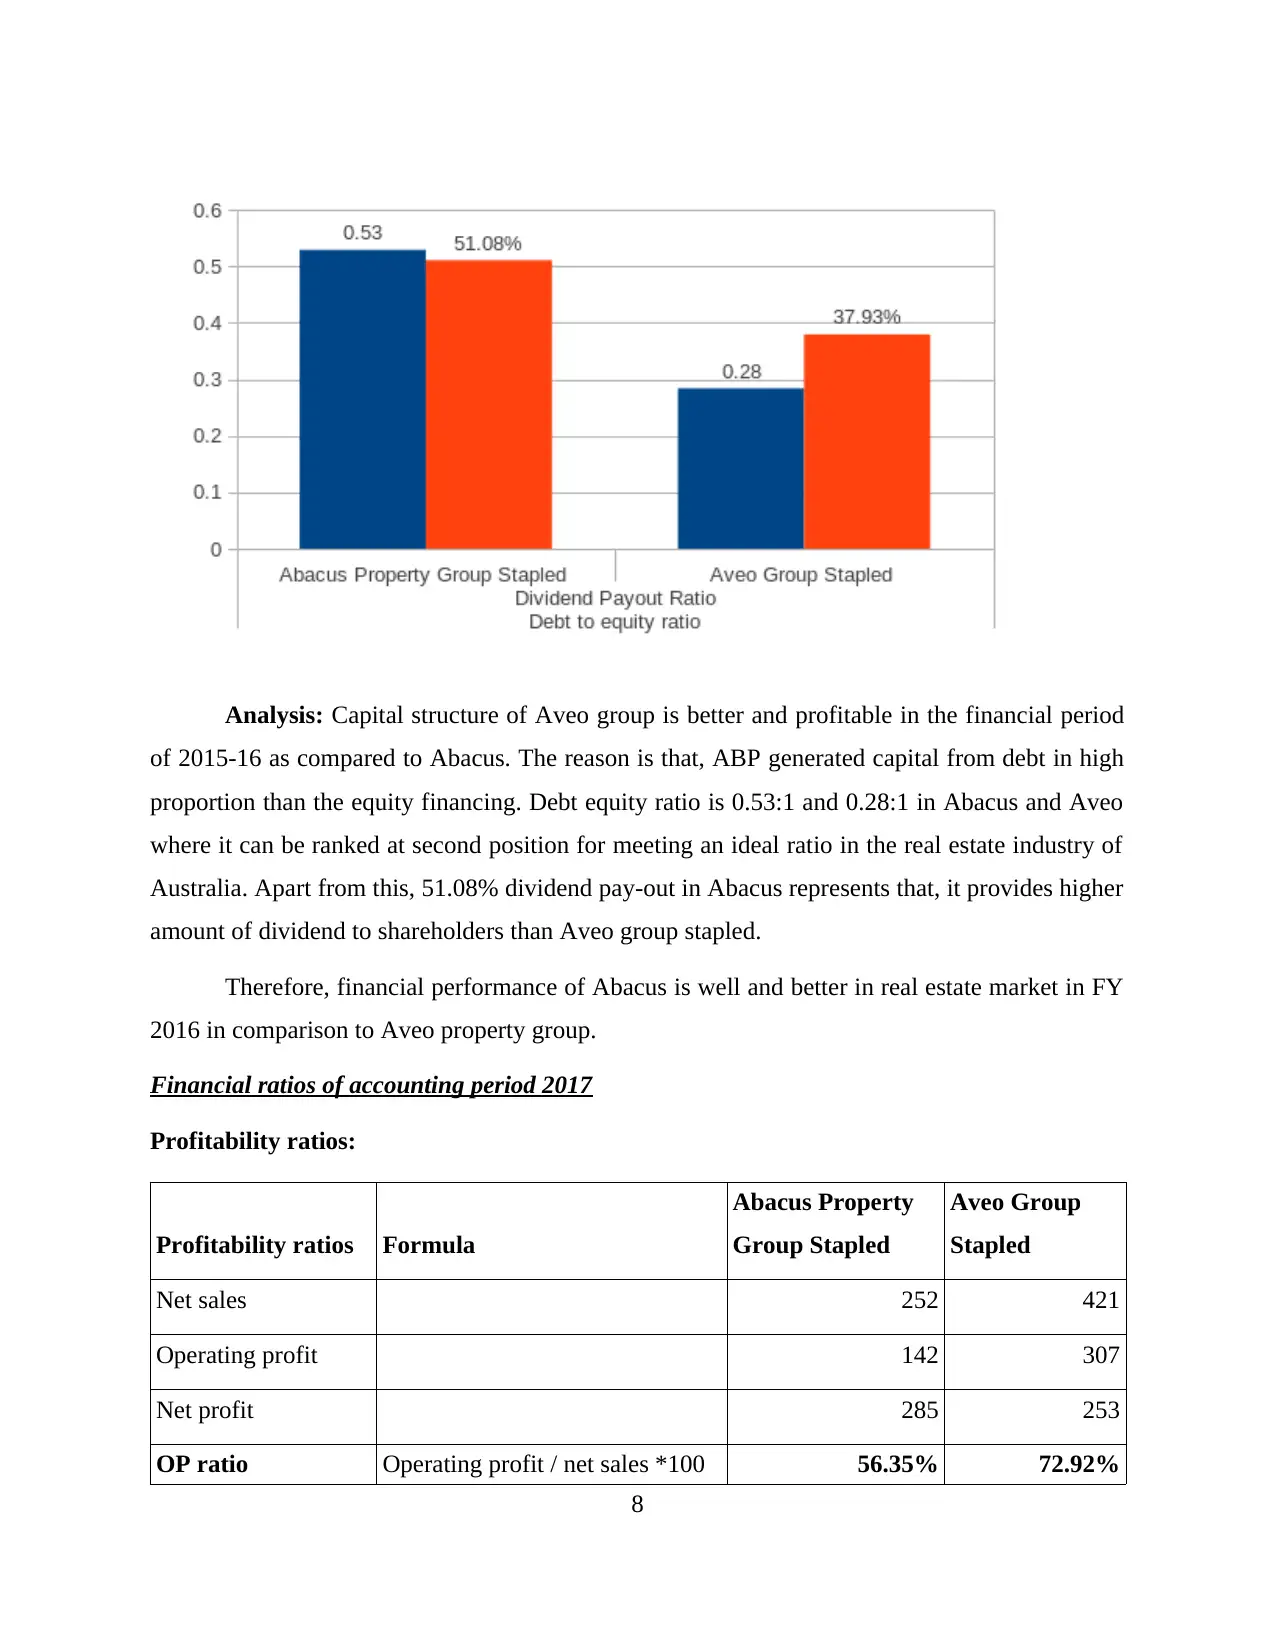
Analysis: Capital structure of Aveo group is better and profitable in the financial period
of 2015-16 as compared to Abacus. The reason is that, ABP generated capital from debt in high
proportion than the equity financing. Debt equity ratio is 0.53:1 and 0.28:1 in Abacus and Aveo
where it can be ranked at second position for meeting an ideal ratio in the real estate industry of
Australia. Apart from this, 51.08% dividend pay-out in Abacus represents that, it provides higher
amount of dividend to shareholders than Aveo group stapled.
Therefore, financial performance of Abacus is well and better in real estate market in FY
2016 in comparison to Aveo property group.
Financial ratios of accounting period 2017
Profitability ratios:
Profitability ratios Formula
Abacus Property
Group Stapled
Aveo Group
Stapled
Net sales 252 421
Operating profit 142 307
Net profit 285 253
OP ratio Operating profit / net sales *100 56.35% 72.92%
8
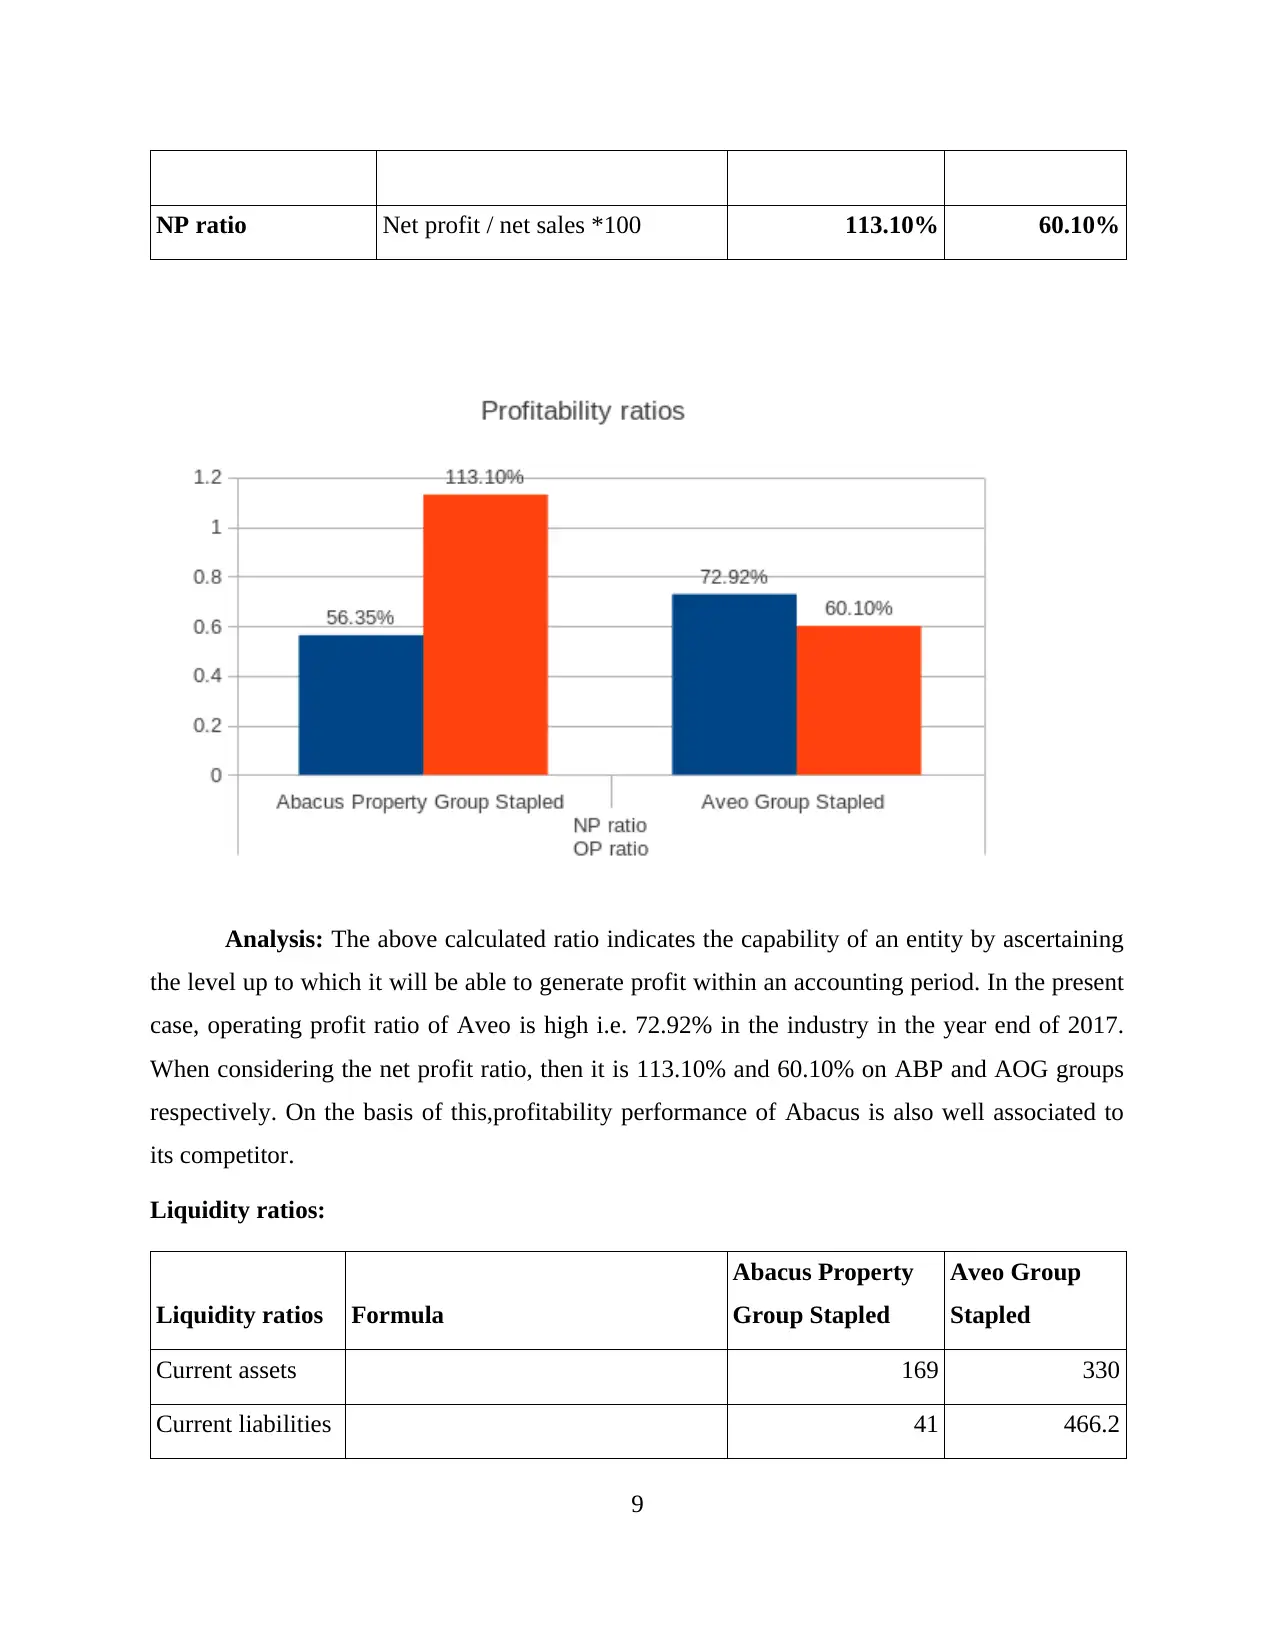
NP ratio Net profit / net sales *100 113.10% 60.10%
Analysis: The above calculated ratio indicates the capability of an entity by ascertaining
the level up to which it will be able to generate profit within an accounting period. In the present
case, operating profit ratio of Aveo is high i.e. 72.92% in the industry in the year end of 2017.
When considering the net profit ratio, then it is 113.10% and 60.10% on ABP and AOG groups
respectively. On the basis of this,profitability performance of Abacus is also well associated to
its competitor.
Liquidity ratios:
Liquidity ratios Formula
Abacus Property
Group Stapled
Aveo Group
Stapled
Current assets 169 330
Current liabilities 41 466.2
9
⊘ This is a preview!⊘
Do you want full access?
Subscribe today to unlock all pages.
Trusted by 1+ million students worldwide
1 out of 18
Related Documents


Your All-in-One AI-Powered Toolkit for Academic Success.
+13062052269
info@desklib.com
Available 24*7 on WhatsApp / Email
![[object Object]](/_next/static/media/star-bottom.7253800d.svg)
Unlock your academic potential
Copyright © 2020–2026 A2Z Services. All Rights Reserved. Developed and managed by ZUCOL.