Efficient Distributors Ltd: Financial Analysis and Ethical Case Study
VerifiedAdded on 2020/03/23
|19
|4190
|76
Report
AI Summary
This report provides a comprehensive financial analysis of Efficient Distributors Ltd, utilizing various financial ratios such as ROE, ROA, gross margin, net margin, current ratio, and inventory turnover to assess the company's performance. The analysis reveals fluctuations in the company's financial health, highlighting areas of concern such as declining net income and inefficiencies in inventory management. The report also includes an ethical case study on Allandale Ltd, examining the challenges faced by the company's accountant, Tom Lyons, in light of ethical dilemmas arising from tariff changes and valuation issues. The case study explores the stakeholders involved, the ethical problems encountered, and the possible courses of action, ultimately emphasizing the importance of adhering to ethical principles in financial reporting. The report concludes with recommendations for Efficient Distributors Ltd to improve its financial performance and stresses the limitations of financial calculations based solely on accounting principles.
1
Running head: ACCOUNTING FOR MANAGERS 1
Accounting for Managers
Student’s Name
Institution
Supervisor’s Name
Course
Running head: ACCOUNTING FOR MANAGERS 1
Accounting for Managers
Student’s Name
Institution
Supervisor’s Name
Course
Paraphrase This Document
Need a fresh take? Get an instant paraphrase of this document with our AI Paraphraser
2ACCOUNTING FOR MANAGERS
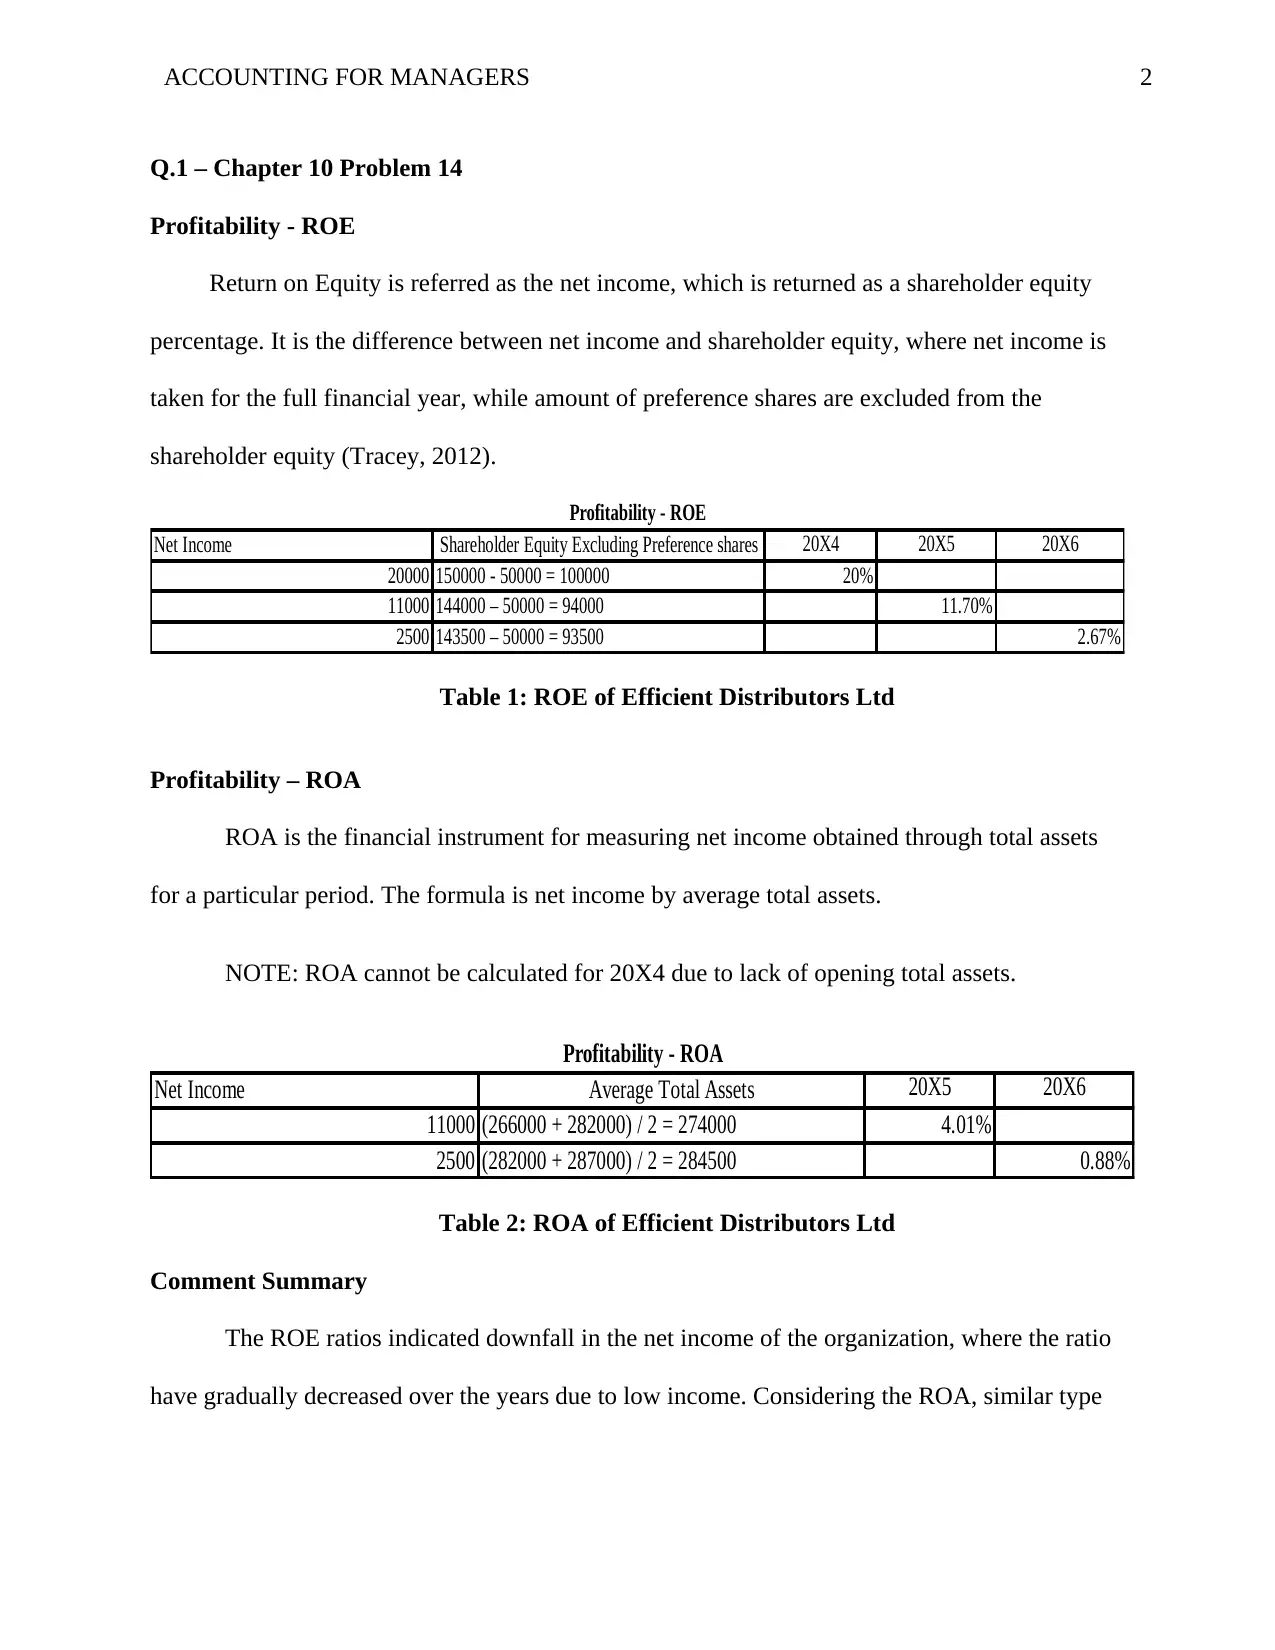
Q.1 – Chapter 10 Problem 14
Profitability - ROE
Return on Equity is referred as the net income, which is returned as a shareholder equity
percentage. It is the difference between net income and shareholder equity, where net income is
taken for the full financial year, while amount of preference shares are excluded from the
shareholder equity (Tracey, 2012).
Net Income Shareholder Equity Excluding Preference shares 20X4 20X5 20X6
20000 150000 - 50000 = 100000 20%
11000 144000 – 50000 = 94000 11.70%
2500 143500 – 50000 = 93500 2.67%
Profitability - ROE
Table 1: ROE of Efficient Distributors Ltd
Profitability – ROA
ROA is the financial instrument for measuring net income obtained through total assets
for a particular period. The formula is net income by average total assets.
NOTE: ROA cannot be calculated for 20X4 due to lack of opening total assets.
Net Income Average Total Assets 20X5 20X6
11000 (266000 + 282000) / 2 = 274000 4.01%
2500 (282000 + 287000) / 2 = 284500 0.88%
Profitability - ROA
Table 2: ROA of Efficient Distributors Ltd
Comment Summary
The ROE ratios indicated downfall in the net income of the organization, where the ratio
have gradually decreased over the years due to low income. Considering the ROA, similar type
3ACCOUNTING FOR MANAGERS
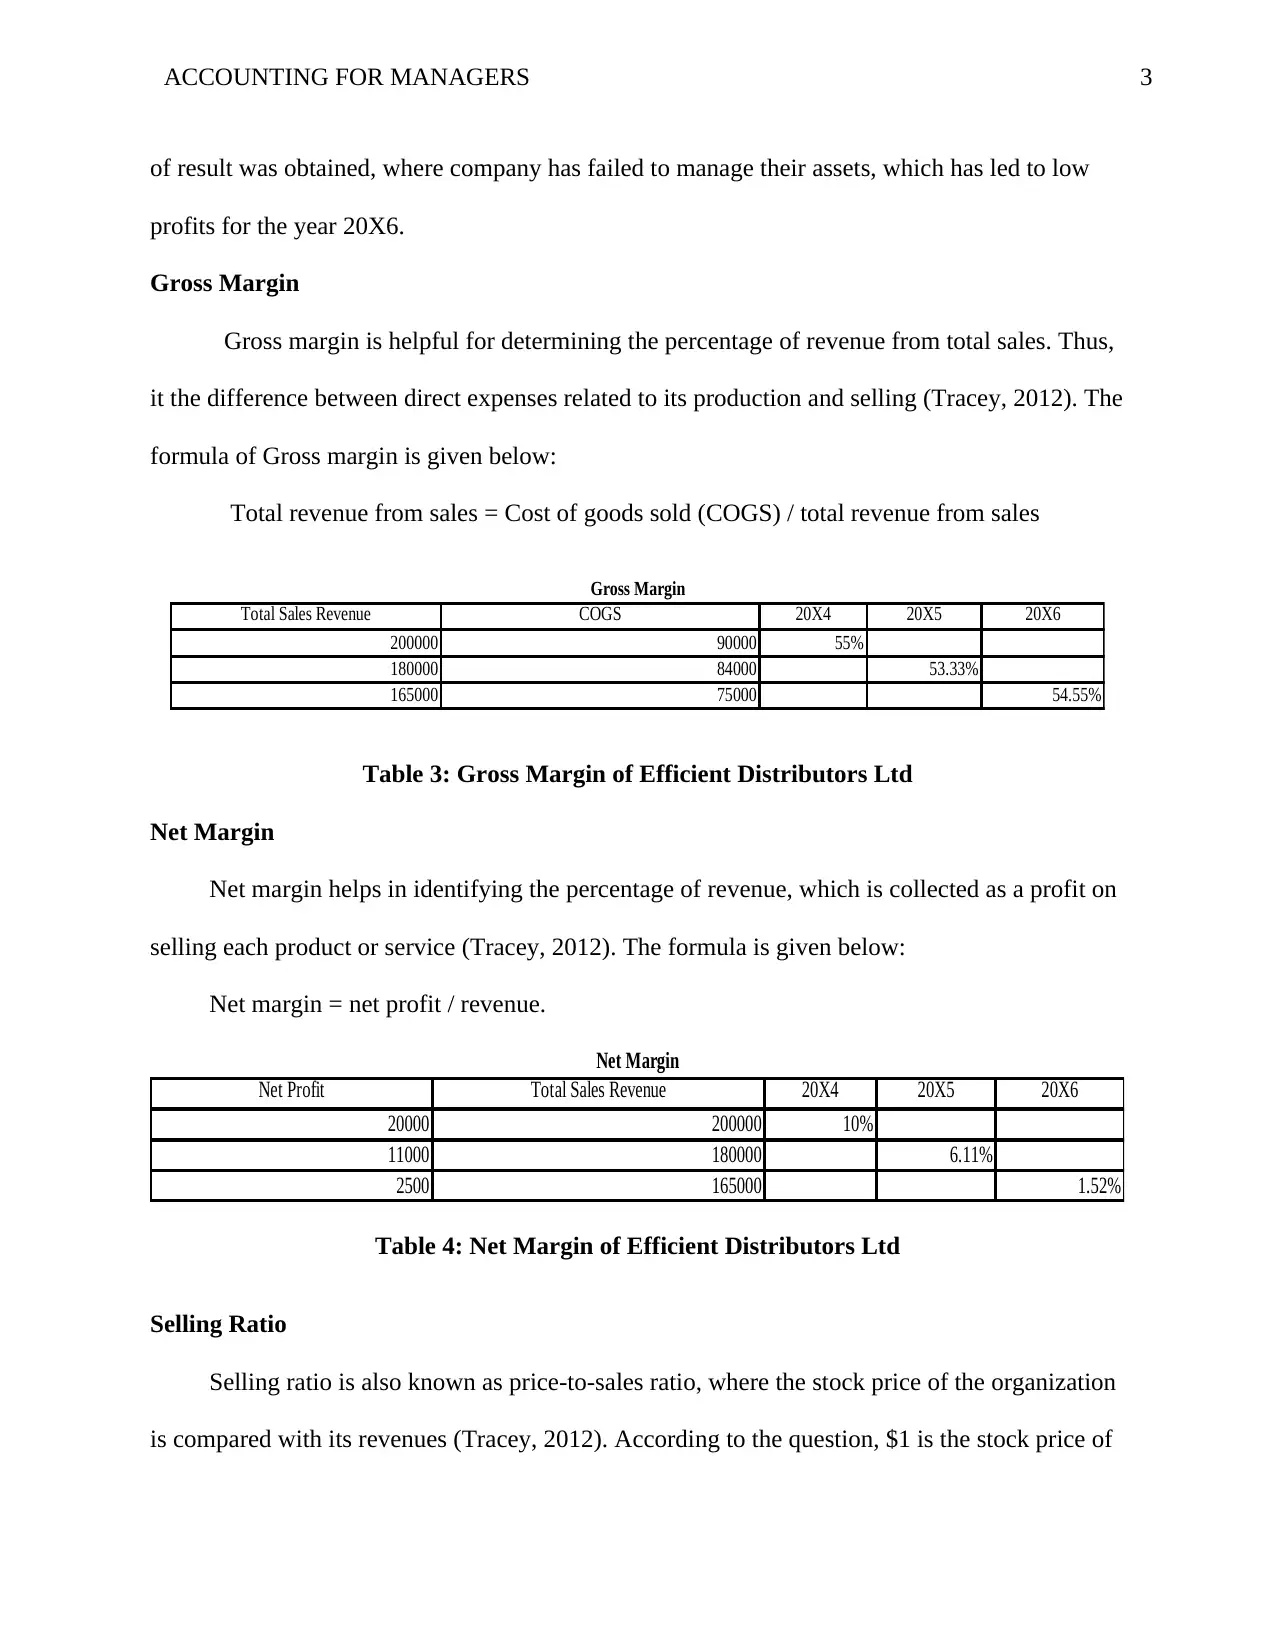
of result was obtained, where company has failed to manage their assets, which has led to low
profits for the year 20X6.
Gross Margin
Gross margin is helpful for determining the percentage of revenue from total sales. Thus,
it the difference between direct expenses related to its production and selling (Tracey, 2012). The
formula of Gross margin is given below:
Total revenue from sales = Cost of goods sold (COGS) / total revenue from sales
Total Sales Revenue COGS 20X4 20X5 20X6
200000 90000 55%
180000 84000 53.33%
165000 75000 54.55%
Gross Margin
Table 3: Gross Margin of Efficient Distributors Ltd
Net Margin
Net margin helps in identifying the percentage of revenue, which is collected as a profit on
selling each product or service (Tracey, 2012). The formula is given below:
Net margin = net profit / revenue.
Net Profit Total Sales Revenue 20X4 20X5 20X6
20000 200000 10%
11000 180000 6.11%
2500 165000 1.52%
Net Margin
Table 4: Net Margin of Efficient Distributors Ltd
Selling Ratio
Selling ratio is also known as price-to-sales ratio, where the stock price of the organization
is compared with its revenues (Tracey, 2012). According to the question, $1 is the stock price of
⊘ This is a preview!⊘
Do you want full access?
Subscribe today to unlock all pages.
Trusted by 1+ million students worldwide
4ACCOUNTING FOR MANAGERS
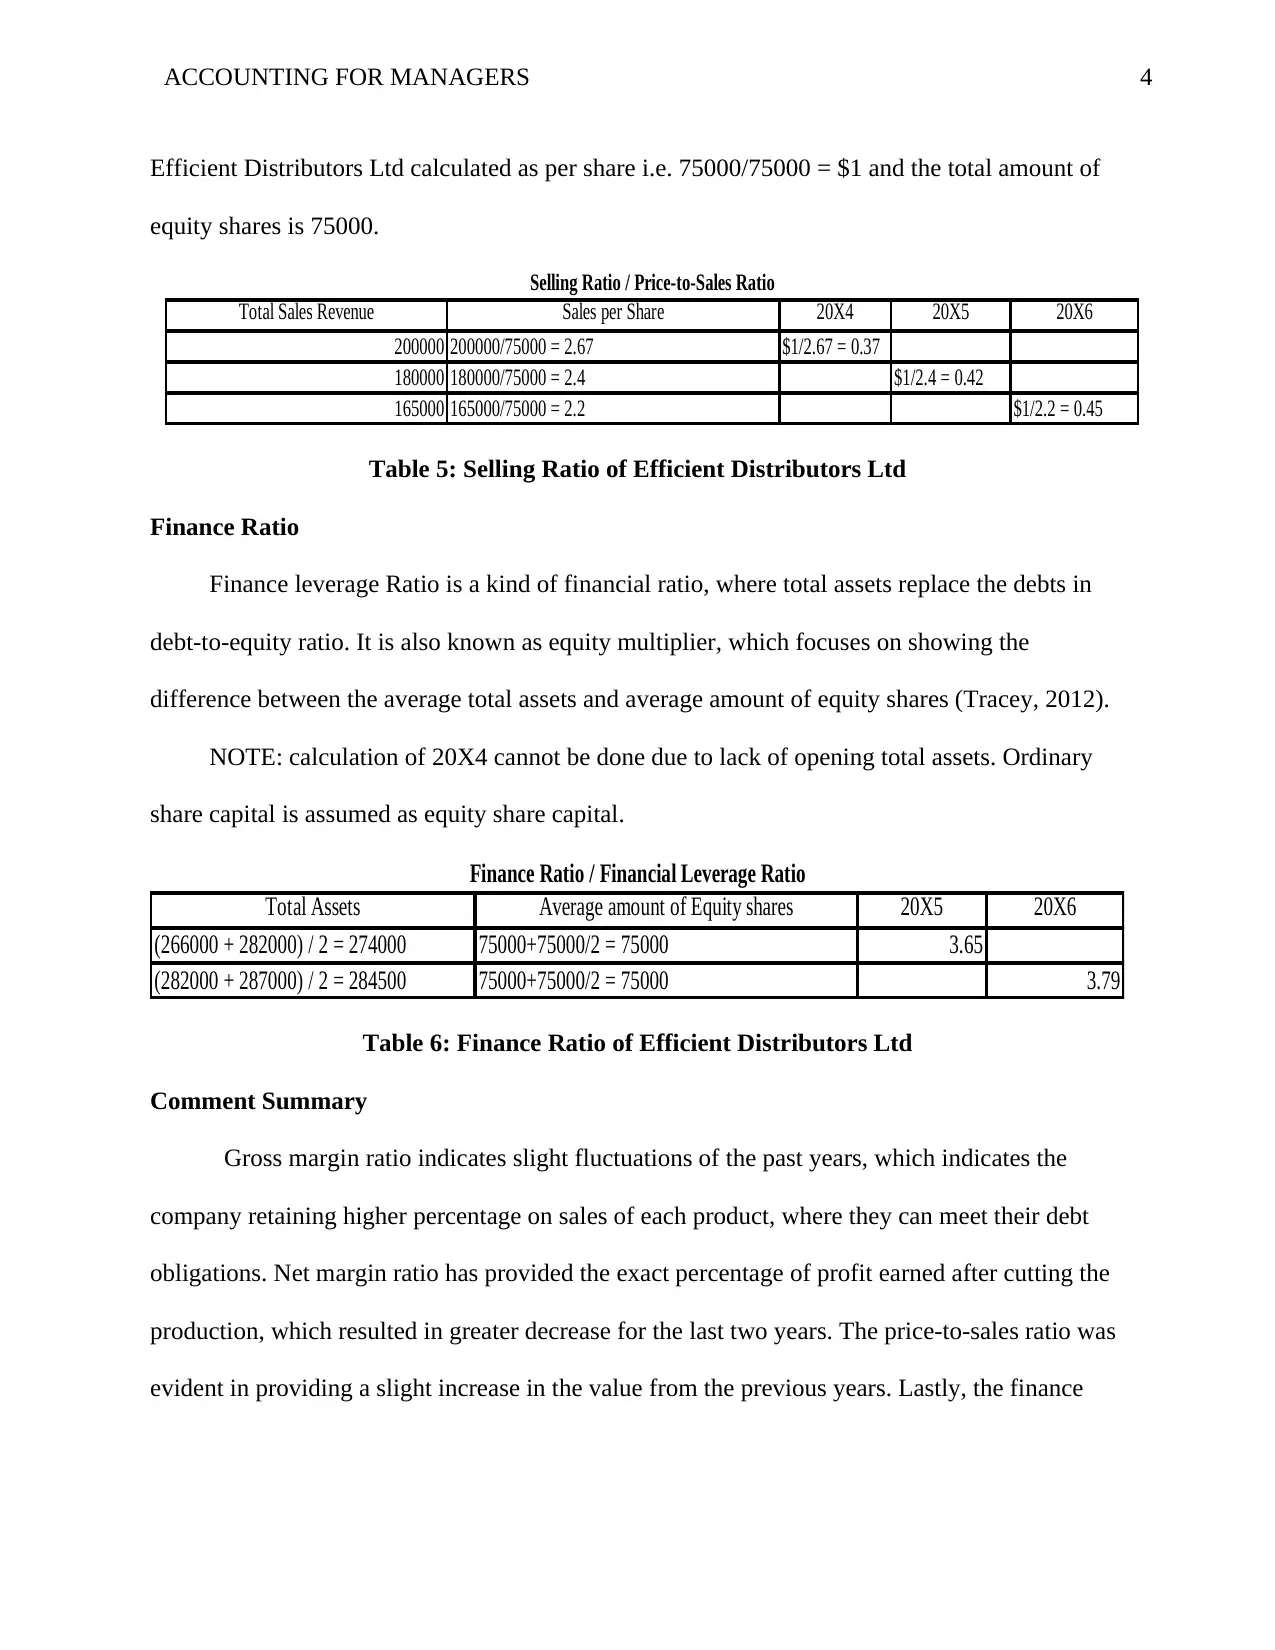
Efficient Distributors Ltd calculated as per share i.e. 75000/75000 = $1 and the total amount of
equity shares is 75000.
Total Sales Revenue Sales per Share 20X4 20X5 20X6
200000 200000/75000 = 2.67 $1/2.67 = 0.37
180000 180000/75000 = 2.4 $1/2.4 = 0.42
165000 165000/75000 = 2.2 $1/2.2 = 0.45
Selling Ratio / Price-to-Sales Ratio
Table 5: Selling Ratio of Efficient Distributors Ltd
Finance Ratio
Finance leverage Ratio is a kind of financial ratio, where total assets replace the debts in
debt-to-equity ratio. It is also known as equity multiplier, which focuses on showing the
difference between the average total assets and average amount of equity shares (Tracey, 2012).
NOTE: calculation of 20X4 cannot be done due to lack of opening total assets. Ordinary
share capital is assumed as equity share capital.
Total Assets Average amount of Equity shares 20X5 20X6
(266000 + 282000) / 2 = 274000 75000+75000/2 = 75000 3.65
(282000 + 287000) / 2 = 284500 75000+75000/2 = 75000 3.79
Finance Ratio / Financial Leverage Ratio
Table 6: Finance Ratio of Efficient Distributors Ltd
Comment Summary
Gross margin ratio indicates slight fluctuations of the past years, which indicates the
company retaining higher percentage on sales of each product, where they can meet their debt
obligations. Net margin ratio has provided the exact percentage of profit earned after cutting the
production, which resulted in greater decrease for the last two years. The price-to-sales ratio was
evident in providing a slight increase in the value from the previous years. Lastly, the finance
Paraphrase This Document
Need a fresh take? Get an instant paraphrase of this document with our AI Paraphraser
5ACCOUNTING FOR MANAGERS
leverage ratio pointed that debt owns a part of company’s assets and then equity holds
approximately 3.79 parts, which has gradually increased from 3.65.
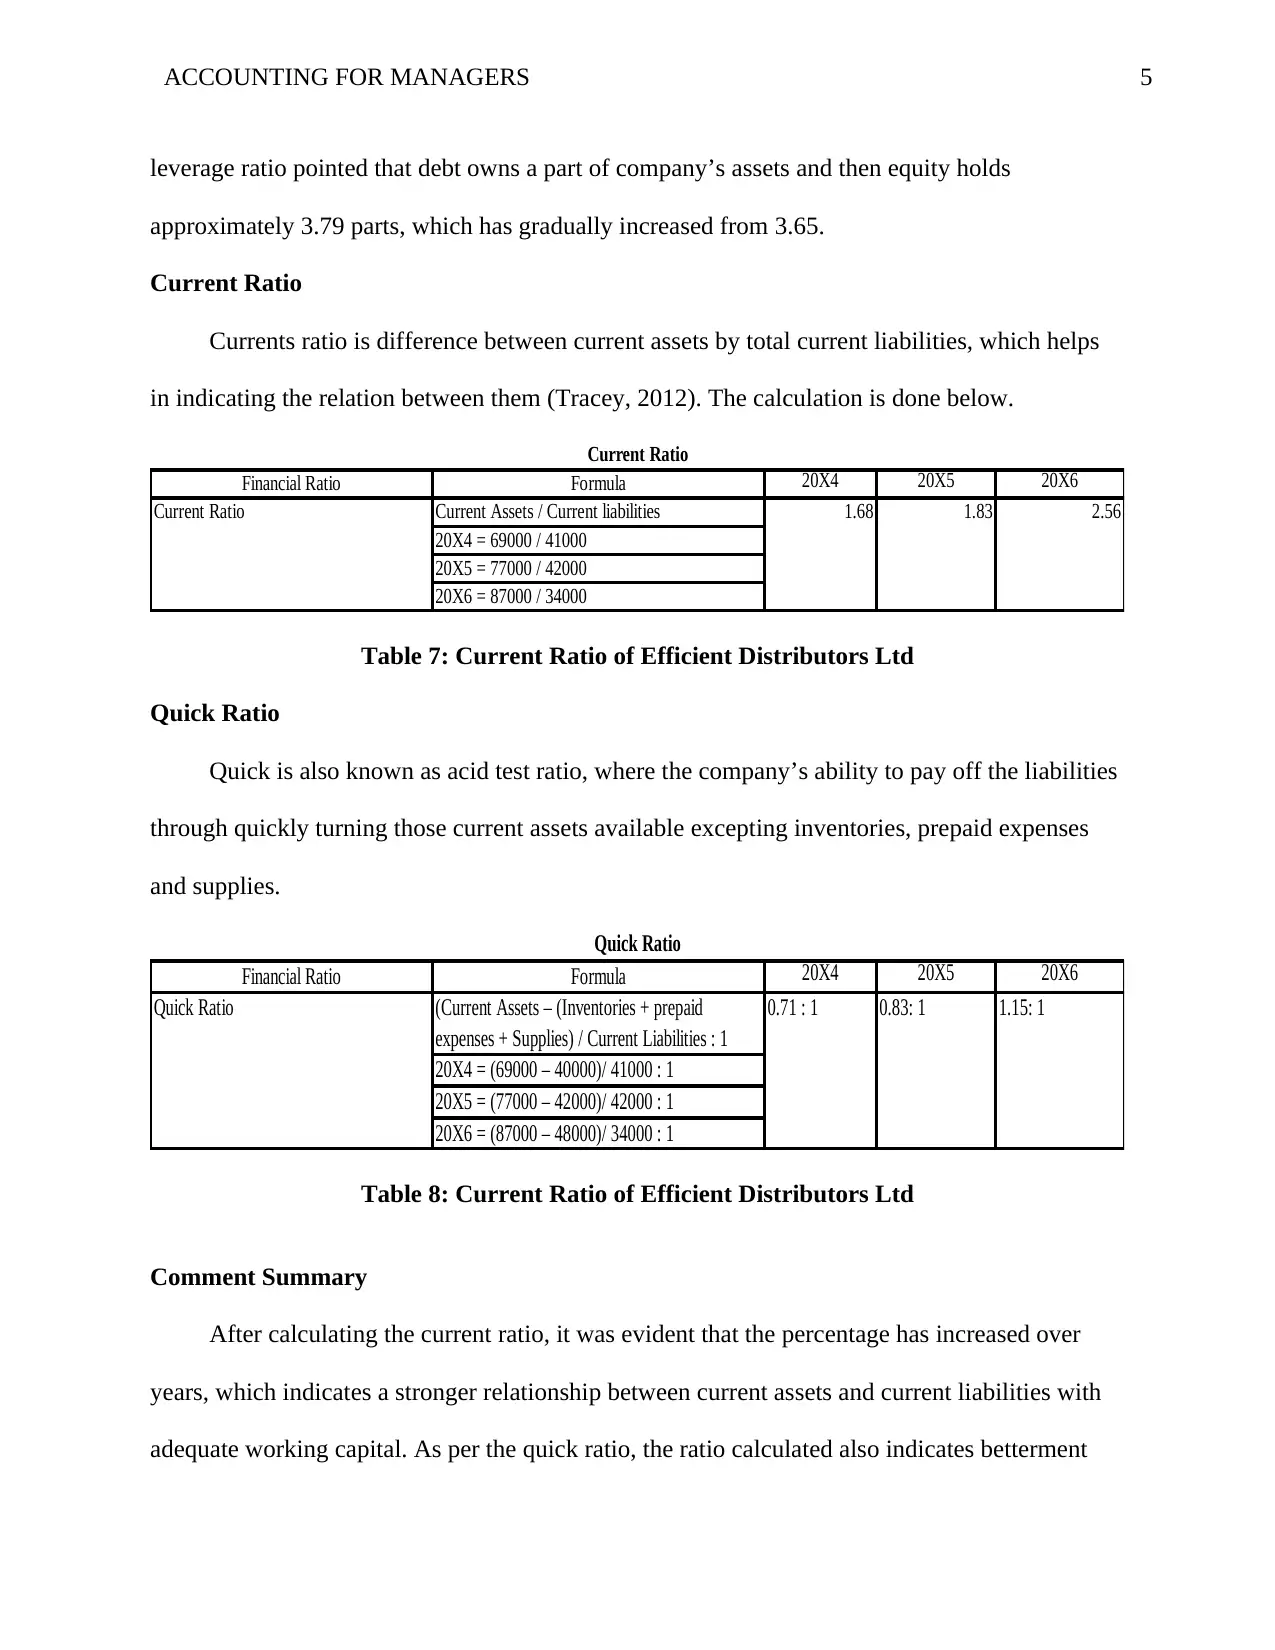
Current Ratio
Currents ratio is difference between current assets by total current liabilities, which helps
in indicating the relation between them (Tracey, 2012). The calculation is done below.
Financial Ratio Formula 20X4 20X5 20X6
Current Assets / Current liabilities
20X4 = 69000 / 41000
20X5 = 77000 / 42000
20X6 = 87000 / 34000
Current Ratio
Current Ratio 1.68 1.83 2.56
Table 7: Current Ratio of Efficient Distributors Ltd
Quick Ratio
Quick is also known as acid test ratio, where the company’s ability to pay off the liabilities
through quickly turning those current assets available excepting inventories, prepaid expenses
and supplies.
Financial Ratio Formula 20X4 20X5 20X6
(Current Assets – (Inventories + prepaid
expenses + Supplies) / Current Liabilities : 1
20X4 = (69000 – 40000)/ 41000 : 1
20X5 = (77000 – 42000)/ 42000 : 1
20X6 = (87000 – 48000)/ 34000 : 1
Quick Ratio
Quick Ratio 0.71 : 1 0.83: 1 1.15: 1
Table 8: Current Ratio of Efficient Distributors Ltd
Comment Summary
After calculating the current ratio, it was evident that the percentage has increased over
years, which indicates a stronger relationship between current assets and current liabilities with
adequate working capital. As per the quick ratio, the ratio calculated also indicates betterment
leverage ratio pointed that debt owns a part of company’s assets and then equity holds
approximately 3.79 parts, which has gradually increased from 3.65.
Current Ratio
Currents ratio is difference between current assets by total current liabilities, which helps
in indicating the relation between them (Tracey, 2012). The calculation is done below.
Financial Ratio Formula 20X4 20X5 20X6
Current Assets / Current liabilities
20X4 = 69000 / 41000
20X5 = 77000 / 42000
20X6 = 87000 / 34000
Current Ratio
Current Ratio 1.68 1.83 2.56
Table 7: Current Ratio of Efficient Distributors Ltd
Quick Ratio
Quick is also known as acid test ratio, where the company’s ability to pay off the liabilities
through quickly turning those current assets available excepting inventories, prepaid expenses
and supplies.
Financial Ratio Formula 20X4 20X5 20X6
(Current Assets – (Inventories + prepaid
expenses + Supplies) / Current Liabilities : 1
20X4 = (69000 – 40000)/ 41000 : 1
20X5 = (77000 – 42000)/ 42000 : 1
20X6 = (87000 – 48000)/ 34000 : 1
Quick Ratio
Quick Ratio 0.71 : 1 0.83: 1 1.15: 1
Table 8: Current Ratio of Efficient Distributors Ltd
Comment Summary
After calculating the current ratio, it was evident that the percentage has increased over
years, which indicates a stronger relationship between current assets and current liabilities with
adequate working capital. As per the quick ratio, the ratio calculated also indicates betterment
6ACCOUNTING FOR MANAGERS
over the years, where the company can quickly turn the assets into cash for paying out the
current liabilities. In the current year 20X6, company could have easily payout the liabilities,
keeping the balance amount in hand as the ratio has exceeded the value of 1:1, i.e. 1.15: 1.
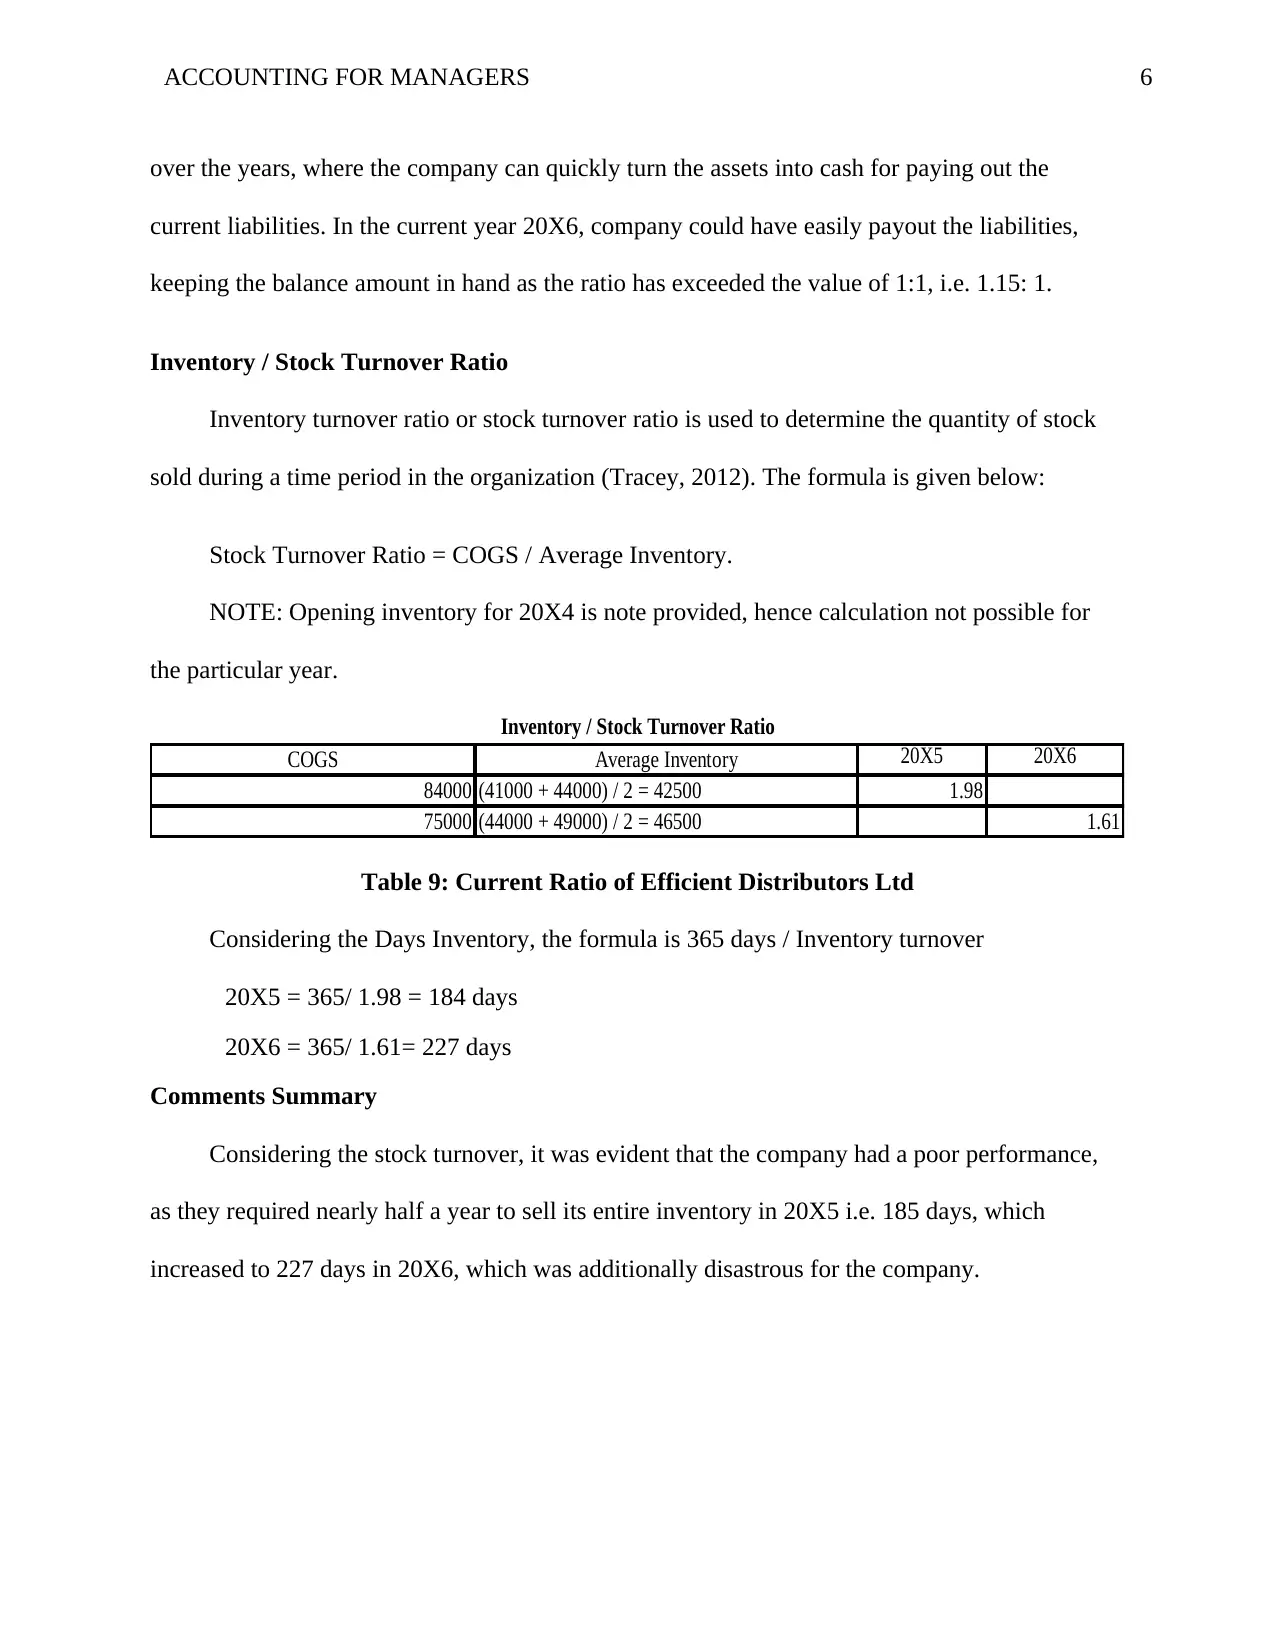
Inventory / Stock Turnover Ratio
Inventory turnover ratio or stock turnover ratio is used to determine the quantity of stock
sold during a time period in the organization (Tracey, 2012). The formula is given below:
Stock Turnover Ratio = COGS / Average Inventory.
NOTE: Opening inventory for 20X4 is note provided, hence calculation not possible for
the particular year.
COGS Average Inventory 20X5 20X6
84000 (41000 + 44000) / 2 = 42500 1.98
75000 (44000 + 49000) / 2 = 46500 1.61
Inventory / Stock Turnover Ratio
Table 9: Current Ratio of Efficient Distributors Ltd
Considering the Days Inventory, the formula is 365 days / Inventory turnover
20X5 = 365/ 1.98 = 184 days
20X6 = 365/ 1.61= 227 days
Comments Summary
Considering the stock turnover, it was evident that the company had a poor performance,
as they required nearly half a year to sell its entire inventory in 20X5 i.e. 185 days, which
increased to 227 days in 20X6, which was additionally disastrous for the company.
over the years, where the company can quickly turn the assets into cash for paying out the
current liabilities. In the current year 20X6, company could have easily payout the liabilities,
keeping the balance amount in hand as the ratio has exceeded the value of 1:1, i.e. 1.15: 1.
Inventory / Stock Turnover Ratio
Inventory turnover ratio or stock turnover ratio is used to determine the quantity of stock
sold during a time period in the organization (Tracey, 2012). The formula is given below:
Stock Turnover Ratio = COGS / Average Inventory.
NOTE: Opening inventory for 20X4 is note provided, hence calculation not possible for
the particular year.
COGS Average Inventory 20X5 20X6
84000 (41000 + 44000) / 2 = 42500 1.98
75000 (44000 + 49000) / 2 = 46500 1.61
Inventory / Stock Turnover Ratio
Table 9: Current Ratio of Efficient Distributors Ltd
Considering the Days Inventory, the formula is 365 days / Inventory turnover
20X5 = 365/ 1.98 = 184 days
20X6 = 365/ 1.61= 227 days
Comments Summary
Considering the stock turnover, it was evident that the company had a poor performance,
as they required nearly half a year to sell its entire inventory in 20X5 i.e. 185 days, which
increased to 227 days in 20X6, which was additionally disastrous for the company.
⊘ This is a preview!⊘
Do you want full access?
Subscribe today to unlock all pages.
Trusted by 1+ million students worldwide
7ACCOUNTING FOR MANAGERS
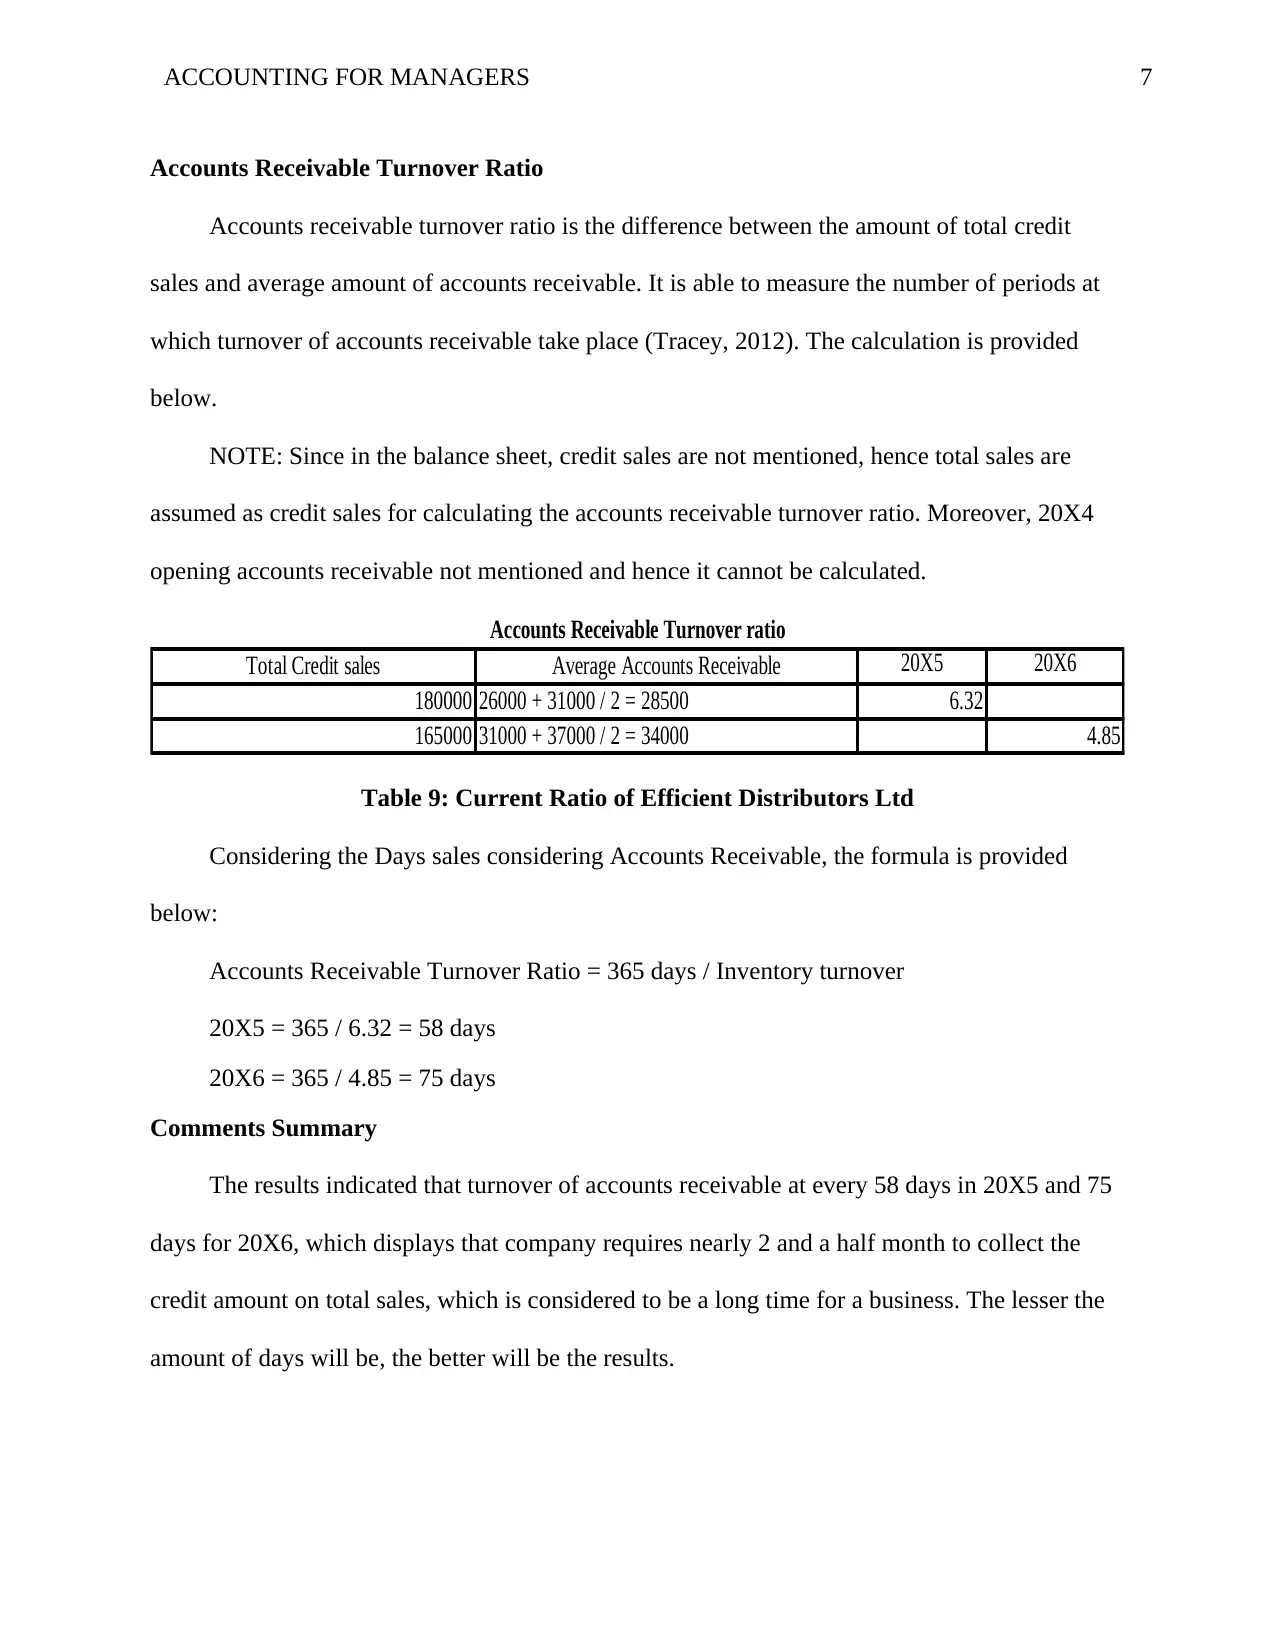
Accounts Receivable Turnover Ratio
Accounts receivable turnover ratio is the difference between the amount of total credit
sales and average amount of accounts receivable. It is able to measure the number of periods at
which turnover of accounts receivable take place (Tracey, 2012). The calculation is provided
below.
NOTE: Since in the balance sheet, credit sales are not mentioned, hence total sales are
assumed as credit sales for calculating the accounts receivable turnover ratio. Moreover, 20X4
opening accounts receivable not mentioned and hence it cannot be calculated.
Total Credit sales Average Accounts Receivable 20X5 20X6
180000 26000 + 31000 / 2 = 28500 6.32
165000 31000 + 37000 / 2 = 34000 4.85
Accounts Receivable Turnover ratio
Table 9: Current Ratio of Efficient Distributors Ltd
Considering the Days sales considering Accounts Receivable, the formula is provided
below:
Accounts Receivable Turnover Ratio = 365 days / Inventory turnover
20X5 = 365 / 6.32 = 58 days
20X6 = 365 / 4.85 = 75 days
Comments Summary
The results indicated that turnover of accounts receivable at every 58 days in 20X5 and 75
days for 20X6, which displays that company requires nearly 2 and a half month to collect the
credit amount on total sales, which is considered to be a long time for a business. The lesser the
amount of days will be, the better will be the results.
Paraphrase This Document
Need a fresh take? Get an instant paraphrase of this document with our AI Paraphraser
8ACCOUNTING FOR MANAGERS
Recommendations
After analyzing the entire financial statement through numerous calculations including
financial ratios, it was evident that the net revenue of Efficient Distributors Ltd in 20X6 was less
as compared to the previous years, which resulted in downfall in the financial ratios calculated
on net revenues. Gross profit of the company in the current year was comparatively beneficial in
comparison with previous years. The key flaw identified in the trading and P&L statement was
additional cost of indirect expenses including selling as well as distribution expenses along with
administration expenses. This led to low generation of the net income at the end of the year.
Hence, the company might look forward to lower its indirect expenses in the future, which will
lead to better income in upcoming years. Additionally, the amount of sales was quite less
comparatively to the previous years, 20X4 and 20X5, which is also an area of concern for the
company. Efficient Distributors Ltd should put additional efforts in selling, which will lead to
extra income in the future, for which they need to strategize their productions, operations,
marketing, selling along with optimum usage of finance.
Limitations
The financial calculations considering the balance sheets have few limitations, as it follows
the accounting principles excluding the physical processes of the organization. The data
calculated through determining the accounting ratios are correct as per the financial segments.
This is due to the fact that the failure of the company may be due to physical processes of poor
raw material handling, inefficient team effort, inadequate marketing as well as advertising
processes and ineffective selling procedures. Hence, the result obtained through accounting
ratios may not be accurate based on the above mentioned physical factors (Tracey, 2012).
9ACCOUNTING FOR MANAGERS
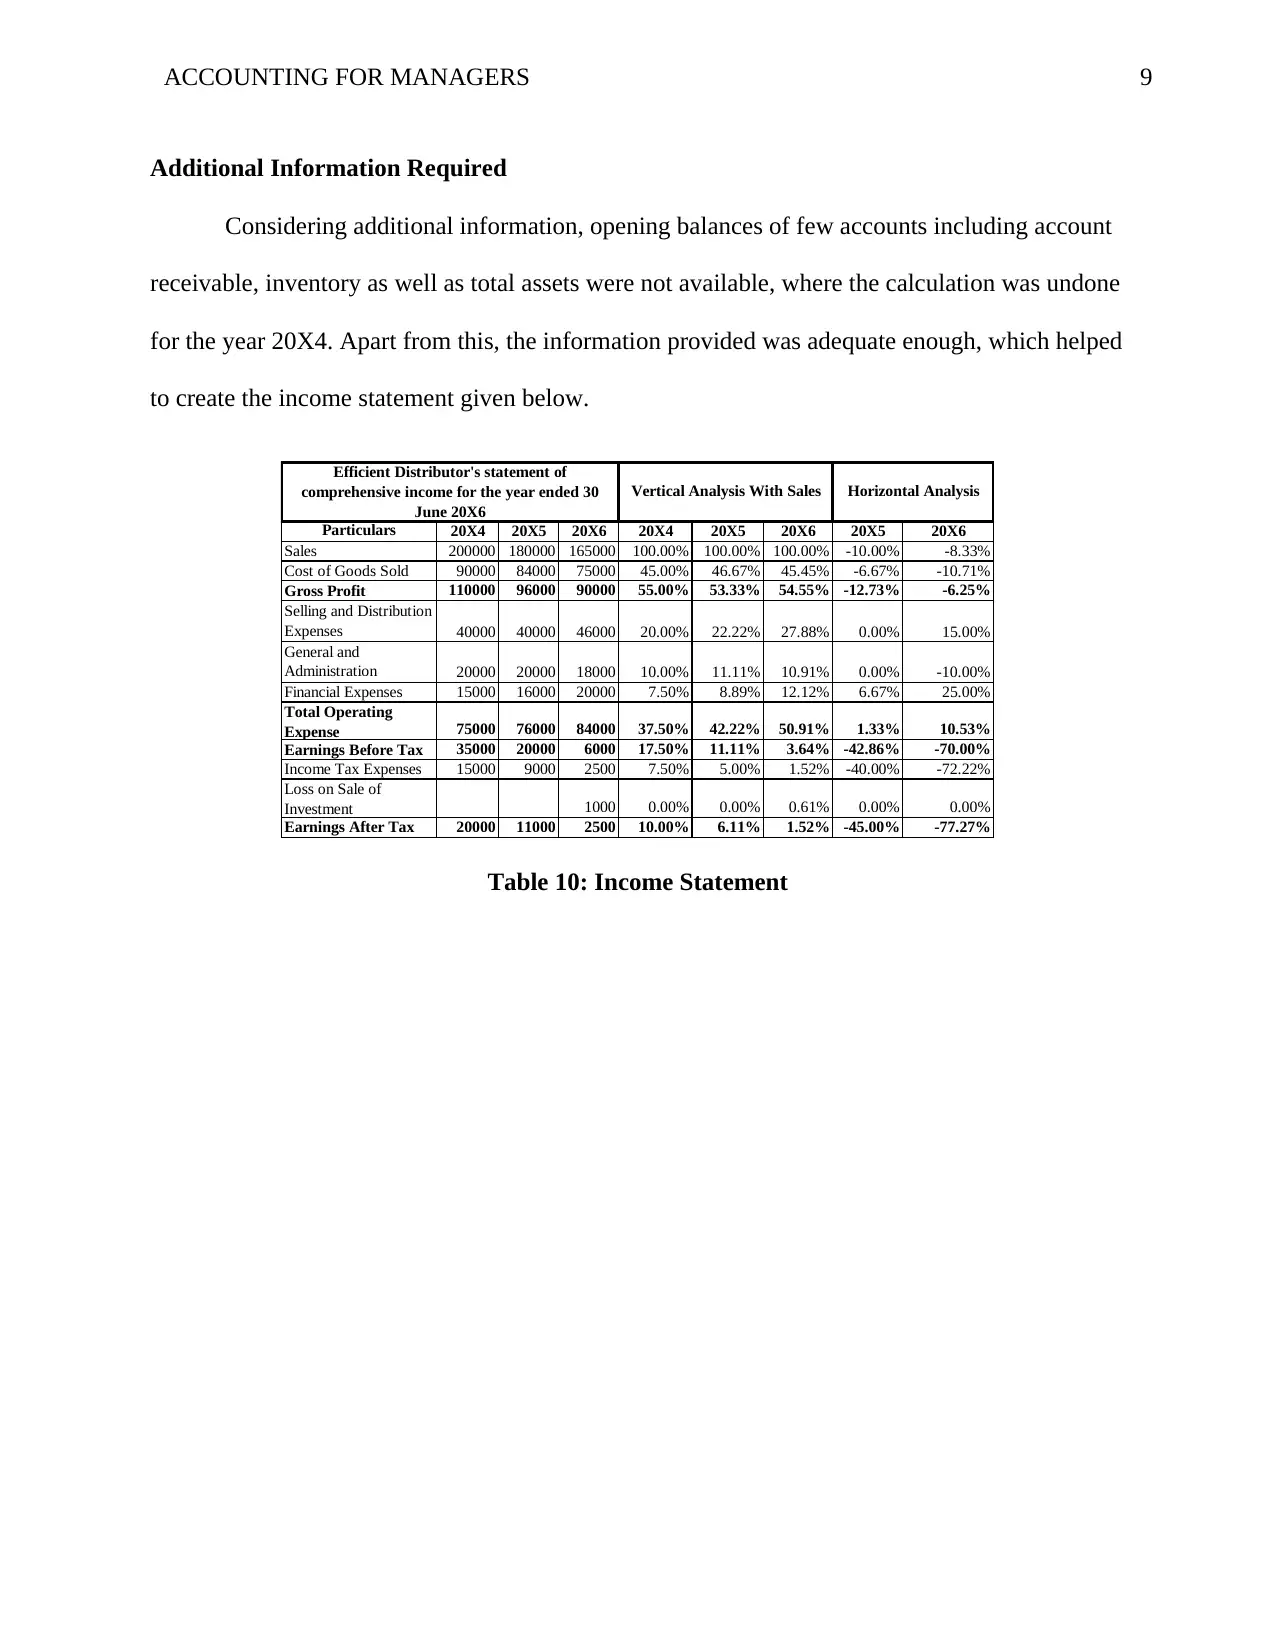
Additional Information Required
Considering additional information, opening balances of few accounts including account
receivable, inventory as well as total assets were not available, where the calculation was undone
for the year 20X4. Apart from this, the information provided was adequate enough, which helped
to create the income statement given below.
Particulars 20X4 20X5 20X6 20X4 20X5 20X6 20X5 20X6
Sales 200000 180000 165000 100.00% 100.00% 100.00% -10.00% -8.33%
Cost of Goods Sold 90000 84000 75000 45.00% 46.67% 45.45% -6.67% -10.71%
Gross Profit 110000 96000 90000 55.00% 53.33% 54.55% -12.73% -6.25%
Selling and Distribution
Expenses 40000 40000 46000 20.00% 22.22% 27.88% 0.00% 15.00%
General and
Administration
Expenses
20000 20000 18000 10.00% 11.11% 10.91% 0.00% -10.00%
Financial Expenses 15000 16000 20000 7.50% 8.89% 12.12% 6.67% 25.00%
Total Operating
Expense 75000 76000 84000 37.50% 42.22% 50.91% 1.33% 10.53%
Earnings Before Tax 35000 20000 6000 17.50% 11.11% 3.64% -42.86% -70.00%
Income Tax Expenses 15000 9000 2500 7.50% 5.00% 1.52% -40.00% -72.22%
Loss on Sale of
Investment 1000 0.00% 0.00% 0.61% 0.00% 0.00%
Earnings After Tax 20000 11000 2500 10.00% 6.11% 1.52% -45.00% -77.27%
Efficient Distributor's statement of
comprehensive income for the year ended 30
June 20X6
Vertical Analysis With Sales Horizontal Analysis
Table 10: Income Statement
⊘ This is a preview!⊘
Do you want full access?
Subscribe today to unlock all pages.
Trusted by 1+ million students worldwide
10ACCOUNTING FOR MANAGERS
Question 2: Chapter 10 Ethics Case Study
Facts
The given case study was based on a company named ‘Allandale Ltd’, which manufactures
small luxury boats and it had been about 10 years since it had started its operations. The
company was expanding its business, but in the recent years, it faced difficulties, when the tariffs
on small boats were removed. As per the current financial results that were observed by its
accountant, Tom Lyons highlighted that current ratio of the company was 2.1:1 and the return on
its assets was11%.
Stakeholders
The stakeholders of Allandale Ltd as per the provided details, was prominent to be its
customers, 500 employees and the bank from which the company had taken the mortgage loan
being the debtor. Other key stakeholder of the company was its competitors in local market as
well as overseas along with its suppliers.
Problems
The ethical problems that Tom was facing was the removal of 10% tariffs on the small
luxury boats, which was perceived to be a great concern for the company, as it was facing
difficulties in performing with the competitors in the overseas markets. In response to this
problem, the company had to reduce its profit margin. Another problem was that one of the boats
unsold was overvalued in the balance sheet. In addition, the customers were also unable to pay
half of its debt.
Values and Principles
The values and principles that was related in this particular case was that Tom, being the
accountant of the company should display its true facts and figures showcasing the fundamental
Paraphrase This Document
Need a fresh take? Get an instant paraphrase of this document with our AI Paraphraser
11ACCOUNTING FOR MANAGERS
principles of the ethical code of the business. Failure to do so can be regarded as a misstatement
or misrepresentation of disclosures. As per the Australian standards of accounting, there are
certain values and principles that the professional accountants must follow under APES 110
Code of Ethics and has three parts. Part A included the fundamental principles, which are to be
followed as per the professional ethics such as identifying treats against fundamental principles
along with its importance and taking safety measures complying with the conceptual framework.
Part B and C consisted of the details of applying the conceptual framework at various situations.
Furthermore, the fundamental principles included integrity, objectivity, professional competence
& behavior and confidentiality (APESB, 2010).
Possible Courses of Action
The possible course of action according to the case would be, in one hand Tom can identify
the misstatements complying with the code of conduct, which depicts that the accountant must
adhere or overlook the issues. Non-compliance of the rules and regulations will be considered
unethical.
Evaluation of Each of the Courses of Action
As per the ethical course of action, if Tom recognizes the decrease in the net realizable
amount and the excess of the provision for the uncollectable account, it can lead the company to
face the problem of bankruptcy. Furthermore, it would be liable for the company to repay its
mortgage loan of $20 million to the bank and identify its realizable value of $150,000 and excess
provision of uncollected account of $200,000. Another course of action would be to select the
unethical way that focuses on not revealing the true facts and figures for which the company
would face the consequences sooner or later. It will be acting as a misstatement of data and
12ACCOUNTING FOR MANAGERS
information and the accountant or the company would be charged for misrepresentation, thereby
depicting unethical activity.
Selected Plan of Action
The appropriate plan of action must be the ethical consideration, which focuses on
performing the activities to safeguard the unethical behavior, as per the accounting profession. In
such further cases, it would be the duty of the accountant to report the breaches that has been
observed as per the ethical requirements (APESB, 2010).
Question 3: Chapter 12 Problem 10
3. a. Accounting and Reporting Information System
As per the provided case study, Giggling Brothers were the wholesalers of fine wines,
whose operations were observed to be profitable. They were performing accounting system
manually for a long time. However, the company was facing cash flow problems frequently. The
primary reason for such issues was reported to be improper feedback from the accounting
department, which was often viewed as a guidance to take crucial decisions. Therefore, to
address these problems, it can be suggested that computerized system of accounting and
reporting should be implemented in the company. A computerized record keeping can enable the
organization to collect the relevant information in an easier way. Furthermore, with the support
this approach, information regarding taxes and other legal requirements can be appropriately
addressed (The State of Queensland, 2017). For maximum utilization of information, especially
for the company, ‘Computerized Accounting Information System’ (CAIS) must be used, as a
signifiantly process the events and financial transactions complying with the Generally Accepted
Accounting Principles (GAAP), thereby producing required reports. Thus, it can assure enhanced
performance, transparency, accuracy, efficiency, speed and real-time user interface production of
⊘ This is a preview!⊘
Do you want full access?
Subscribe today to unlock all pages.
Trusted by 1+ million students worldwide
1 out of 19
Related Documents


Your All-in-One AI-Powered Toolkit for Academic Success.
+13062052269
info@desklib.com
Available 24*7 on WhatsApp / Email
![[object Object]](/_next/static/media/star-bottom.7253800d.svg)
Unlock your academic potential
Copyright © 2020–2026 A2Z Services. All Rights Reserved. Developed and managed by ZUCOL.