Financial Analysis Report: Performance Evaluation and Recommendations
VerifiedAdded on 2022/12/29
|9
|2257
|94
Report
AI Summary
This report provides a comprehensive financial analysis of a company, utilizing ratio analysis to evaluate its performance across various aspects, including liquidity, turnover, financial leverage, profitability, and market value. The analysis involves calculating and interpreting key financial ratios based on provided financial statements from 2016 to 2018. The report assesses the company's financial position, highlighting strengths and weaknesses, and compares its performance against industry benchmarks. The findings indicate a need for improvement in certain areas, such as liquidity and market value ratios. Based on the analysis, the report offers recommendations for enhancing financial performance and making strategic decisions, including potential expansion, improved receivable turnover, and adjustments to the current ratio and cash balance. This report aims to provide insights for informed decision-making and future financial planning.

1
Financial analysis
Financial analysis
Paraphrase This Document
Need a fresh take? Get an instant paraphrase of this document with our AI Paraphraser
2
Table of Contents
Introduction......................................................................................................................................3
Ratio analysis...................................................................................................................................3
The financial position of the company............................................................................................6
Comparison with industry ratio.......................................................................................................7
Recommendation.............................................................................................................................7
References........................................................................................................................................8
3
Introduction
In this report, the analysis will be made in relation to the financial statements. There will be a
proper evaluation of information about the company and by that, the decision making will be
undertaken. In this, there are several techniques and out of them, the ratio analysis will be
performed. In that various ratios will be calculated by the use of which all the segments of the
business will be evaluated. The financial position of the business will be identified by the help of
the results which will be obtained. There will also be undertaking of the comparison in which the
ratios of the company will be compared with that of the industry. By that the analyzation will be
made in a better manner as the position of the business in the whole industry will be taken into
account. On the basis of all the findings, certain recommendations will be provided so that future
outcomes can be improved further.
Ratio analysis
The business involves various aspects which need to be evaluated such as profitability, liquidity,
and efficiency. This will be possible with the help of ratio analysis which will be performed. In
that, all the aspects will be covered and there will be the inclusion of the information which is
present in the financial statements of the company (Omar et al., 2014). In this, there will be an
identification of the manner in which the performance is maintained and also the relation among
two of the business elements will be understood. There are several types of ratios which are
calculated and the same is presented below:
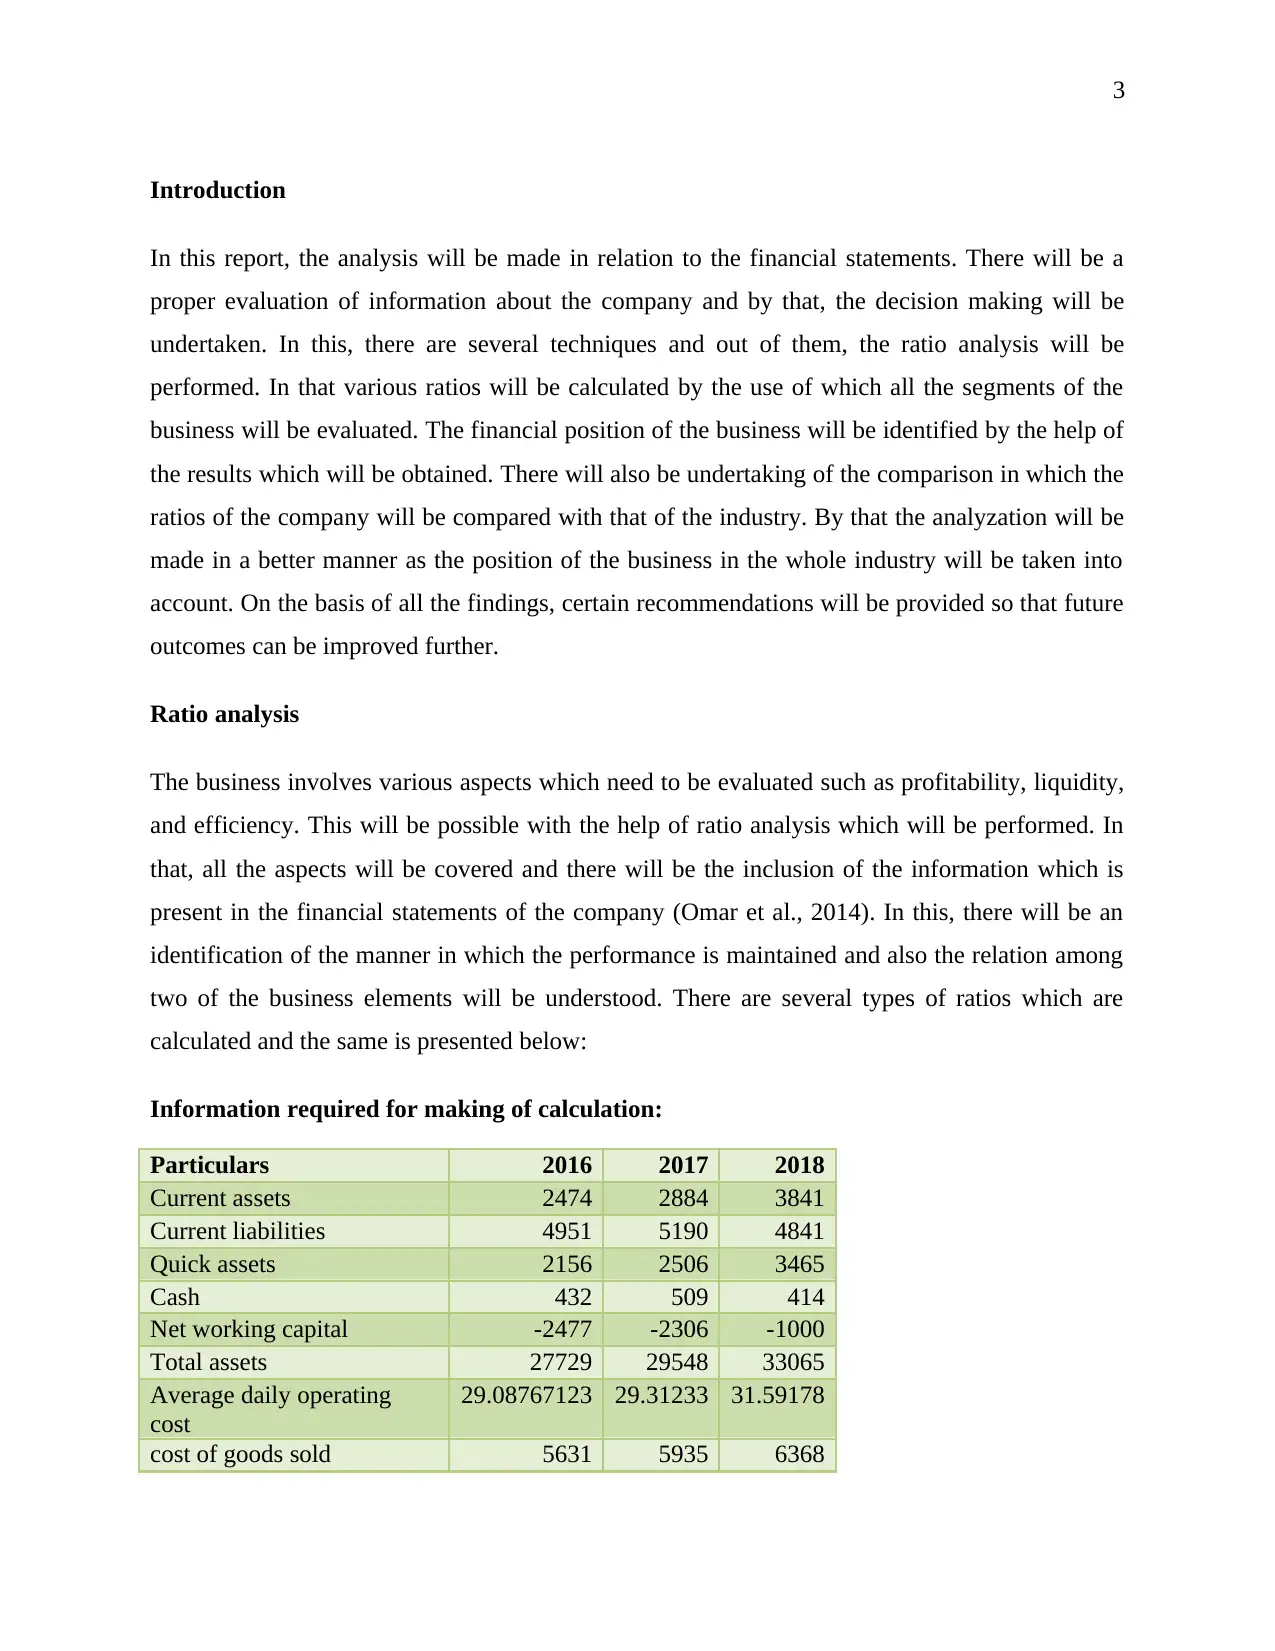
Information required for making of calculation:
Particulars 2016 2017 2018
Current assets 2474 2884 3841
Current liabilities 4951 5190 4841
Quick assets 2156 2506 3465
Cash 432 509 414
Net working capital -2477 -2306 -1000
Total assets 27729 29548 33065
Average daily operating
cost
29.08767123 29.31233 31.59178
cost of goods sold 5631 5935 6368
Introduction
In this report, the analysis will be made in relation to the financial statements. There will be a
proper evaluation of information about the company and by that, the decision making will be
undertaken. In this, there are several techniques and out of them, the ratio analysis will be
performed. In that various ratios will be calculated by the use of which all the segments of the
business will be evaluated. The financial position of the business will be identified by the help of
the results which will be obtained. There will also be undertaking of the comparison in which the
ratios of the company will be compared with that of the industry. By that the analyzation will be
made in a better manner as the position of the business in the whole industry will be taken into
account. On the basis of all the findings, certain recommendations will be provided so that future
outcomes can be improved further.
Ratio analysis
The business involves various aspects which need to be evaluated such as profitability, liquidity,
and efficiency. This will be possible with the help of ratio analysis which will be performed. In
that, all the aspects will be covered and there will be the inclusion of the information which is
present in the financial statements of the company (Omar et al., 2014). In this, there will be an
identification of the manner in which the performance is maintained and also the relation among
two of the business elements will be understood. There are several types of ratios which are
calculated and the same is presented below:
Information required for making of calculation:
Particulars 2016 2017 2018
Current assets 2474 2884 3841
Current liabilities 4951 5190 4841
Quick assets 2156 2506 3465
Cash 432 509 414
Net working capital -2477 -2306 -1000
Total assets 27729 29548 33065
Average daily operating
cost
29.08767123 29.31233 31.59178
cost of goods sold 5631 5935 6368
⊘ This is a preview!⊘
Do you want full access?
Subscribe today to unlock all pages.
Trusted by 1+ million students worldwide
4
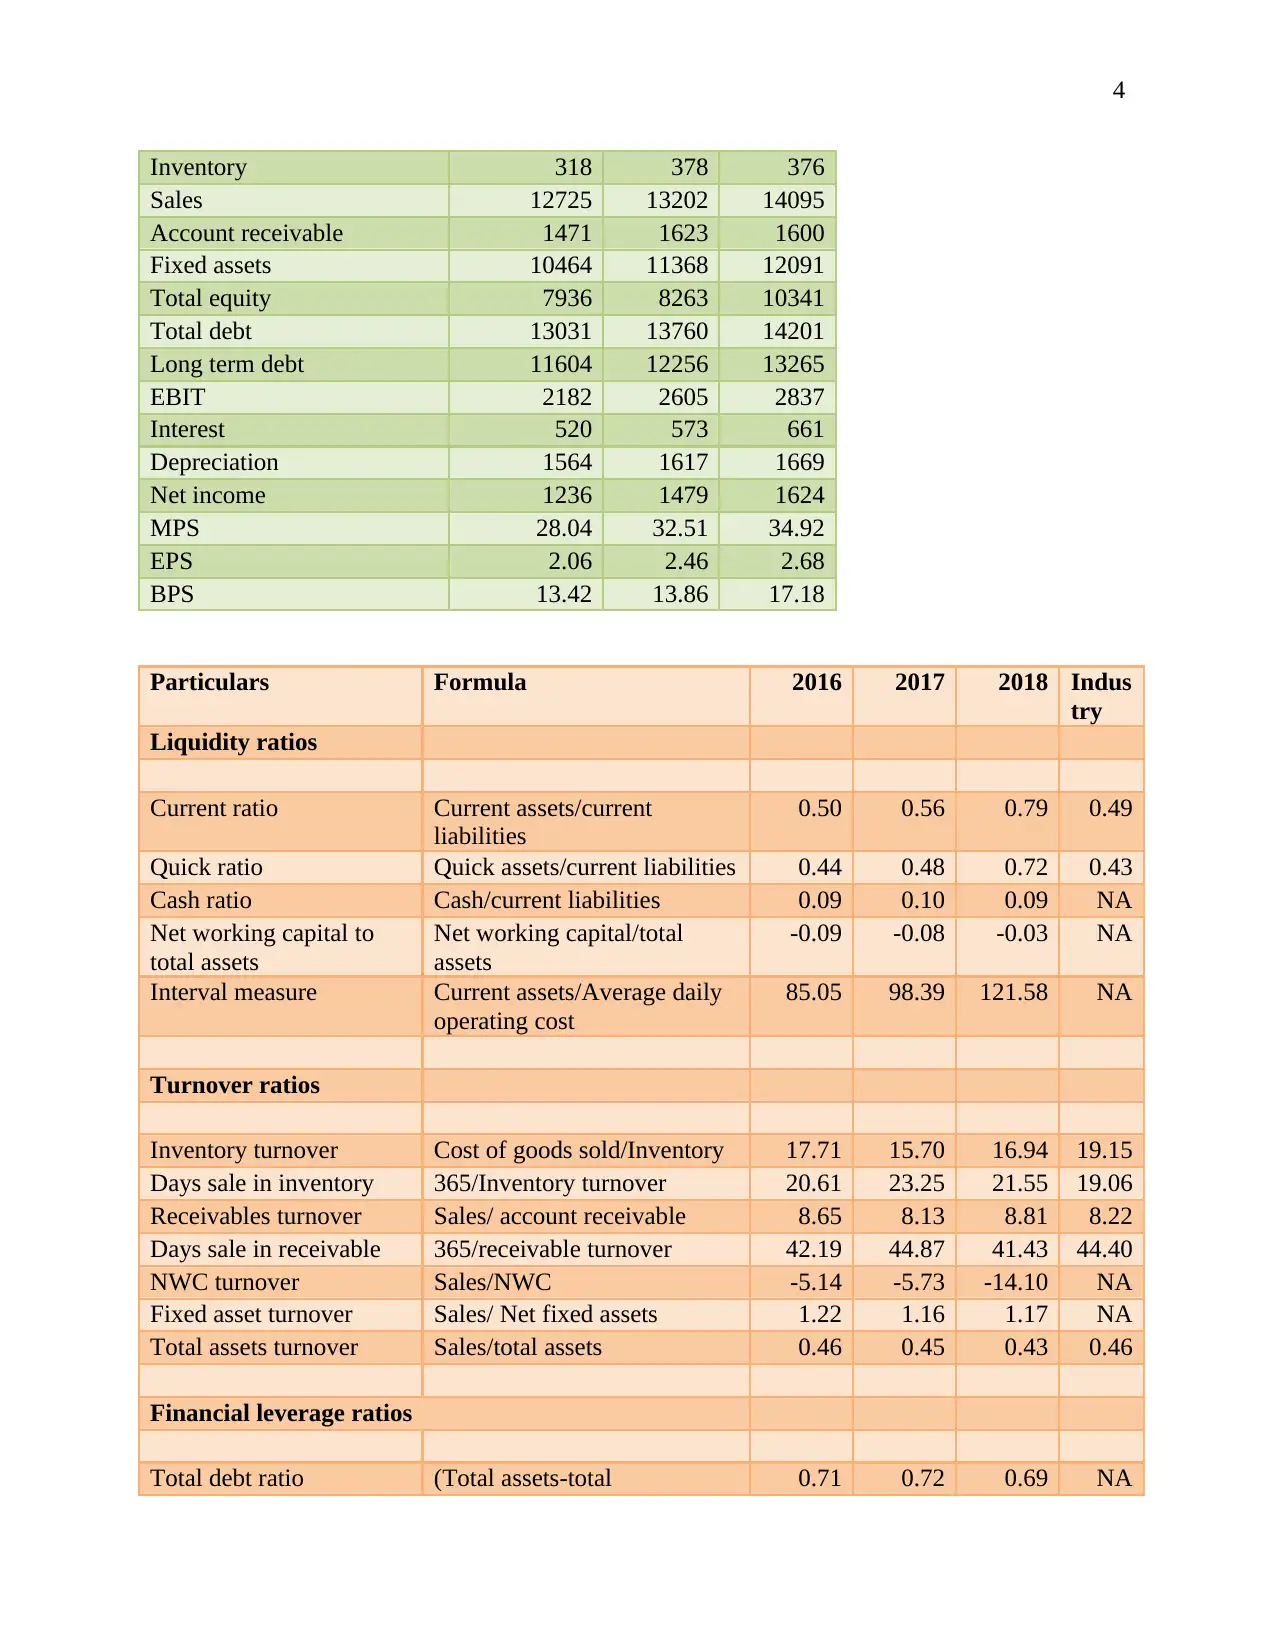
Inventory 318 378 376
Sales 12725 13202 14095
Account receivable 1471 1623 1600
Fixed assets 10464 11368 12091
Total equity 7936 8263 10341
Total debt 13031 13760 14201
Long term debt 11604 12256 13265
EBIT 2182 2605 2837
Interest 520 573 661
Depreciation 1564 1617 1669
Net income 1236 1479 1624
MPS 28.04 32.51 34.92
EPS 2.06 2.46 2.68
BPS 13.42 13.86 17.18
Particulars Formula 2016 2017 2018 Indus
try
Liquidity ratios
Current ratio Current assets/current
liabilities
0.50 0.56 0.79 0.49
Quick ratio Quick assets/current liabilities 0.44 0.48 0.72 0.43
Cash ratio Cash/current liabilities 0.09 0.10 0.09 NA
Net working capital to
total assets
Net working capital/total
assets
-0.09 -0.08 -0.03 NA
Interval measure Current assets/Average daily
operating cost
85.05 98.39 121.58 NA
Turnover ratios
Inventory turnover Cost of goods sold/Inventory 17.71 15.70 16.94 19.15
Days sale in inventory 365/Inventory turnover 20.61 23.25 21.55 19.06
Receivables turnover Sales/ account receivable 8.65 8.13 8.81 8.22
Days sale in receivable 365/receivable turnover 42.19 44.87 41.43 44.40
NWC turnover Sales/NWC -5.14 -5.73 -14.10 NA
Fixed asset turnover Sales/ Net fixed assets 1.22 1.16 1.17 NA
Total assets turnover Sales/total assets 0.46 0.45 0.43 0.46
Financial leverage ratios
Total debt ratio (Total assets-total 0.71 0.72 0.69 NA
Paraphrase This Document
Need a fresh take? Get an instant paraphrase of this document with our AI Paraphraser
5
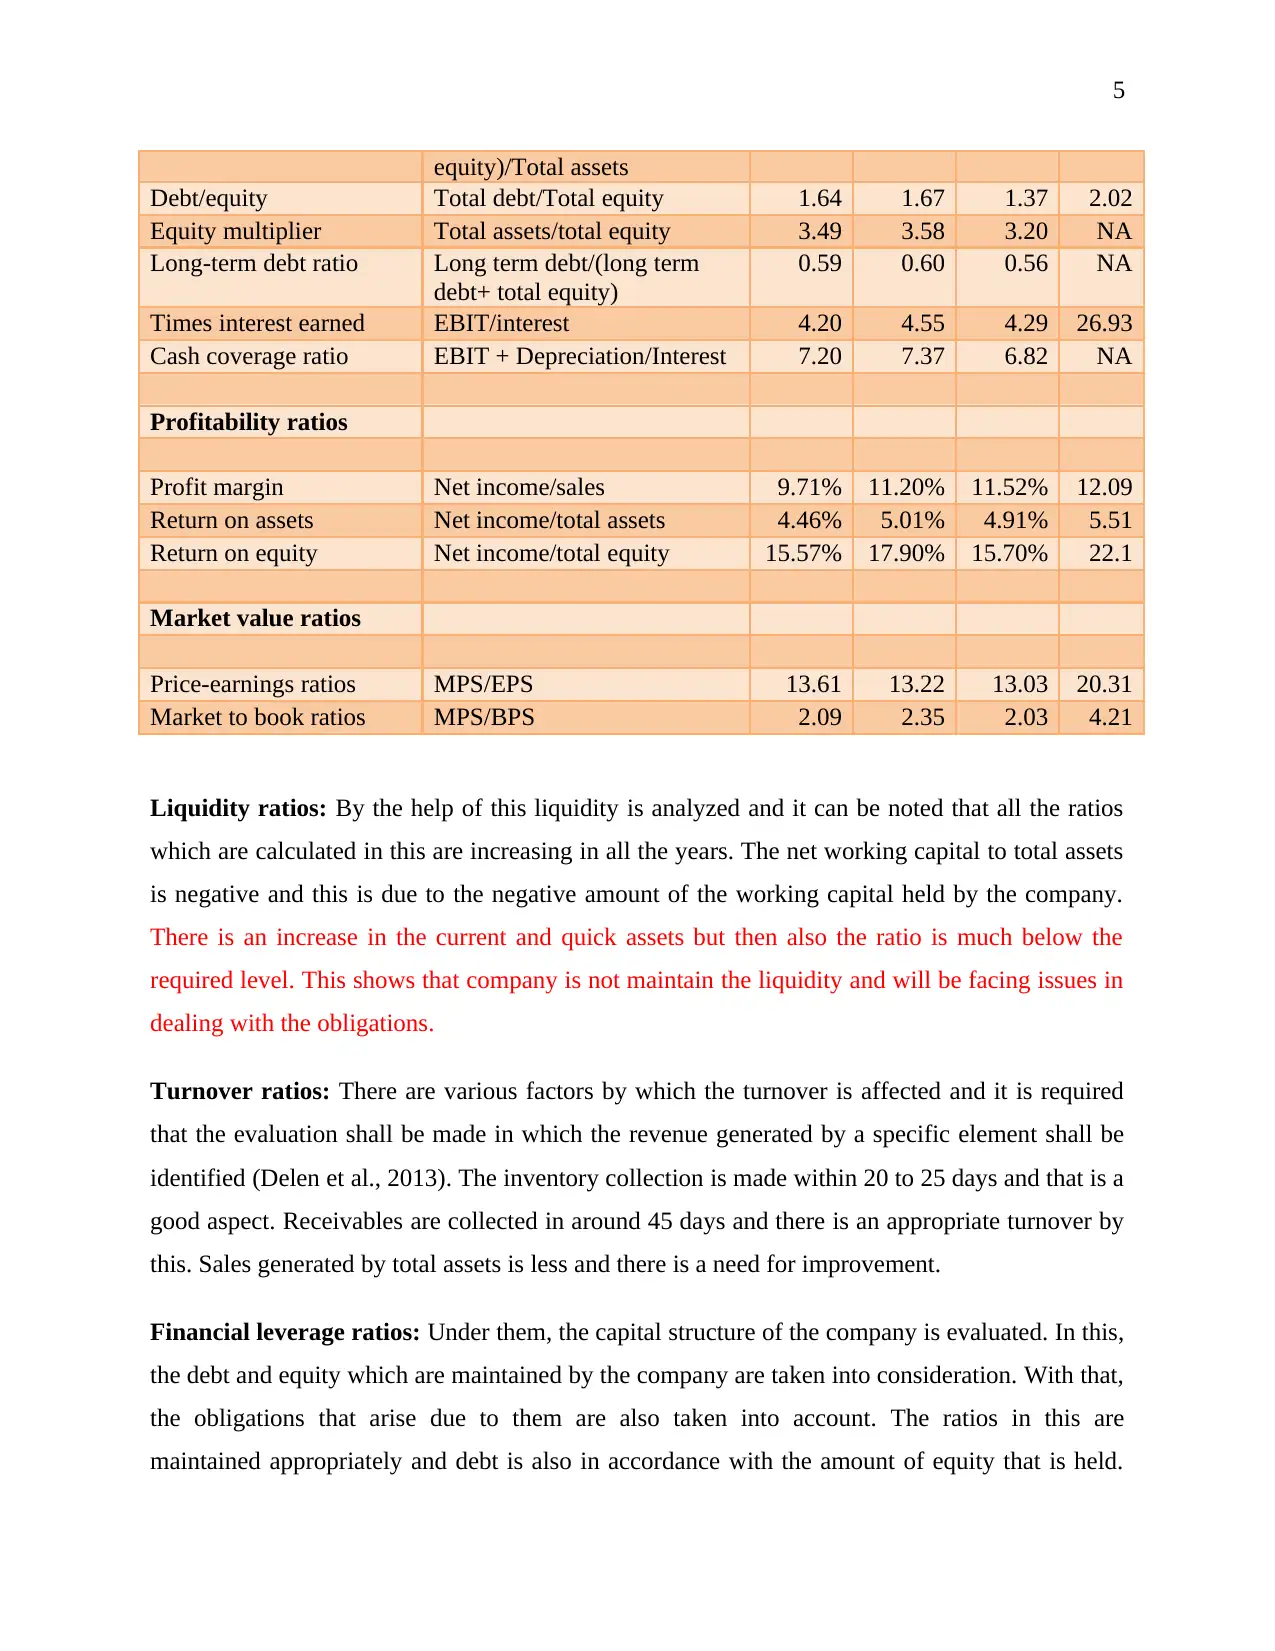
equity)/Total assets
Debt/equity Total debt/Total equity 1.64 1.67 1.37 2.02
Equity multiplier Total assets/total equity 3.49 3.58 3.20 NA
Long-term debt ratio Long term debt/(long term
debt+ total equity)
0.59 0.60 0.56 NA
Times interest earned EBIT/interest 4.20 4.55 4.29 26.93
Cash coverage ratio EBIT + Depreciation/Interest 7.20 7.37 6.82 NA
Profitability ratios
Profit margin Net income/sales 9.71% 11.20% 11.52% 12.09
Return on assets Net income/total assets 4.46% 5.01% 4.91% 5.51
Return on equity Net income/total equity 15.57% 17.90% 15.70% 22.1
Market value ratios
Price-earnings ratios MPS/EPS 13.61 13.22 13.03 20.31
Market to book ratios MPS/BPS 2.09 2.35 2.03 4.21
Liquidity ratios: By the help of this liquidity is analyzed and it can be noted that all the ratios
which are calculated in this are increasing in all the years. The net working capital to total assets
is negative and this is due to the negative amount of the working capital held by the company.
There is an increase in the current and quick assets but then also the ratio is much below the
required level. This shows that company is not maintain the liquidity and will be facing issues in
dealing with the obligations.
Turnover ratios: There are various factors by which the turnover is affected and it is required
that the evaluation shall be made in which the revenue generated by a specific element shall be
identified (Delen et al., 2013). The inventory collection is made within 20 to 25 days and that is a
good aspect. Receivables are collected in around 45 days and there is an appropriate turnover by
this. Sales generated by total assets is less and there is a need for improvement.
Financial leverage ratios: Under them, the capital structure of the company is evaluated. In this,
the debt and equity which are maintained by the company are taken into consideration. With that,
the obligations that arise due to them are also taken into account. The ratios in this are
maintained appropriately and debt is also in accordance with the amount of equity that is held.
6
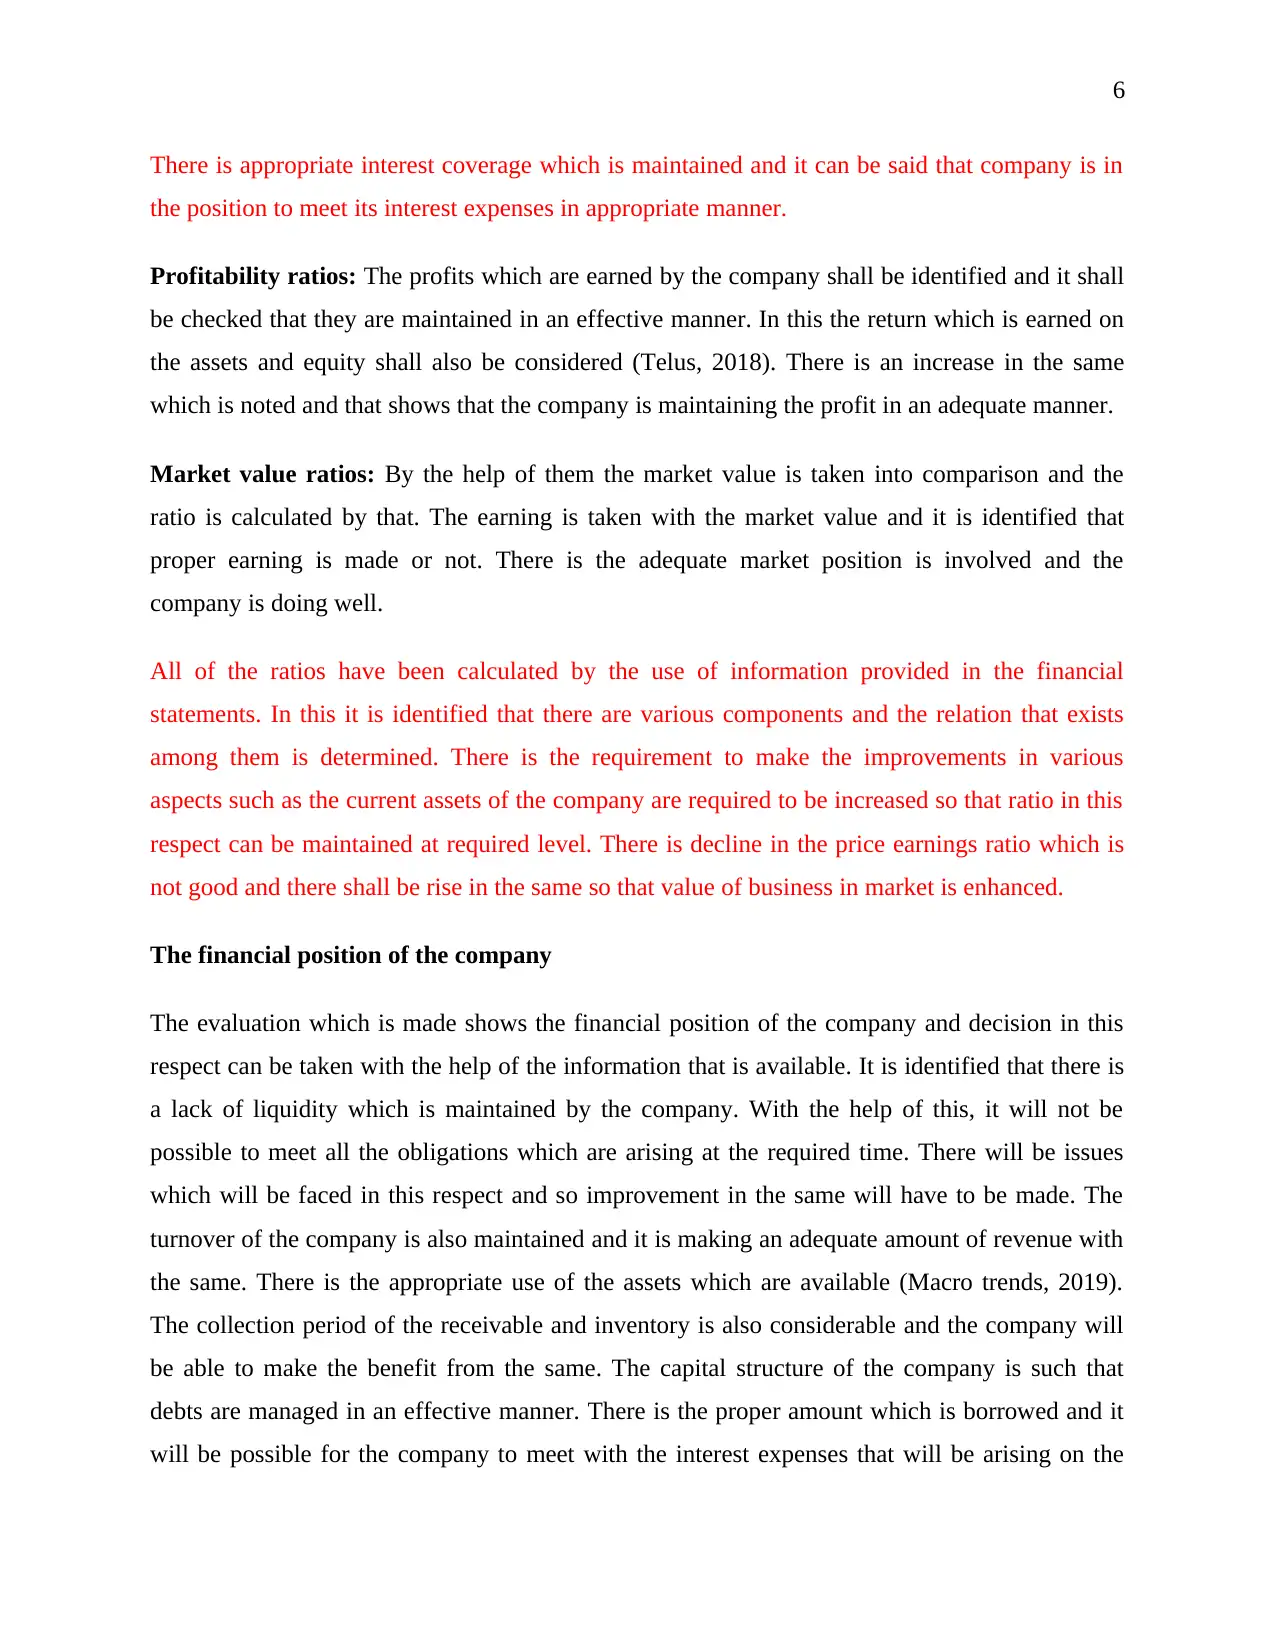
There is appropriate interest coverage which is maintained and it can be said that company is in
the position to meet its interest expenses in appropriate manner.
Profitability ratios: The profits which are earned by the company shall be identified and it shall
be checked that they are maintained in an effective manner. In this the return which is earned on
the assets and equity shall also be considered (Telus, 2018). There is an increase in the same
which is noted and that shows that the company is maintaining the profit in an adequate manner.
Market value ratios: By the help of them the market value is taken into comparison and the
ratio is calculated by that. The earning is taken with the market value and it is identified that
proper earning is made or not. There is the adequate market position is involved and the
company is doing well.
All of the ratios have been calculated by the use of information provided in the financial
statements. In this it is identified that there are various components and the relation that exists
among them is determined. There is the requirement to make the improvements in various
aspects such as the current assets of the company are required to be increased so that ratio in this
respect can be maintained at required level. There is decline in the price earnings ratio which is
not good and there shall be rise in the same so that value of business in market is enhanced.
The financial position of the company
The evaluation which is made shows the financial position of the company and decision in this
respect can be taken with the help of the information that is available. It is identified that there is
a lack of liquidity which is maintained by the company. With the help of this, it will not be
possible to meet all the obligations which are arising at the required time. There will be issues
which will be faced in this respect and so improvement in the same will have to be made. The
turnover of the company is also maintained and it is making an adequate amount of revenue with
the same. There is the appropriate use of the assets which are available (Macro trends, 2019).
The collection period of the receivable and inventory is also considerable and the company will
be able to make the benefit from the same. The capital structure of the company is such that
debts are managed in an effective manner. There is the proper amount which is borrowed and it
will be possible for the company to meet with the interest expenses that will be arising on the
⊘ This is a preview!⊘
Do you want full access?
Subscribe today to unlock all pages.
Trusted by 1+ million students worldwide
7
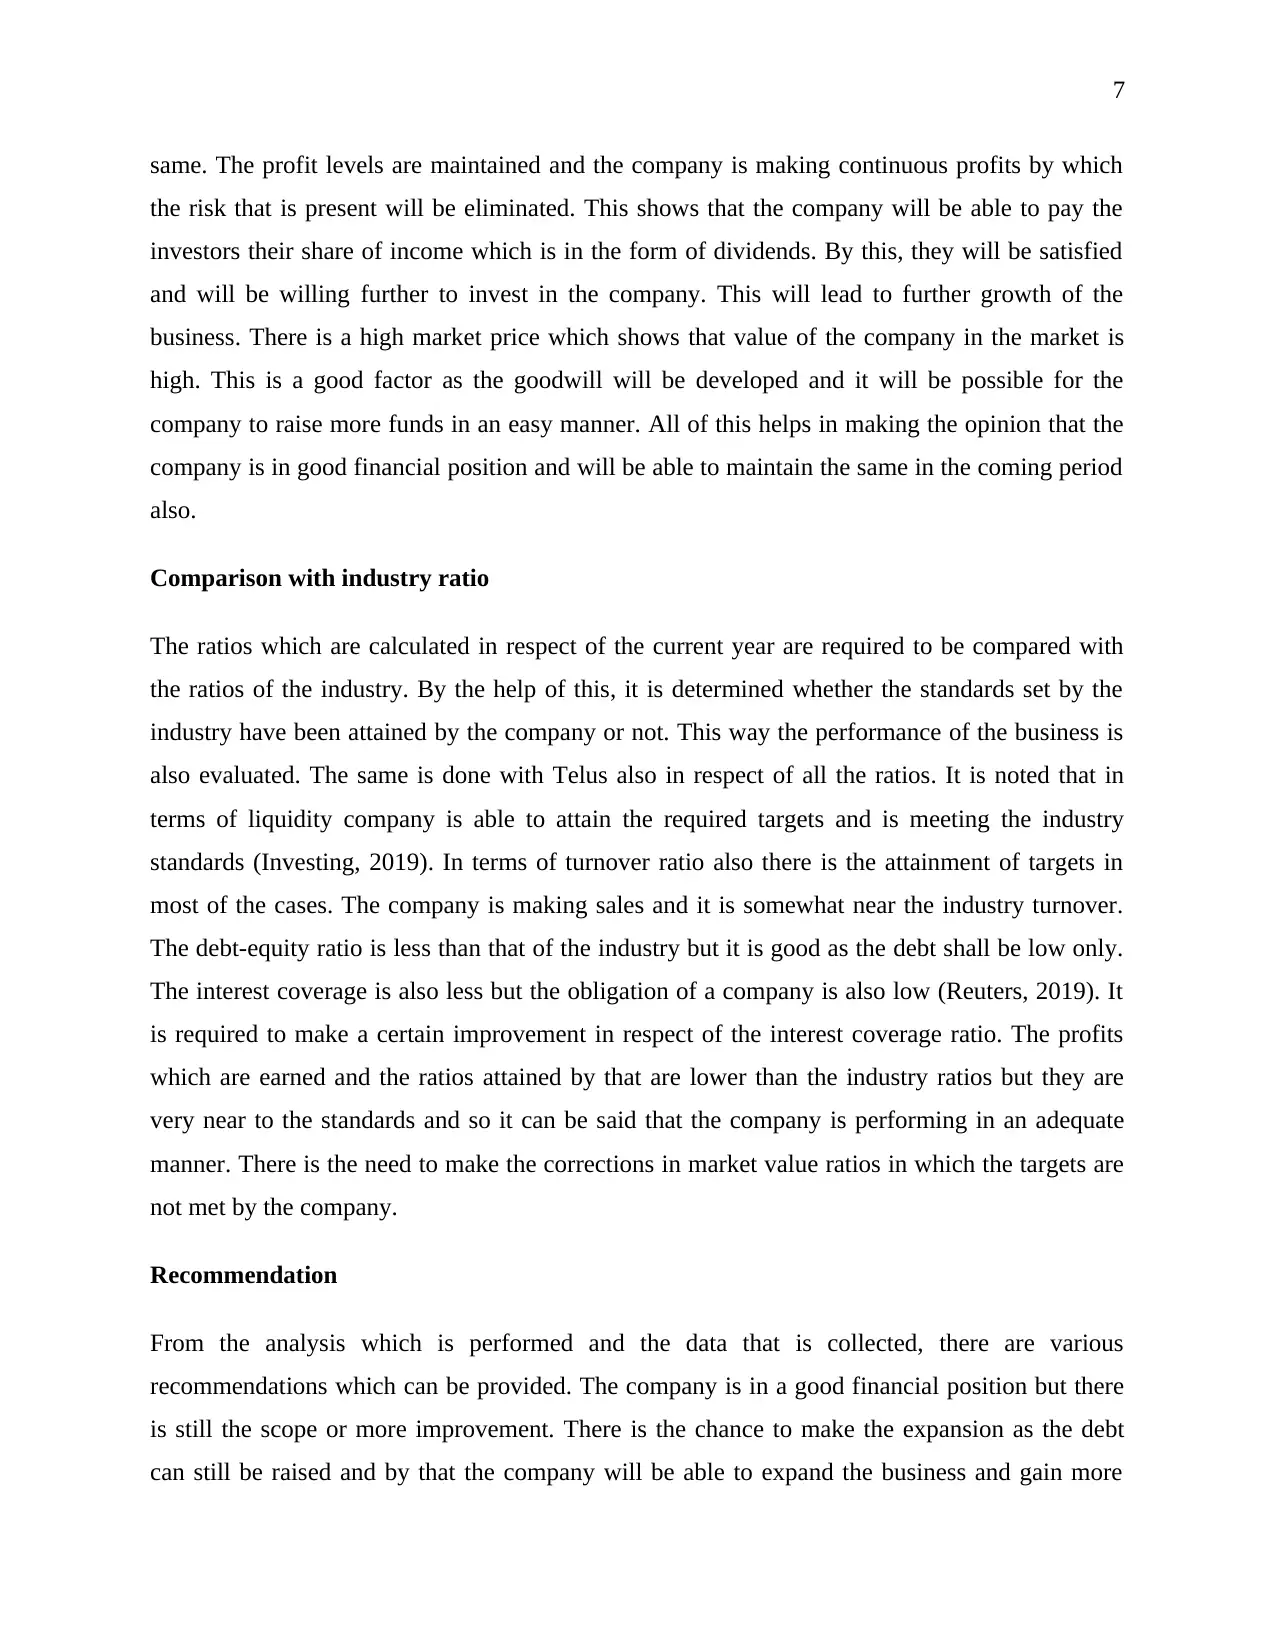
same. The profit levels are maintained and the company is making continuous profits by which
the risk that is present will be eliminated. This shows that the company will be able to pay the
investors their share of income which is in the form of dividends. By this, they will be satisfied
and will be willing further to invest in the company. This will lead to further growth of the
business. There is a high market price which shows that value of the company in the market is
high. This is a good factor as the goodwill will be developed and it will be possible for the
company to raise more funds in an easy manner. All of this helps in making the opinion that the
company is in good financial position and will be able to maintain the same in the coming period
also.
Comparison with industry ratio
The ratios which are calculated in respect of the current year are required to be compared with
the ratios of the industry. By the help of this, it is determined whether the standards set by the
industry have been attained by the company or not. This way the performance of the business is
also evaluated. The same is done with Telus also in respect of all the ratios. It is noted that in
terms of liquidity company is able to attain the required targets and is meeting the industry
standards (Investing, 2019). In terms of turnover ratio also there is the attainment of targets in
most of the cases. The company is making sales and it is somewhat near the industry turnover.
The debt-equity ratio is less than that of the industry but it is good as the debt shall be low only.
The interest coverage is also less but the obligation of a company is also low (Reuters, 2019). It
is required to make a certain improvement in respect of the interest coverage ratio. The profits
which are earned and the ratios attained by that are lower than the industry ratios but they are
very near to the standards and so it can be said that the company is performing in an adequate
manner. There is the need to make the corrections in market value ratios in which the targets are
not met by the company.
Recommendation
From the analysis which is performed and the data that is collected, there are various
recommendations which can be provided. The company is in a good financial position but there
is still the scope or more improvement. There is the chance to make the expansion as the debt
can still be raised and by that the company will be able to expand the business and gain more
Paraphrase This Document
Need a fresh take? Get an instant paraphrase of this document with our AI Paraphraser
8
income. The receivable turnover will have to be reduced to some more level and by that, the
company will have more scope to make the turnover as they can carry the cycle more times.
There is the need to improve the current ratio as this is lower than the set standard and for that,
the investment in current assets will have to be made or the reduction in the current liabilities
will have to be implemented. There is the shortage of the cash and so it is needed that the cash
balance shall be increased by the company so that it can have the proper cash ratios and will be
able to fulfill all the liabilities on time.
9
References
Delen, D., Kuzey, C., & Uyar, A. (2013). Measuring firm performance using financial ratios: A
decision tree approach. Expert Systems with Applications, 40(10), 3970-3983.
Investing. (2019). Telus Corp (T). Retrieved from: https://www.investing.com/equities/telus-
corp-ratios [Accessed 13 June 2019]
Macro trends. (2019). TELUS - 23 Year Stock Price History | TU. Retrieved from:
https://www.macrotrends.net/stocks/charts/TU/telus/stock-price-history [Accessed 13 June 2019]
Omar, N., Koya, R. K., Sanusi, Z. M., & Shafie, N. A. (2014). Financial statement fraud: A case
examination using Beneish model and ratio analysis. International Journal of Trade, Economics,
and Finance, 5(2), 184.
Reuters. (2019). Telus Corp (TU). Retrieved from:
https://www.reuters.com/finance/stocks/financial-highlights/TU [Accessed 13 June 2019]
Telus. (2017). Annual report 2017. Retrieved from:
https://assets.ctfassets.net/rz9m1rynx8pv/30cPueYwwUSuysoSSeE6oe/4bc06c10c67a516f4ff77
e2ef72bb0d7/TELUS_2017_annual_report-for_online.pdf [Accessed 13 June 2019]
Telus. (2018). Annual report 2018. Retrieved from:
https://assets.ctfassets.net/rz9m1rynx8pv/jRaoZUCqKFlMhEsgaLPDN/2920eb537702fc25ff600
42a281d84a0/TELUS_2018_annual_report-acc_FINAL.PDF [Accessed 13 June 2019]
⊘ This is a preview!⊘
Do you want full access?
Subscribe today to unlock all pages.
Trusted by 1+ million students worldwide
1 out of 9
Related Documents


Your All-in-One AI-Powered Toolkit for Academic Success.
+13062052269
info@desklib.com
Available 24*7 on WhatsApp / Email
![[object Object]](/_next/static/media/star-bottom.7253800d.svg)
Unlock your academic potential
Copyright © 2020–2026 A2Z Services. All Rights Reserved. Developed and managed by ZUCOL.