Financial Management: Costing, Budgeting and Variance Analysis
VerifiedAdded on 2022/12/28
|12
|2225
|1
Report
AI Summary
This financial management report analyzes various costing methods, including absorption costing and activity-based costing, to determine product profitability for lip gloss, lipstick, and lip balm. It compares the results of both methods, highlighting the impact of overhead allocation on profit margins. The report further explores variance analysis, calculating material usage, mix, and yield variances to assess production efficiency. Additionally, it examines zero-based budgeting and incremental budgeting approaches, outlining their merits and demerits. Finally, the report discusses the role of sensitivity analysis in managing uncertainties and its importance in evaluating the impact of changing variables on a company's financial performance, such as in cost-volume-profit analysis.

FINANCIAL MANAGEMENT
Paraphrase This Document
Need a fresh take? Get an instant paraphrase of this document with our AI Paraphraser
Table of Contents
MAIN BODY...................................................................................................................................3
Q.1................................................................................................................................................3
Q.2................................................................................................................................................6
Q.3................................................................................................................................................8
REFERENCES................................................................................................................................1
MAIN BODY
Q.1
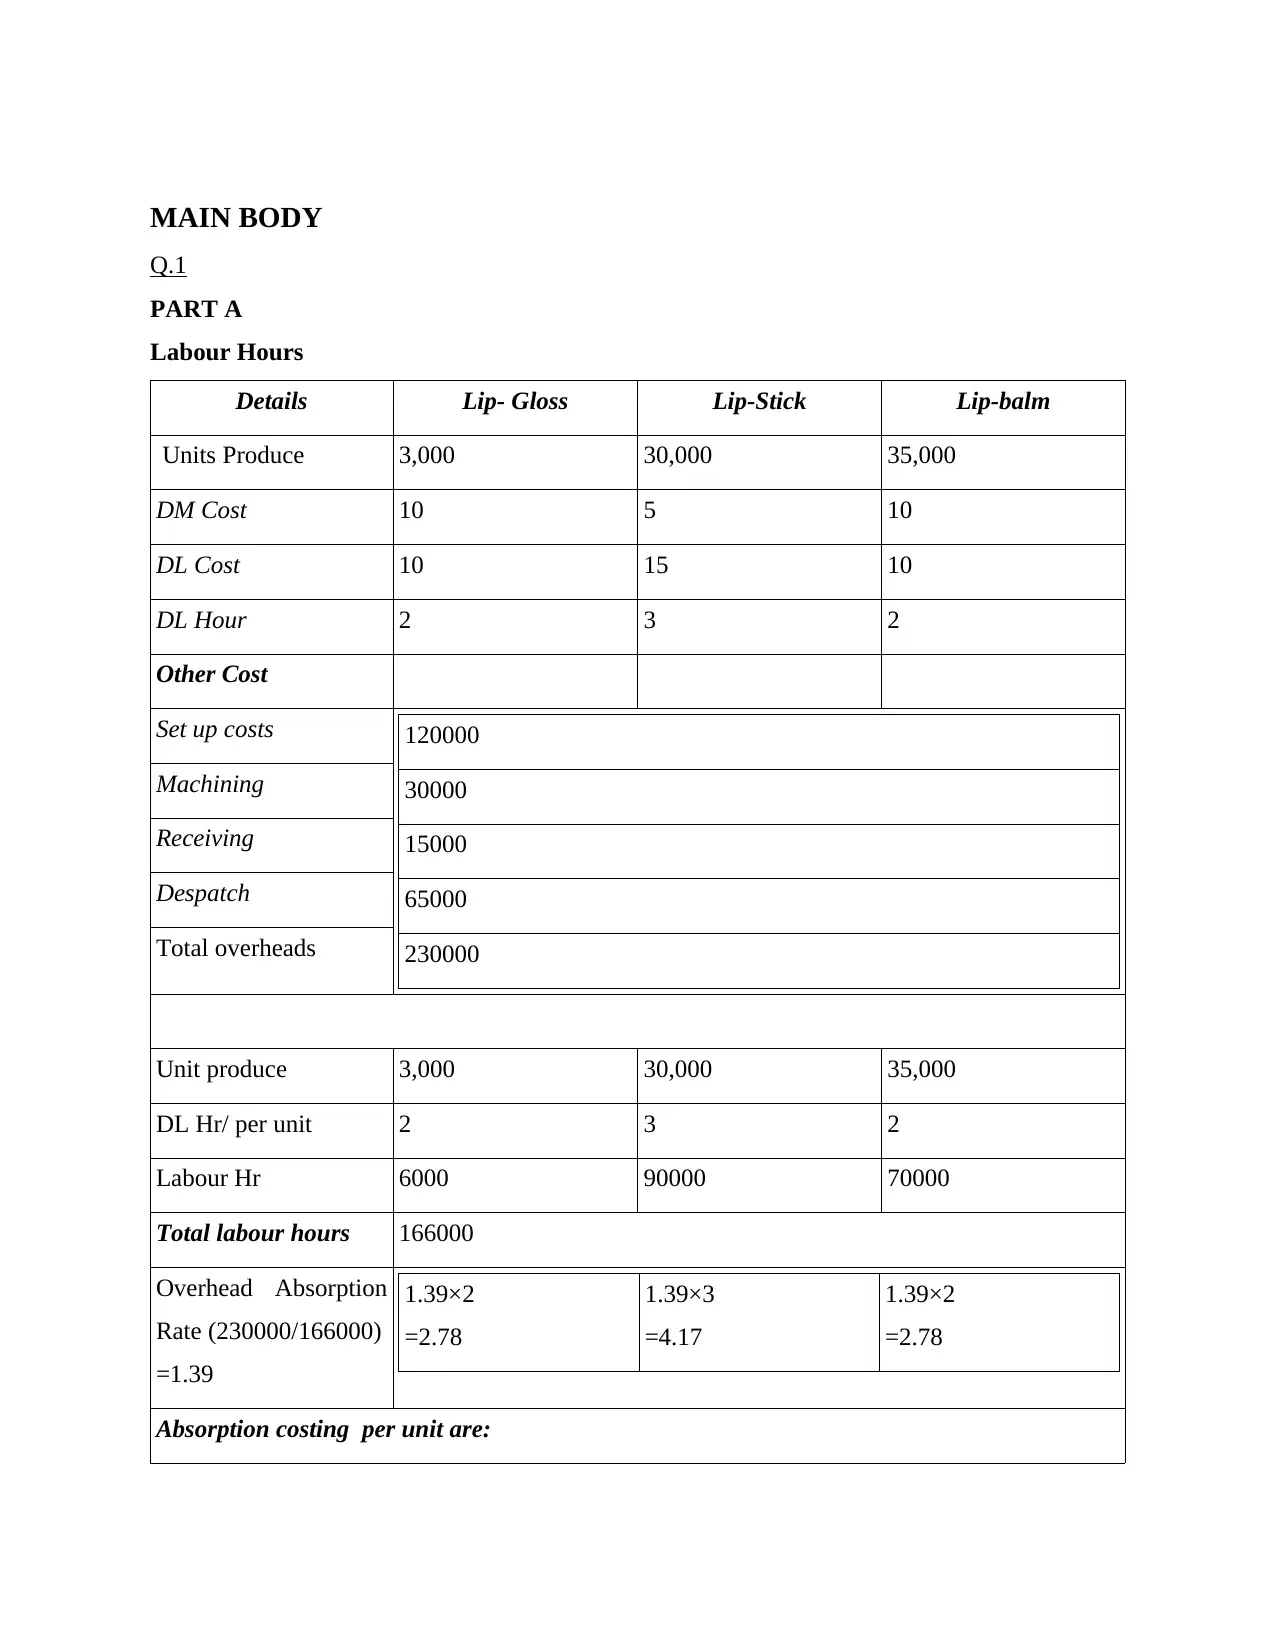
PART A
Labour Hours
Details Lip- Gloss Lip-Stick Lip-balm
Units Produce 3,000 30,000 35,000
DM Cost 10 5 10
DL Cost 10 15 10
DL Hour 2 3 2
Other Cost
Set up costs 120000
30000
15000
65000
230000
Machining
Receiving
Despatch
Total overheads
Unit produce 3,000 30,000 35,000
DL Hr/ per unit 2 3 2
Labour Hr 6000 90000 70000
Total labour hours 166000
Overhead Absorption
Rate (230000/166000)
=1.39
1.39×2
=2.78
1.39×3
=4.17
1.39×2
=2.78
Absorption costing per unit are:
Q.1
PART A
Labour Hours
Details Lip- Gloss Lip-Stick Lip-balm
Units Produce 3,000 30,000 35,000
DM Cost 10 5 10
DL Cost 10 15 10
DL Hour 2 3 2
Other Cost
Set up costs 120000
30000
15000
65000
230000
Machining
Receiving
Despatch
Total overheads
Unit produce 3,000 30,000 35,000
DL Hr/ per unit 2 3 2
Labour Hr 6000 90000 70000
Total labour hours 166000
Overhead Absorption
Rate (230000/166000)
=1.39
1.39×2
=2.78
1.39×3
=4.17
1.39×2
=2.78
Absorption costing per unit are:
⊘ This is a preview!⊘
Do you want full access?
Subscribe today to unlock all pages.
Trusted by 1+ million students worldwide
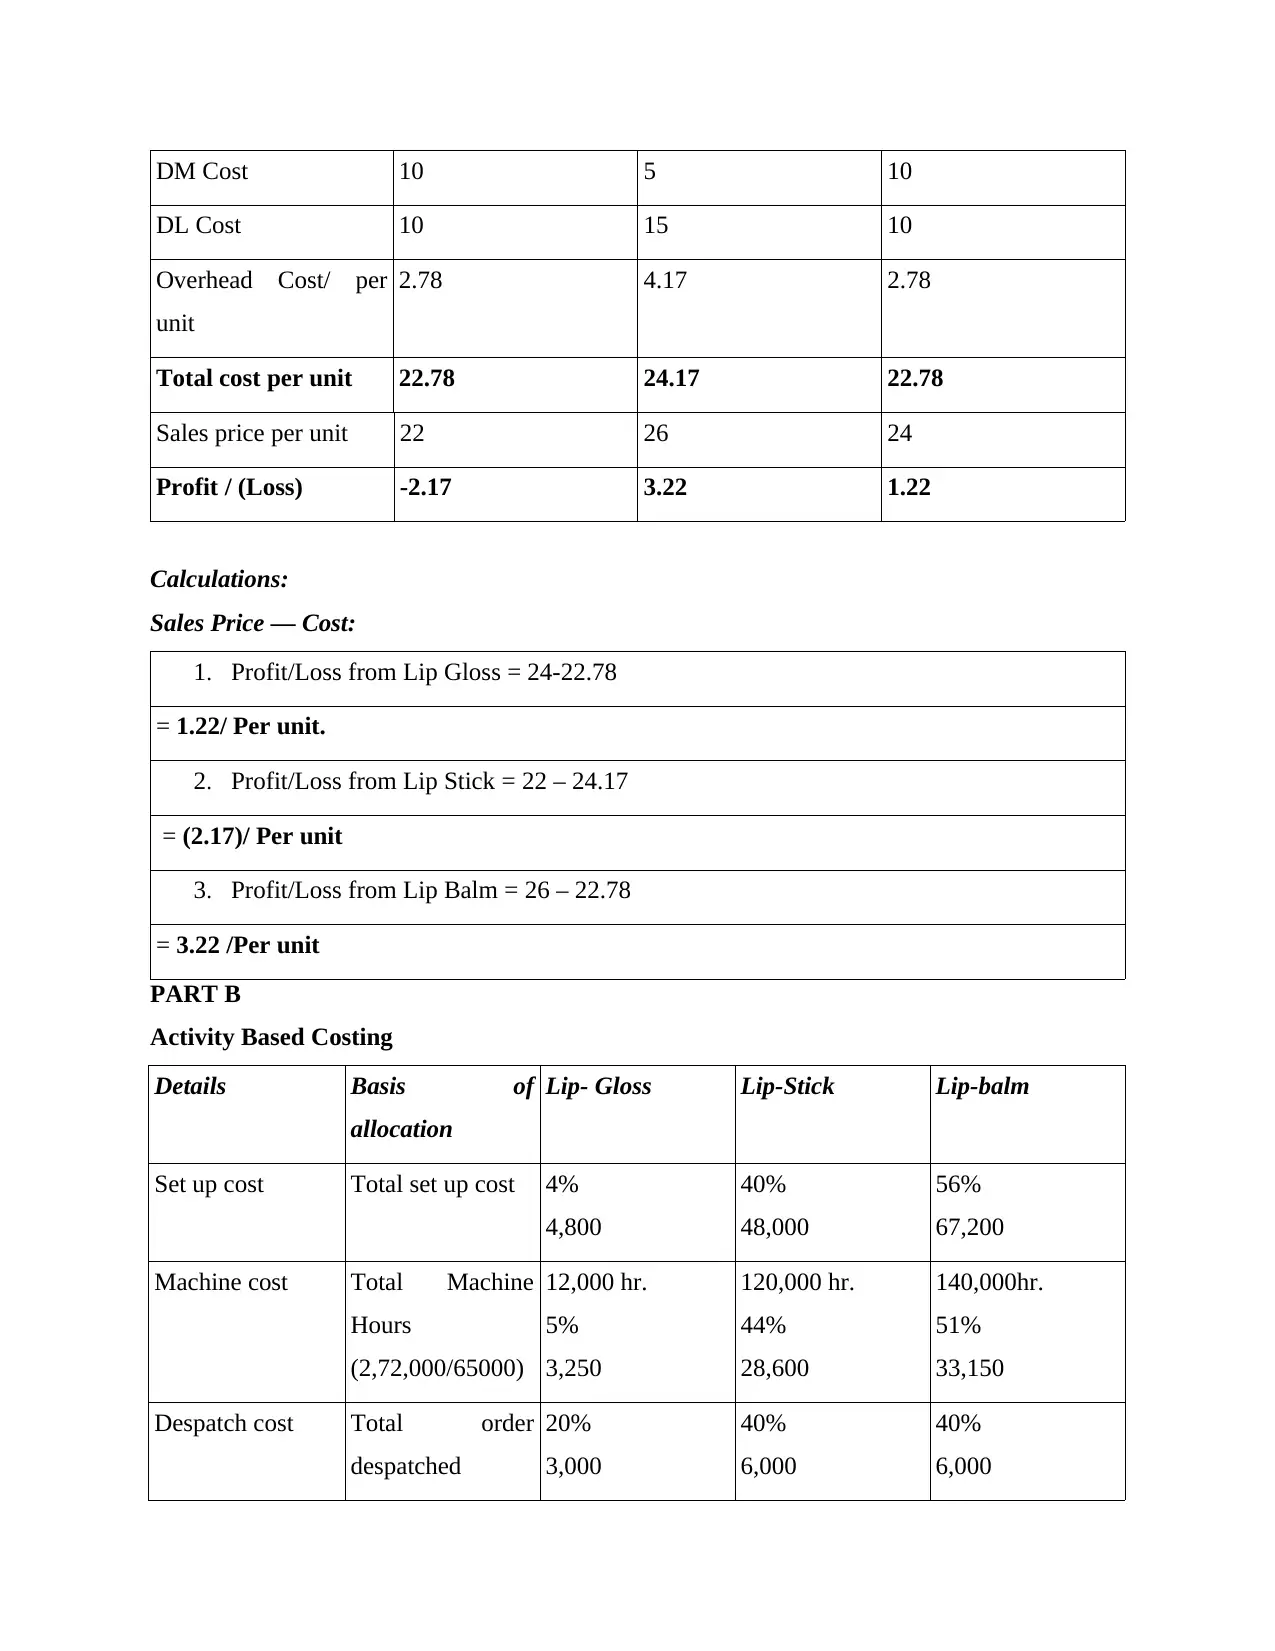
DM Cost 10 5 10
DL Cost 10 15 10
Overhead Cost/ per
unit
2.78 4.17 2.78
Total cost per unit 22.78 24.17 22.78
Sales price per unit 22 26 24
Profit / (Loss) -2.17 3.22 1.22
Calculations:
Sales Price — Cost:
1. Profit/Loss from Lip Gloss = 24-22.78
= 1.22/ Per unit.
2. Profit/Loss from Lip Stick = 22 – 24.17
= (2.17)/ Per unit
3. Profit/Loss from Lip Balm = 26 – 22.78
= 3.22 /Per unit
PART B
Activity Based Costing
Details Basis of
allocation
Lip- Gloss Lip-Stick Lip-balm
Set up cost Total set up cost 4%
4,800
40%
48,000
56%
67,200
Machine cost Total Machine
Hours
(2,72,000/65000)
12,000 hr.
5%
3,250
120,000 hr.
44%
28,600
140,000hr.
51%
33,150
Despatch cost Total order
despatched
20%
3,000
40%
6,000
40%
6,000
Paraphrase This Document
Need a fresh take? Get an instant paraphrase of this document with our AI Paraphraser
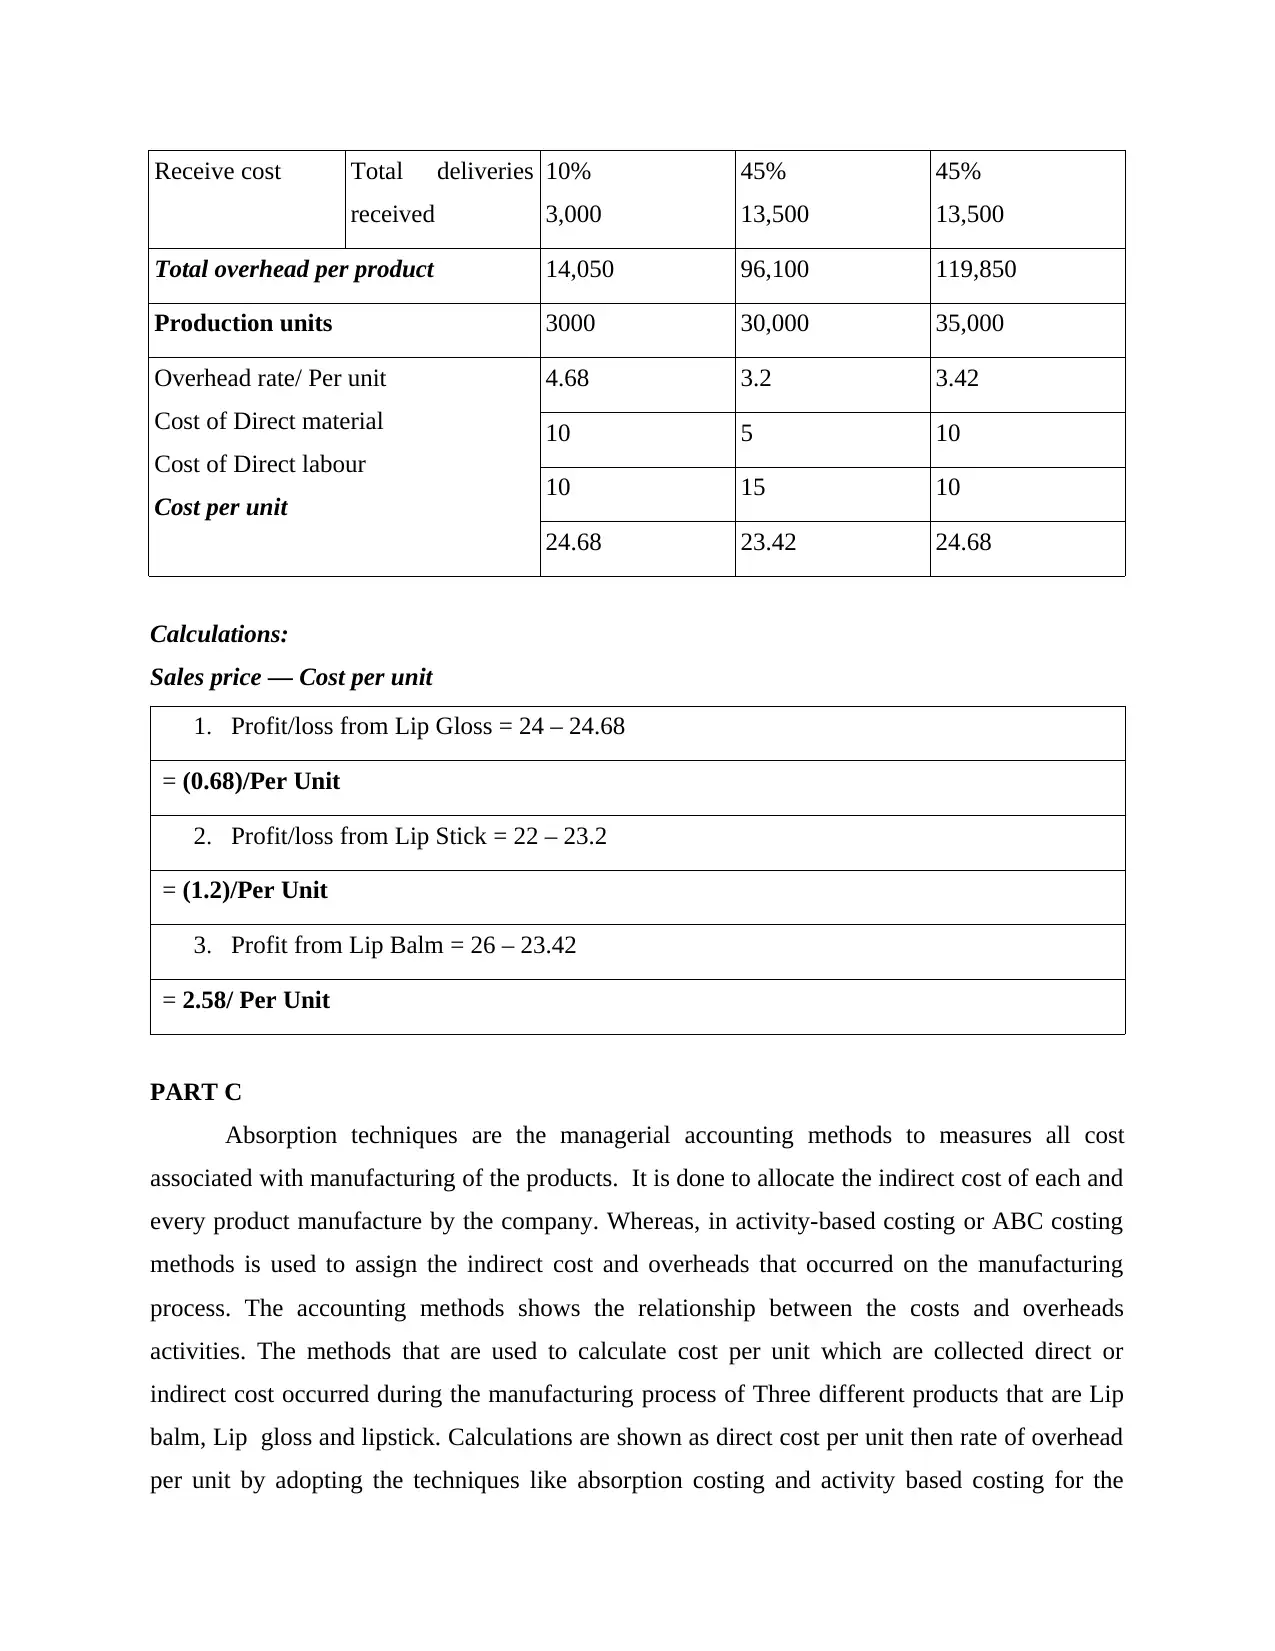
Receive cost Total deliveries
received
10%
3,000
45%
13,500
45%
13,500
Total overhead per product 14,050 96,100 119,850
Production units 3000 30,000 35,000
Overhead rate/ Per unit
Cost of Direct material
Cost of Direct labour
Cost per unit
4.68 3.2 3.42
10 5 10
10 15 10
24.68 23.42 24.68
Calculations:
Sales price — Cost per unit
1. Profit/loss from Lip Gloss = 24 – 24.68
= (0.68)/Per Unit
2. Profit/loss from Lip Stick = 22 – 23.2
= (1.2)/Per Unit
3. Profit from Lip Balm = 26 – 23.42
= 2.58/ Per Unit
PART C
Absorption techniques are the managerial accounting methods to measures all cost
associated with manufacturing of the products. It is done to allocate the indirect cost of each and
every product manufacture by the company. Whereas, in activity-based costing or ABC costing
methods is used to assign the indirect cost and overheads that occurred on the manufacturing
process. The accounting methods shows the relationship between the costs and overheads
activities. The methods that are used to calculate cost per unit which are collected direct or
indirect cost occurred during the manufacturing process of Three different products that are Lip
balm, Lip gloss and lipstick. Calculations are shown as direct cost per unit then rate of overhead
per unit by adopting the techniques like absorption costing and activity based costing for the
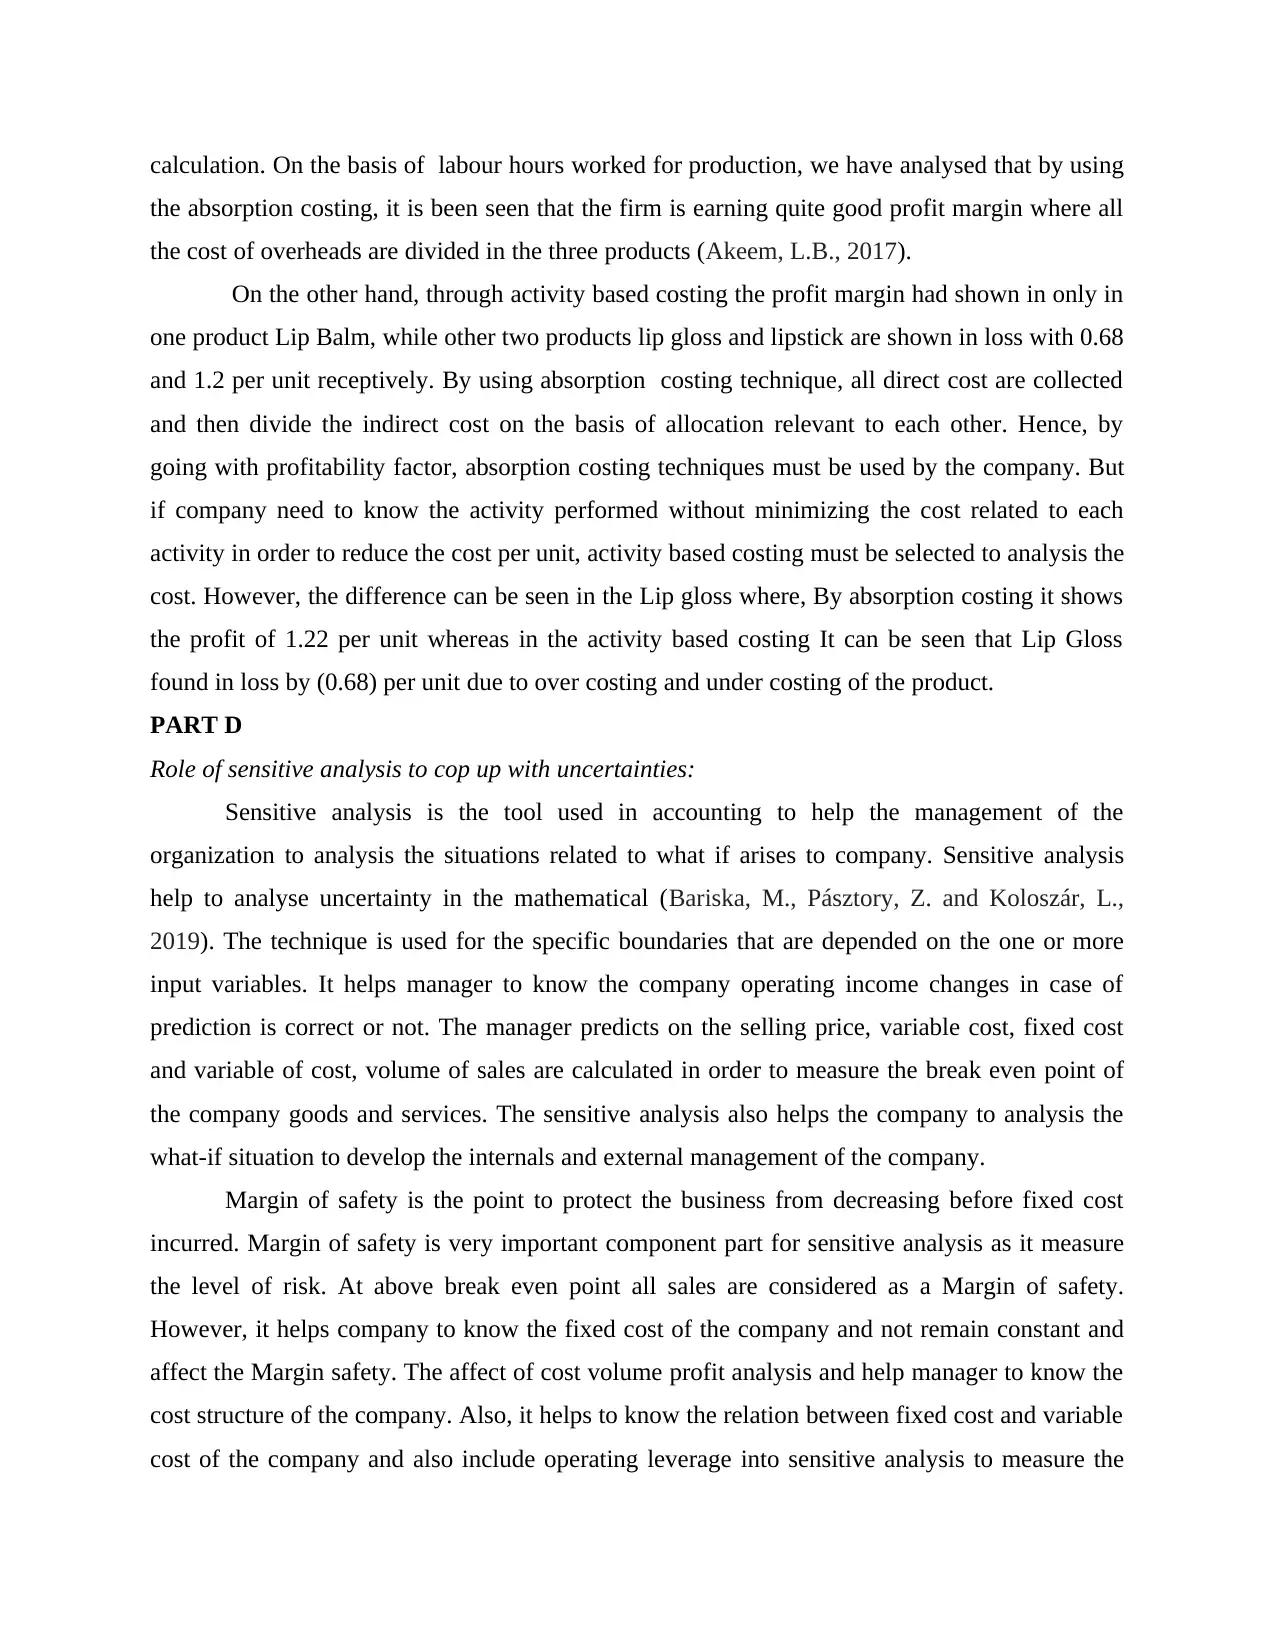
calculation. On the basis of labour hours worked for production, we have analysed that by using
the absorption costing, it is been seen that the firm is earning quite good profit margin where all
the cost of overheads are divided in the three products (Akeem, L.B., 2017).
On the other hand, through activity based costing the profit margin had shown in only in
one product Lip Balm, while other two products lip gloss and lipstick are shown in loss with 0.68
and 1.2 per unit receptively. By using absorption costing technique, all direct cost are collected
and then divide the indirect cost on the basis of allocation relevant to each other. Hence, by
going with profitability factor, absorption costing techniques must be used by the company. But
if company need to know the activity performed without minimizing the cost related to each
activity in order to reduce the cost per unit, activity based costing must be selected to analysis the
cost. However, the difference can be seen in the Lip gloss where, By absorption costing it shows
the profit of 1.22 per unit whereas in the activity based costing It can be seen that Lip Gloss
found in loss by (0.68) per unit due to over costing and under costing of the product.
PART D
Role of sensitive analysis to cop up with uncertainties:
Sensitive analysis is the tool used in accounting to help the management of the
organization to analysis the situations related to what if arises to company. Sensitive analysis
help to analyse uncertainty in the mathematical (Bariska, M., Pásztory, Z. and Koloszár, L.,
2019). The technique is used for the specific boundaries that are depended on the one or more
input variables. It helps manager to know the company operating income changes in case of
prediction is correct or not. The manager predicts on the selling price, variable cost, fixed cost
and variable of cost, volume of sales are calculated in order to measure the break even point of
the company goods and services. The sensitive analysis also helps the company to analysis the
what-if situation to develop the internals and external management of the company.
Margin of safety is the point to protect the business from decreasing before fixed cost
incurred. Margin of safety is very important component part for sensitive analysis as it measure
the level of risk. At above break even point all sales are considered as a Margin of safety.
However, it helps company to know the fixed cost of the company and not remain constant and
affect the Margin safety. The affect of cost volume profit analysis and help manager to know the
cost structure of the company. Also, it helps to know the relation between fixed cost and variable
cost of the company and also include operating leverage into sensitive analysis to measure the
⊘ This is a preview!⊘
Do you want full access?
Subscribe today to unlock all pages.
Trusted by 1+ million students worldwide
impact of cost structure on company's profit (alagatti, V.D., 2020). It helps Manager to interpret
the performance of the company.
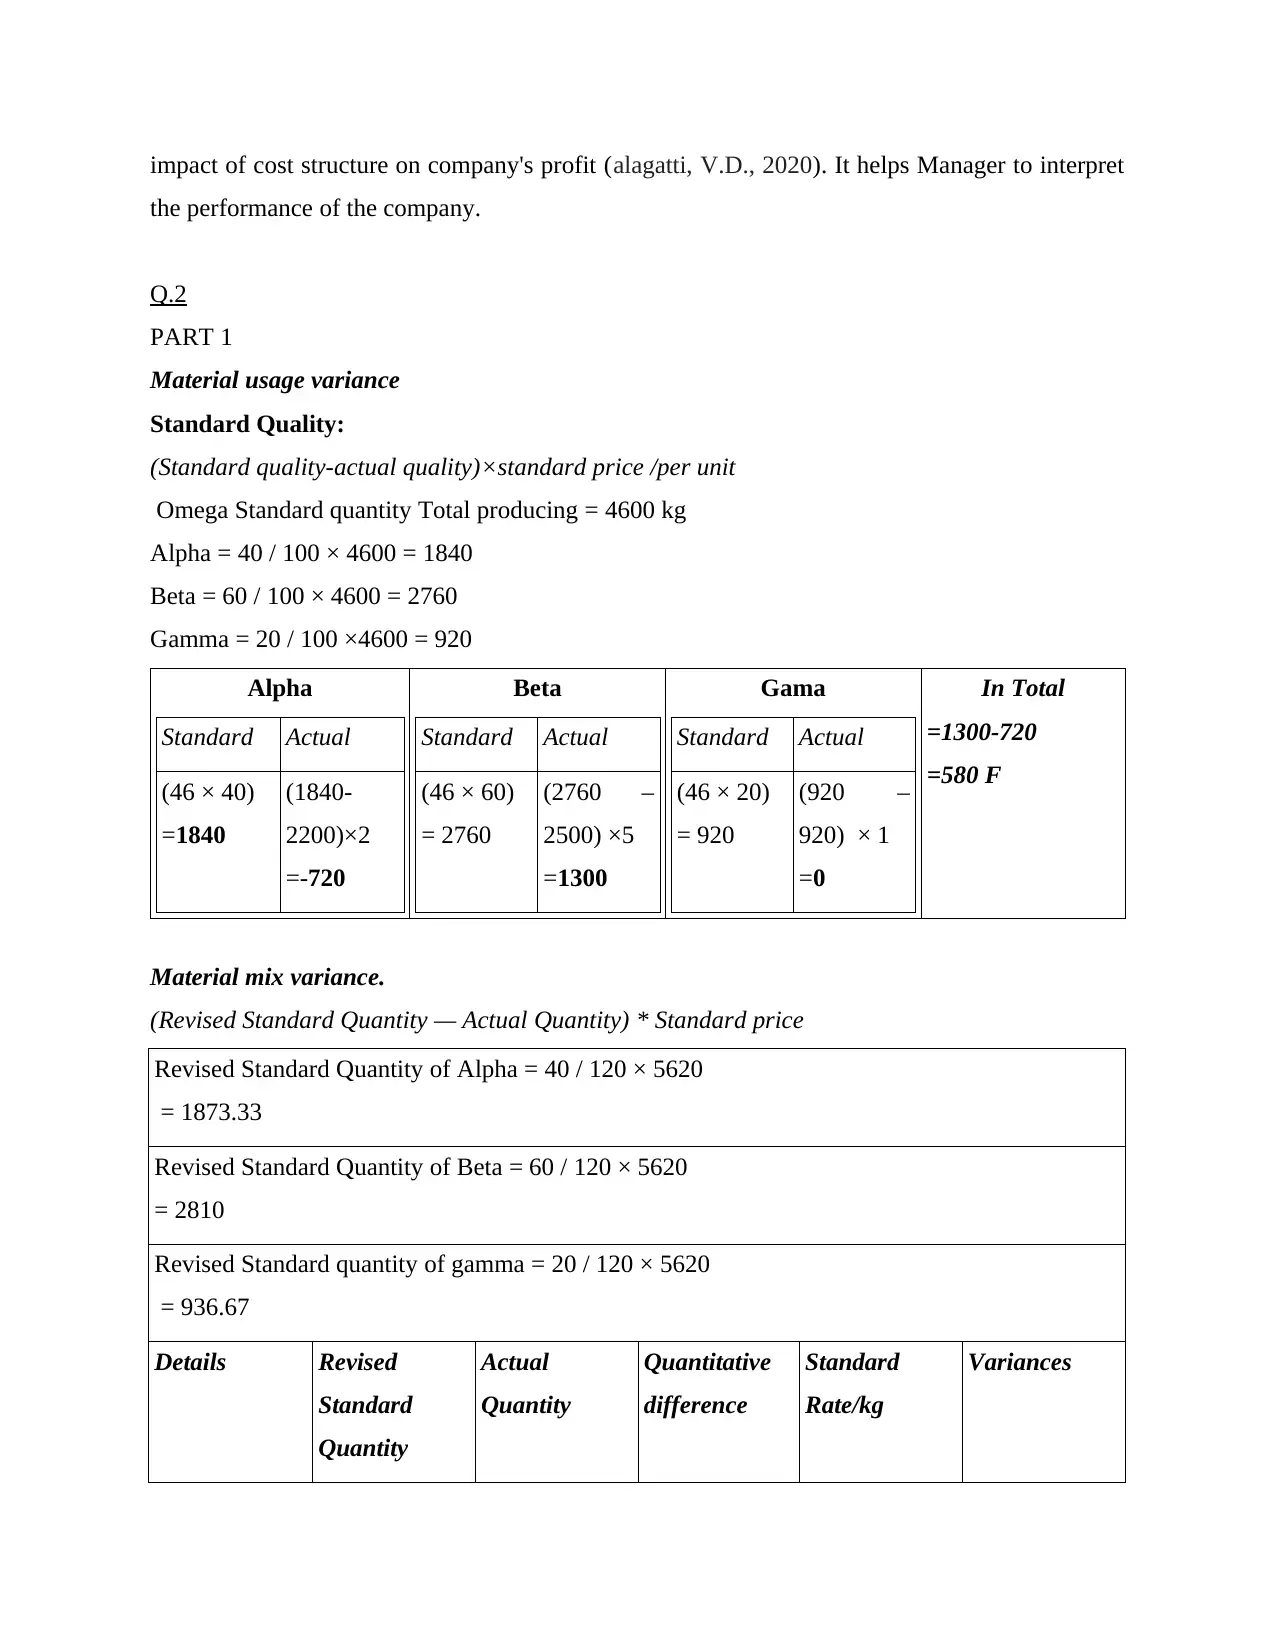
Q.2
PART 1
Material usage variance
Standard Quality:
(Standard quality-actual quality)×standard price /per unit
Omega Standard quantity Total producing = 4600 kg
Alpha = 40 / 100 × 4600 = 1840
Beta = 60 / 100 × 4600 = 2760
Gamma = 20 / 100 ×4600 = 920
Alpha
Standard Actual
(46 × 40)
=1840
(1840-
2200)×2
=-720
Beta
Standard Actual
(46 × 60)
= 2760
(2760 –
2500) ×5
=1300
Gama
Standard Actual
(46 × 20)
= 920
(920 –
920) × 1
=0
In Total
=1300-720
=580 F
Material mix variance.
(Revised Standard Quantity — Actual Quantity) * Standard price
Revised Standard Quantity of Alpha = 40 / 120 × 5620
= 1873.33
Revised Standard Quantity of Beta = 60 / 120 × 5620
= 2810
Revised Standard quantity of gamma = 20 / 120 × 5620
= 936.67
Details Revised
Standard
Quantity
Actual
Quantity
Quantitative
difference
Standard
Rate/kg
Variances
the performance of the company.
Q.2
PART 1
Material usage variance
Standard Quality:
(Standard quality-actual quality)×standard price /per unit
Omega Standard quantity Total producing = 4600 kg
Alpha = 40 / 100 × 4600 = 1840
Beta = 60 / 100 × 4600 = 2760
Gamma = 20 / 100 ×4600 = 920
Alpha
Standard Actual
(46 × 40)
=1840
(1840-
2200)×2
=-720
Beta
Standard Actual
(46 × 60)
= 2760
(2760 –
2500) ×5
=1300
Gama
Standard Actual
(46 × 20)
= 920
(920 –
920) × 1
=0
In Total
=1300-720
=580 F
Material mix variance.
(Revised Standard Quantity — Actual Quantity) * Standard price
Revised Standard Quantity of Alpha = 40 / 120 × 5620
= 1873.33
Revised Standard Quantity of Beta = 60 / 120 × 5620
= 2810
Revised Standard quantity of gamma = 20 / 120 × 5620
= 936.67
Details Revised
Standard
Quantity
Actual
Quantity
Quantitative
difference
Standard
Rate/kg
Variances
Paraphrase This Document
Need a fresh take? Get an instant paraphrase of this document with our AI Paraphraser
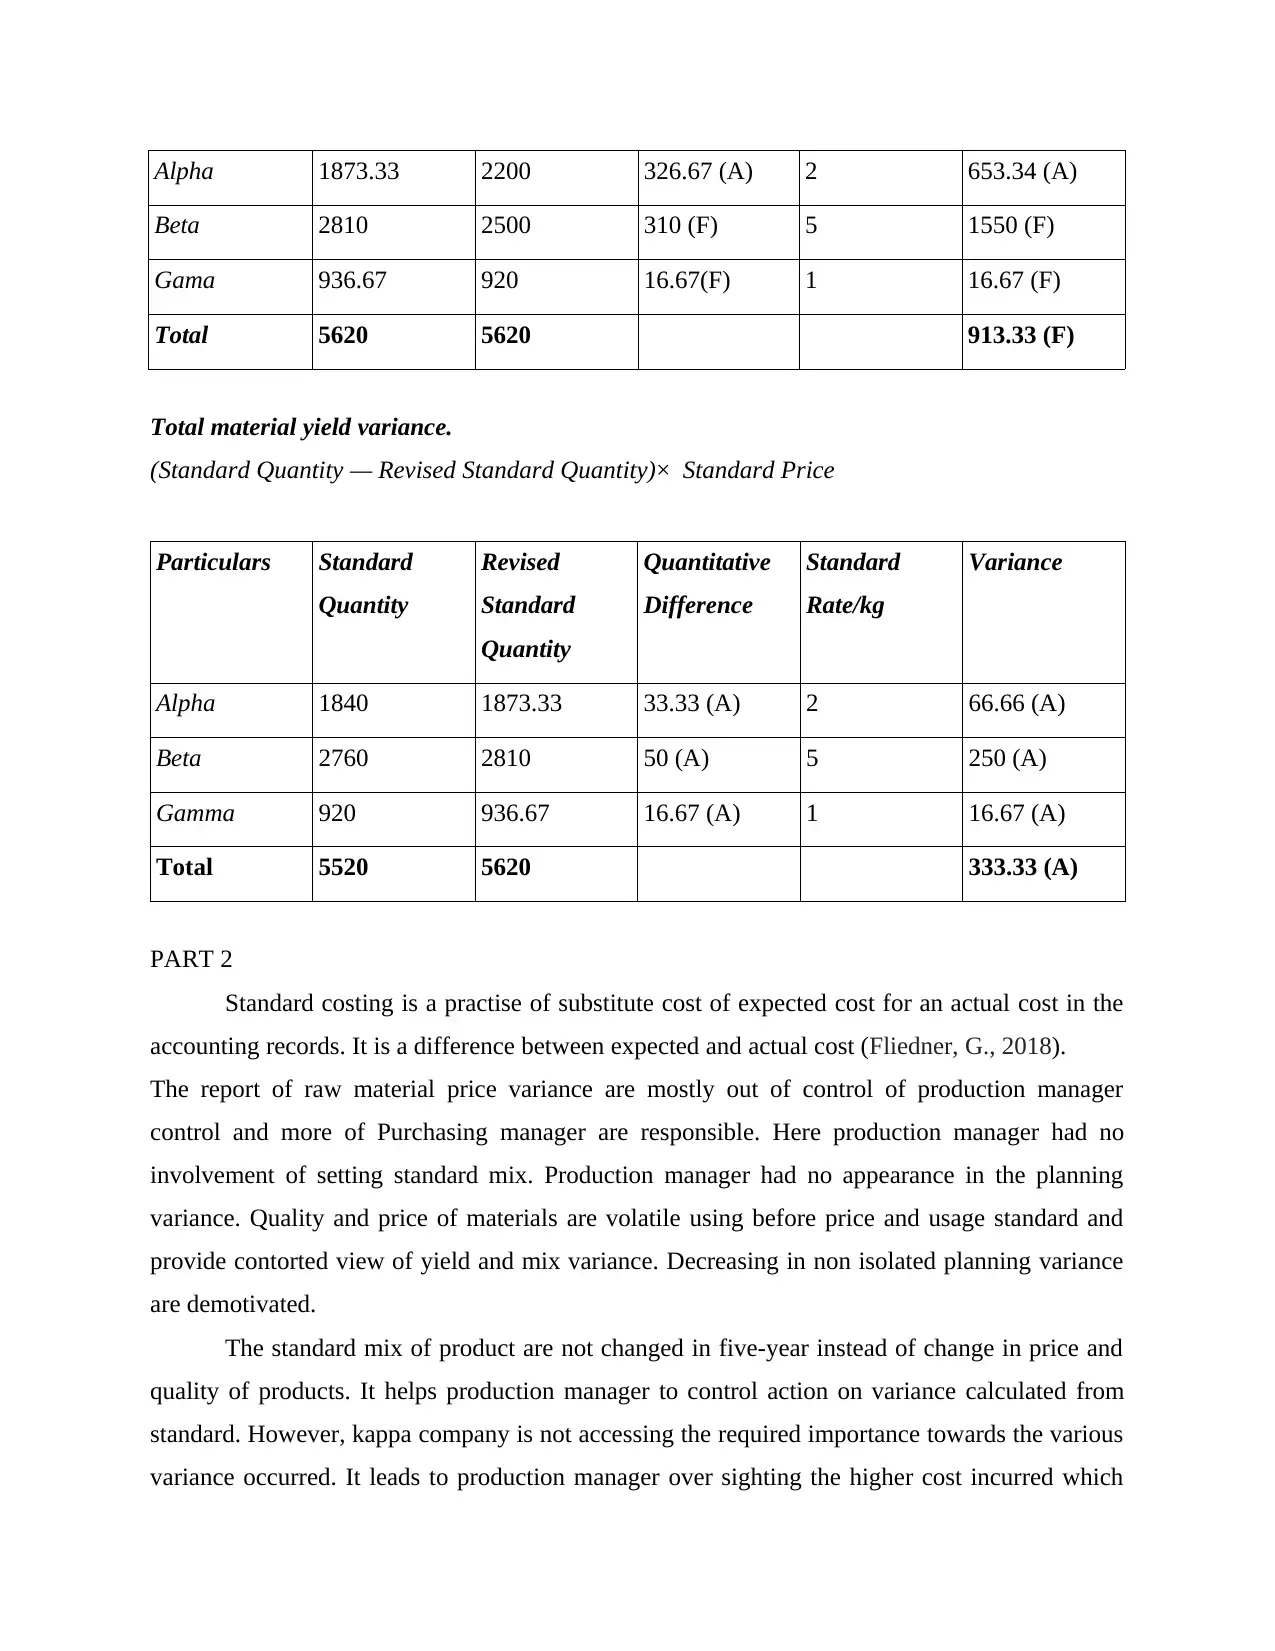
Alpha 1873.33 2200 326.67 (A) 2 653.34 (A)
Beta 2810 2500 310 (F) 5 1550 (F)
Gama 936.67 920 16.67(F) 1 16.67 (F)
Total 5620 5620 913.33 (F)
Total material yield variance.
(Standard Quantity — Revised Standard Quantity)× Standard Price
Particulars Standard
Quantity
Revised
Standard
Quantity
Quantitative
Difference
Standard
Rate/kg
Variance
Alpha 1840 1873.33 33.33 (A) 2 66.66 (A)
Beta 2760 2810 50 (A) 5 250 (A)
Gamma 920 936.67 16.67 (A) 1 16.67 (A)
Total 5520 5620 333.33 (A)
PART 2
Standard costing is a practise of substitute cost of expected cost for an actual cost in the
accounting records. It is a difference between expected and actual cost (Fliedner, G., 2018).
The report of raw material price variance are mostly out of control of production manager
control and more of Purchasing manager are responsible. Here production manager had no
involvement of setting standard mix. Production manager had no appearance in the planning
variance. Quality and price of materials are volatile using before price and usage standard and
provide contorted view of yield and mix variance. Decreasing in non isolated planning variance
are demotivated.
The standard mix of product are not changed in five-year instead of change in price and
quality of products. It helps production manager to control action on variance calculated from
standard. However, kappa company is not accessing the required importance towards the various
variance occurred. It leads to production manager over sighting the higher cost incurred which
was not healthy towards the performance of kappa co. The manager will not be motivated
towards control in cost to satisfy and affect the company adversely. In the above calculations the
overall usage of variance shows at 580 favourable which show the good performance of the
company. If, the usage of variance is taken in more details through yield and mix variance, it
seen that mix had been changed. It shows the direct relationship between the material mix and
material yield variance by applying mix material which is different from standard.
Q.3
Zero based budgeting is applied from the zero level i.e. from scratch. It is the method
where expenses are need to be justified for new period. The starting of the process is done
through zero based and every function is analysed for need and cost. The previous year revenue
is assumed to be zero and compute the cost which are included in the all products to know the
cost involved. Incremental Budgeting refers to incremental increases occurred on the previous
budgets with increase in spending (Wegmann, G., 2019). This budget analysis only new
expenditure and budget is prepared on the basis of actual performance of the company.
Zero based budgeting also had merit and demerit in the methods:
Merits
The incremental budgeting is useful because it promotes the accuracy to estimate forecast
and help to solve grievances of different departments of require funds.
The method is rigid which help management to make the friendly budget and strict
guidelines to address. The line approach is a long process but help to assess in current
demand of product for their budgets (Hughes, P., 2020). It helps company to spend on product category wise which gives good return.
Demerits
Zero based budgeting is subjective in nature to calculate each expense while it is not easy
to calculate each one of them. This approach may help in short run only and cannot be
taken for long run by the company.
There is a rigidity in the budget where it makes company to stick on the one budget for
longer period. Also, incremental budgeting allow company to change only few changes
with the changing situation (brahim, M.M., 2019).
⊘ This is a preview!⊘
Do you want full access?
Subscribe today to unlock all pages.
Trusted by 1+ million students worldwide
Zero based budgeting is long and time-consuming process as every line of various
product category are been assessed and incremental budgeting does not calculate
complex calculations.
It is been required of managerial training for zero based budgeting implementation and it
takes time and cost of company. The staff is need to be trained to use these methods.
Traditional budget cannot consider the changing market factors and does not take future
change which may occurred.
Paraphrase This Document
Need a fresh take? Get an instant paraphrase of this document with our AI Paraphraser
REFERENCES
Books and journals
Akeem, L.B., 2017. Effect of cost control and cost reduction techniques in organizational
performance. International business and management. 14(3). pp.19-26.
Bariska, M., Pásztory, Z. and Koloszár, L., 2019. The Efficiency Based Costing Method–Using a
Sawmill as Example. EUROPEAN RESEARCH STUDIES: AN INTERNATIONAL
MULTIDISCIPLINARY JOURNAL WITH TOPICS IN EUROPEAN INTEGRATION. 22(2),
pp.229-243.
Fliedner, G., 2018. Lean Accounting: Current State and Future Needs Assessment. Journal of
Accounting & Finance (2158-3625). 18(3).
Hughes, P., 2020. Discover the power of zero-based budgeting. Farmer’s Weekly, 2020(20032),
pp.30-30.
Ibrahim, M.M., 2019. Designing zero-based budgeting for public organizations. Problems and
Perspectives in Management. 17(2).
Malagatti, V.D., 2020. Costing for the Service Industry. Cambridge Scholars Publishing.
Wegmann, G., 2019. A typology of cost accounting practices based on Activity-Based Costing-a
strategic cost management approach. Asia-Pacific Management Accounting Journal. 14. pp.161-
184.
Online
[Online]. Available through: <>
1

2
⊘ This is a preview!⊘
Do you want full access?
Subscribe today to unlock all pages.
Trusted by 1+ million students worldwide
1 out of 12
Related Documents


Your All-in-One AI-Powered Toolkit for Academic Success.
+13062052269
info@desklib.com
Available 24*7 on WhatsApp / Email
![[object Object]](/_next/static/media/star-bottom.7253800d.svg)
Unlock your academic potential
Copyright © 2020–2026 A2Z Services. All Rights Reserved. Developed and managed by ZUCOL.