Financial Analysis Report: ABR Holdings vs Pavilion Holdings - Finance
VerifiedAdded on 2021/04/16
|30
|4647
|40
Report
AI Summary
This report presents a comprehensive financial analysis comparing ABR Holdings Ltd and Pavilion Holdings Ltd. The analysis includes a SWOT analysis, assessing their strengths, weaknesses, opportunities, and threats. Ratio analysis is performed to evaluate liquidity, profitability, capital structure, and efficiency. Vertical and horizontal analyses are conducted to examine financial statement trends and relationships. The cash flow statements of both companies are also evaluated to understand their cash inflows and outflows. Segment analysis is undertaken to identify revenue generation from different segments. The report concludes with recommendations based on the financial performance of both companies, highlighting their strengths and weaknesses. The analysis reveals that while ABR Holdings demonstrates better profitability and capital structure, Pavilion Holdings exhibits greater efficiency in resource management. The report provides a detailed comparison of their financial positions, helping to understand their performance and potential for future growth.
Running Head: Financial Analysis
Financial Analysis
Financial Analysis
Paraphrase This Document
Need a fresh take? Get an instant paraphrase of this document with our AI Paraphraser
Financial Analysis 2
Table of Contents
Introduction:.......................................................................................................... 3
SWOT Analysis:...................................................................................................... 4
Ratio Analysis:....................................................................................................... 6
Vertical and Horizontal Analysis:...........................................................................9
Cash flow Analysis............................................................................................... 11
Segment analysis................................................................................................ 12
Recommendation and conclusion........................................................................13
References........................................................................................................... 14
Appendix.............................................................................................................. 16
Financial Analysis 3
Introduction:
Financial analysis means analysing and evaluating the books of accounts and financial
statements of a company y. financial analysis can be done company wise or for comparing
the financial results of one company with other company or for comparing the financial
statements of any company segment wise. Financial analysis is border in its concept and
includes analysis on the basis of intercompany analysis or intra company analysis.
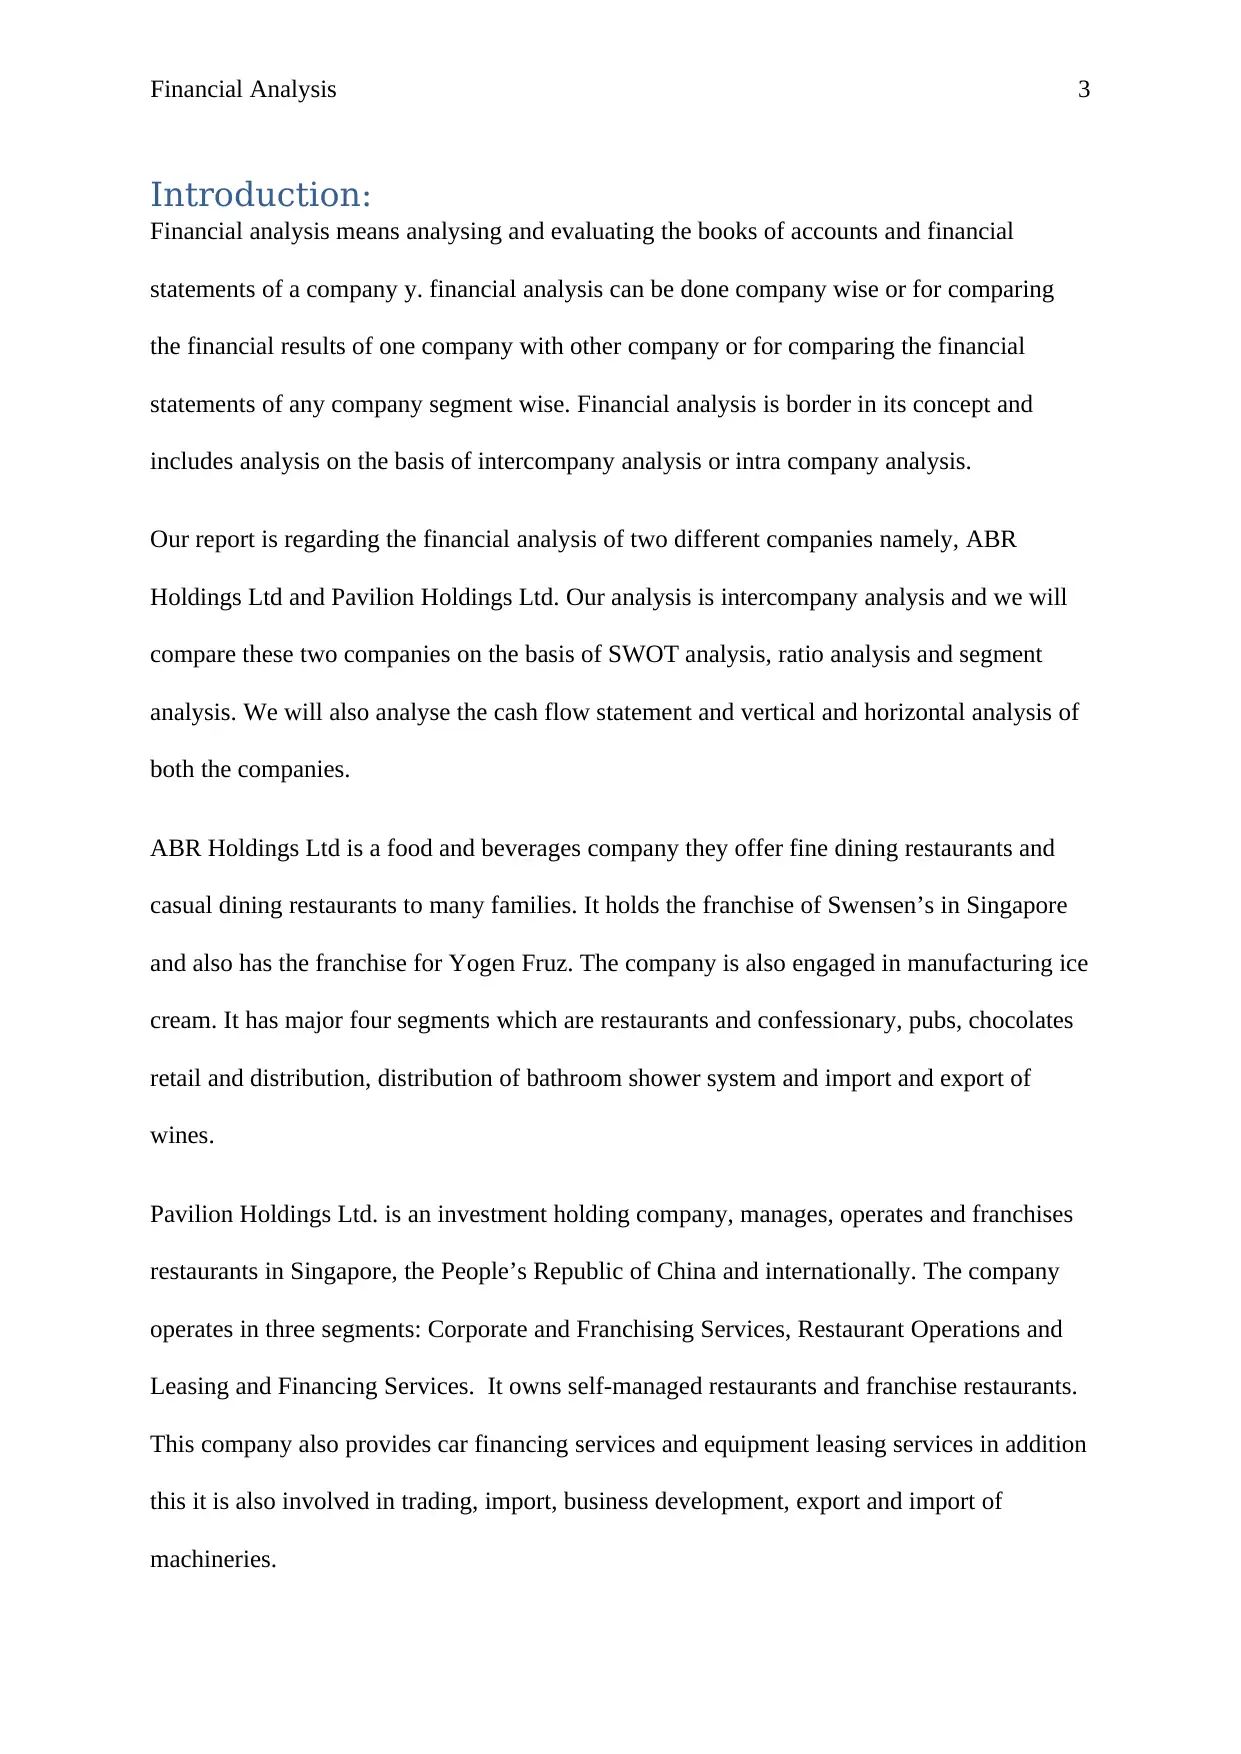
Our report is regarding the financial analysis of two different companies namely, ABR
Holdings Ltd and Pavilion Holdings Ltd. Our analysis is intercompany analysis and we will
compare these two companies on the basis of SWOT analysis, ratio analysis and segment
analysis. We will also analyse the cash flow statement and vertical and horizontal analysis of
both the companies.
ABR Holdings Ltd is a food and beverages company they offer fine dining restaurants and
casual dining restaurants to many families. It holds the franchise of Swensen’s in Singapore
and also has the franchise for Yogen Fruz. The company is also engaged in manufacturing ice
cream. It has major four segments which are restaurants and confessionary, pubs, chocolates
retail and distribution, distribution of bathroom shower system and import and export of
wines.
Pavilion Holdings Ltd. is an investment holding company, manages, operates and franchises
restaurants in Singapore, the People’s Republic of China and internationally. The company
operates in three segments: Corporate and Franchising Services, Restaurant Operations and
Leasing and Financing Services. It owns self-managed restaurants and franchise restaurants.
This company also provides car financing services and equipment leasing services in addition
this it is also involved in trading, import, business development, export and import of
machineries.
Introduction:
Financial analysis means analysing and evaluating the books of accounts and financial
statements of a company y. financial analysis can be done company wise or for comparing
the financial results of one company with other company or for comparing the financial
statements of any company segment wise. Financial analysis is border in its concept and
includes analysis on the basis of intercompany analysis or intra company analysis.
Our report is regarding the financial analysis of two different companies namely, ABR
Holdings Ltd and Pavilion Holdings Ltd. Our analysis is intercompany analysis and we will
compare these two companies on the basis of SWOT analysis, ratio analysis and segment
analysis. We will also analyse the cash flow statement and vertical and horizontal analysis of
both the companies.
ABR Holdings Ltd is a food and beverages company they offer fine dining restaurants and
casual dining restaurants to many families. It holds the franchise of Swensen’s in Singapore
and also has the franchise for Yogen Fruz. The company is also engaged in manufacturing ice
cream. It has major four segments which are restaurants and confessionary, pubs, chocolates
retail and distribution, distribution of bathroom shower system and import and export of
wines.
Pavilion Holdings Ltd. is an investment holding company, manages, operates and franchises
restaurants in Singapore, the People’s Republic of China and internationally. The company
operates in three segments: Corporate and Franchising Services, Restaurant Operations and
Leasing and Financing Services. It owns self-managed restaurants and franchise restaurants.
This company also provides car financing services and equipment leasing services in addition
this it is also involved in trading, import, business development, export and import of
machineries.
⊘ This is a preview!⊘
Do you want full access?
Subscribe today to unlock all pages.
Trusted by 1+ million students worldwide
Financial Analysis 4
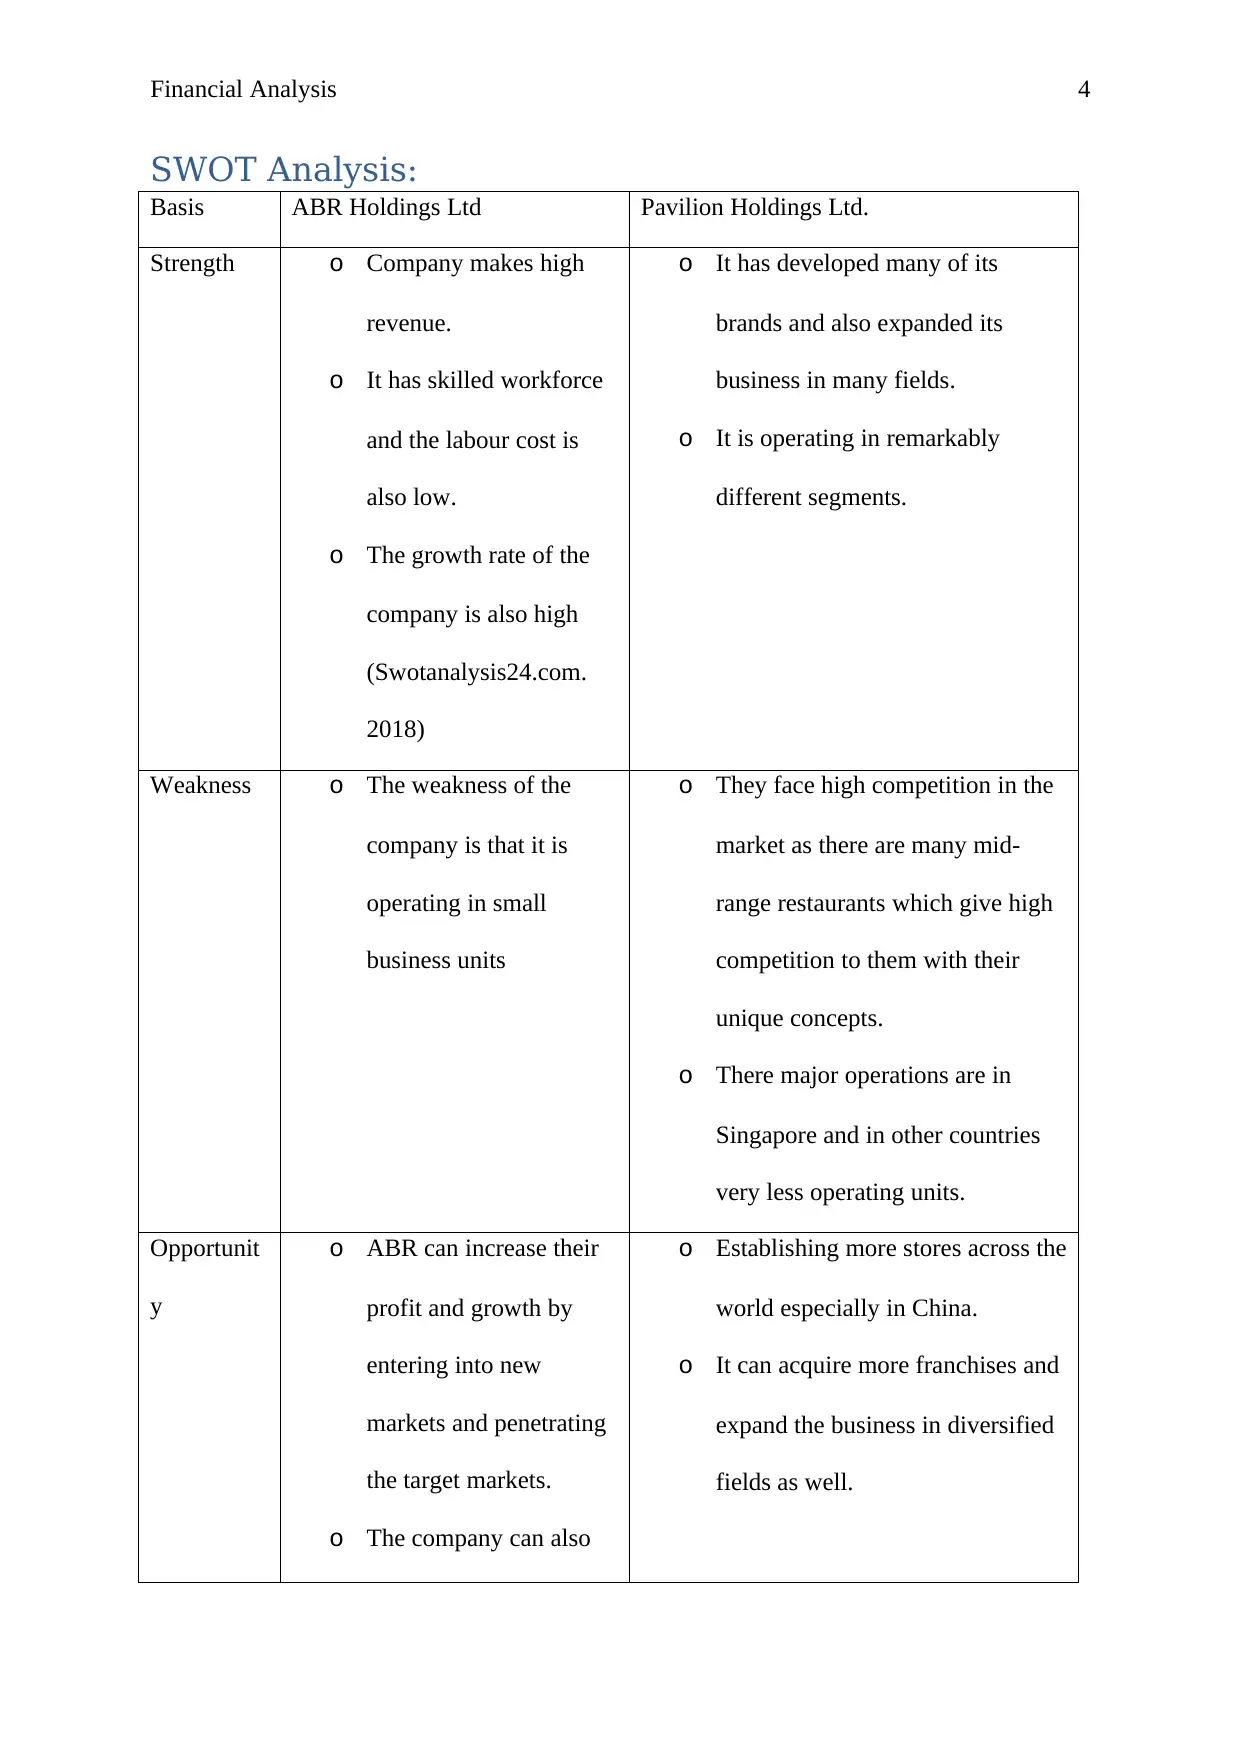
SWOT Analysis:
Basis ABR Holdings Ltd Pavilion Holdings Ltd.
Strength o Company makes high
revenue.
o It has skilled workforce
and the labour cost is
also low.
o The growth rate of the
company is also high
(Swotanalysis24.com.
2018)
o It has developed many of its
brands and also expanded its
business in many fields.
o It is operating in remarkably
different segments.
Weakness o The weakness of the
company is that it is
operating in small
business units
o They face high competition in the
market as there are many mid-
range restaurants which give high
competition to them with their
unique concepts.
o There major operations are in
Singapore and in other countries
very less operating units.
Opportunit
y
o ABR can increase their
profit and growth by
entering into new
markets and penetrating
the target markets.
o The company can also
o Establishing more stores across the
world especially in China.
o It can acquire more franchises and
expand the business in diversified
fields as well.
Paraphrase This Document
Need a fresh take? Get an instant paraphrase of this document with our AI Paraphraser
Financial Analysis 5
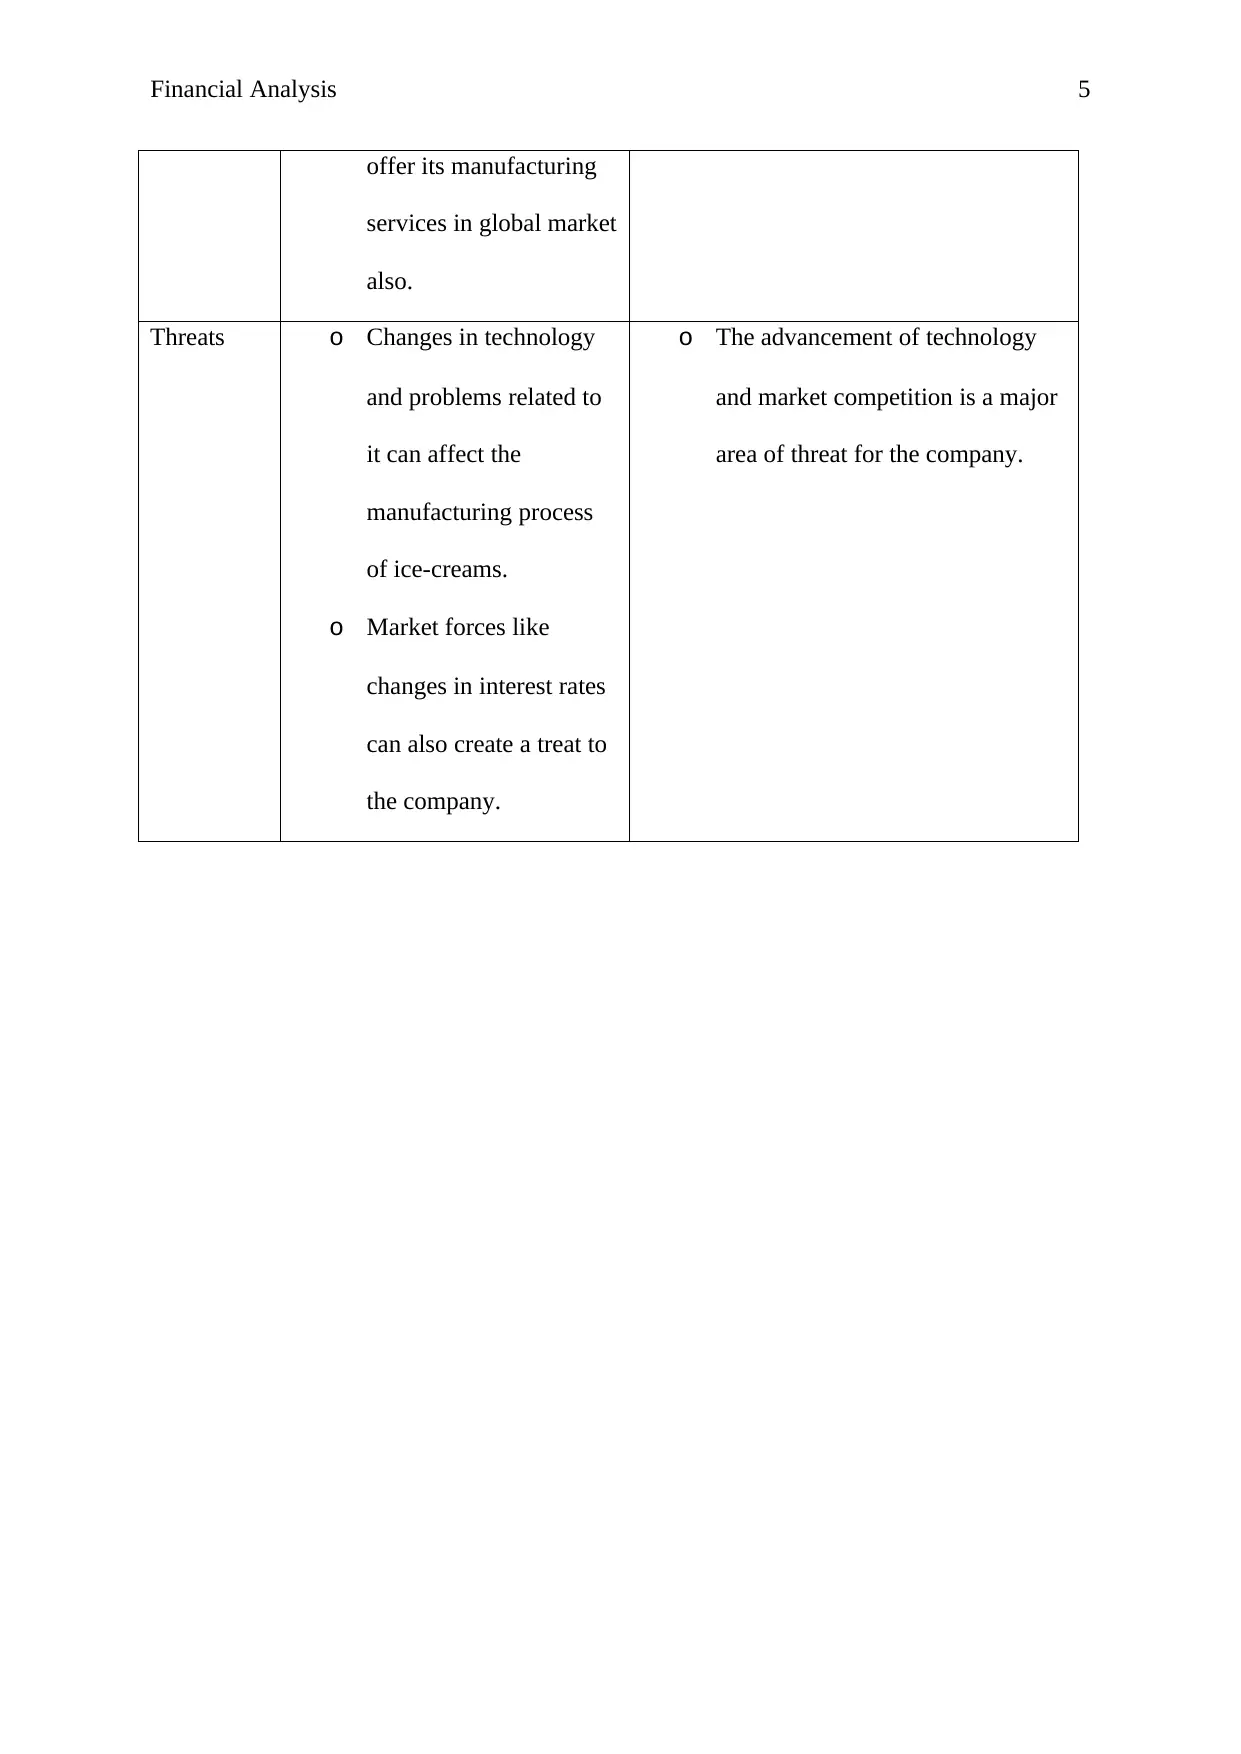
offer its manufacturing
services in global market
also.
Threats o Changes in technology
and problems related to
it can affect the
manufacturing process
of ice-creams.
o Market forces like
changes in interest rates
can also create a treat to
the company.
o The advancement of technology
and market competition is a major
area of threat for the company.
Financial Analysis 6
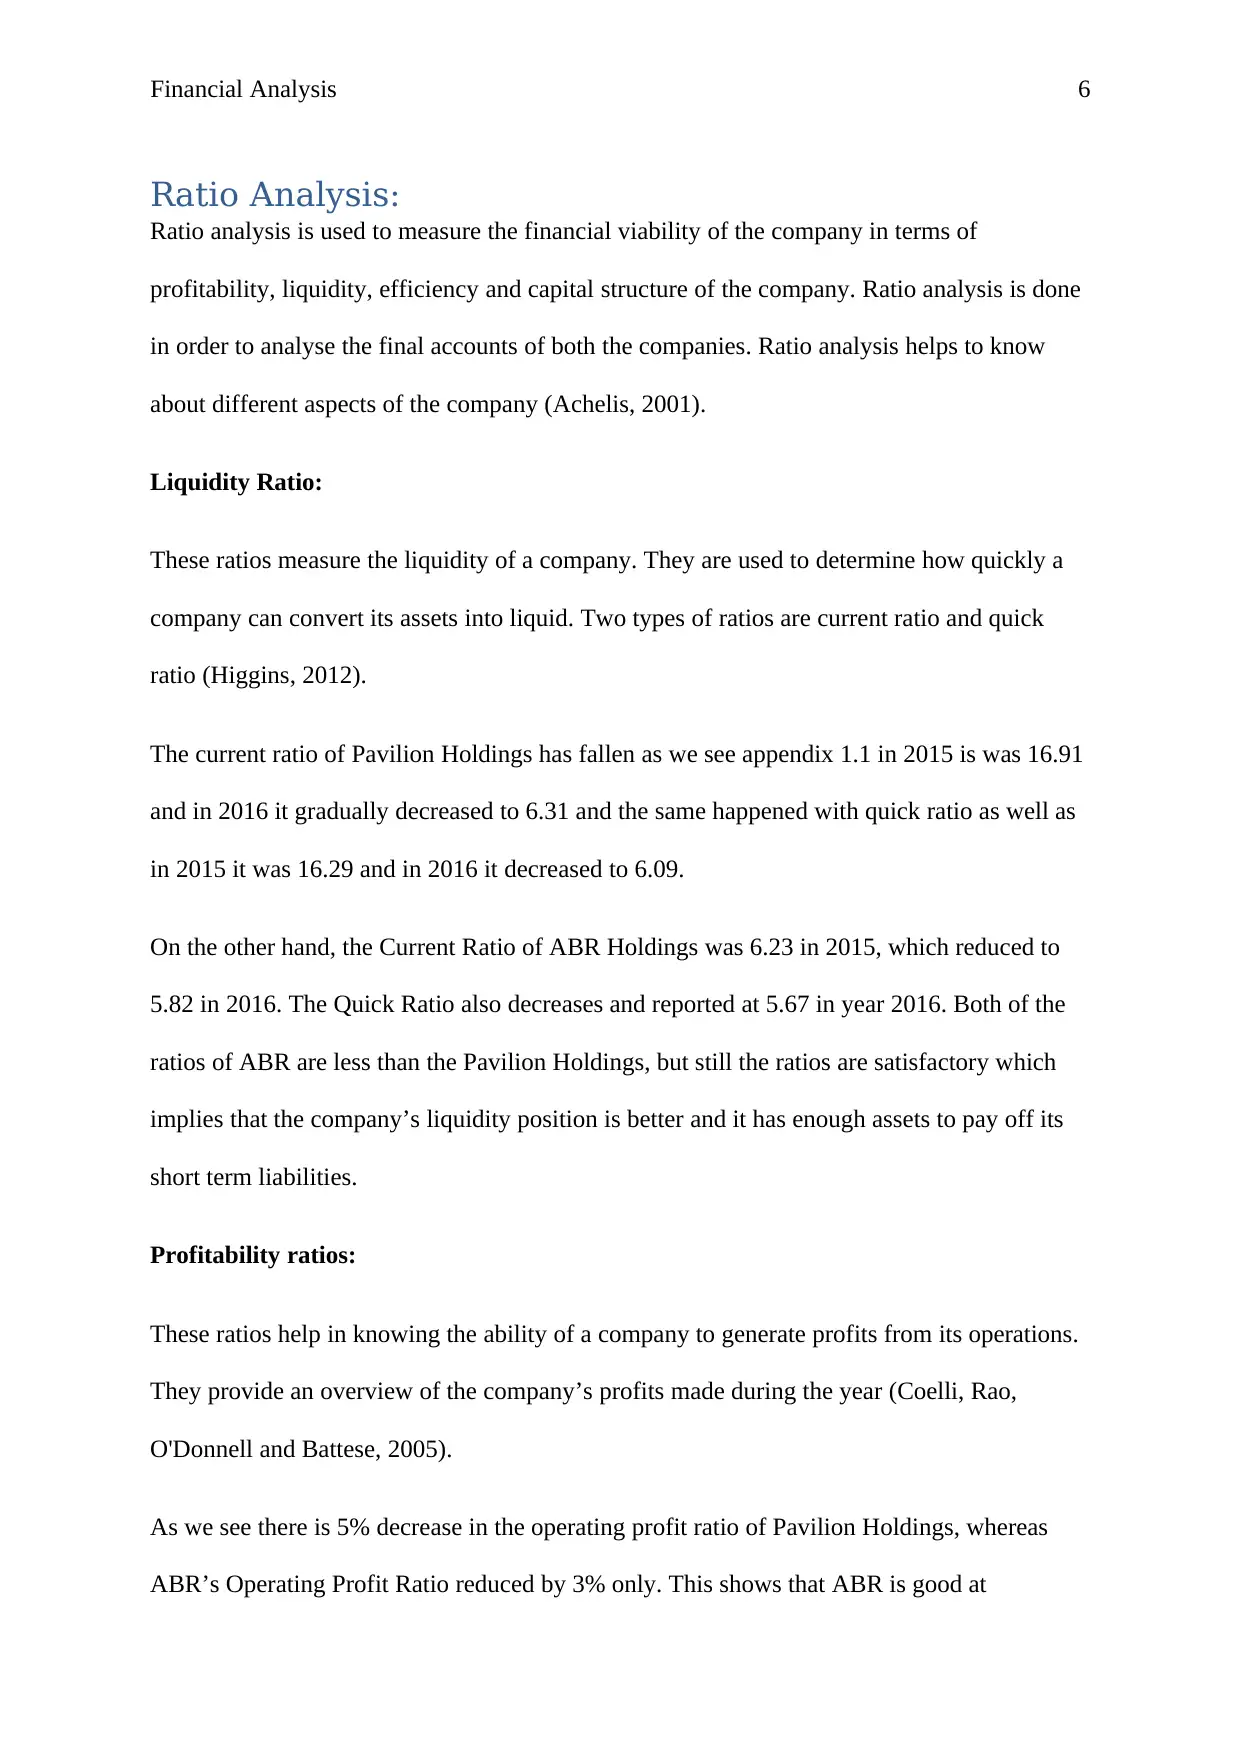
Ratio Analysis:
Ratio analysis is used to measure the financial viability of the company in terms of
profitability, liquidity, efficiency and capital structure of the company. Ratio analysis is done
in order to analyse the final accounts of both the companies. Ratio analysis helps to know
about different aspects of the company (Achelis, 2001).
Liquidity Ratio:
These ratios measure the liquidity of a company. They are used to determine how quickly a
company can convert its assets into liquid. Two types of ratios are current ratio and quick
ratio (Higgins, 2012).
The current ratio of Pavilion Holdings has fallen as we see appendix 1.1 in 2015 is was 16.91
and in 2016 it gradually decreased to 6.31 and the same happened with quick ratio as well as
in 2015 it was 16.29 and in 2016 it decreased to 6.09.
On the other hand, the Current Ratio of ABR Holdings was 6.23 in 2015, which reduced to
5.82 in 2016. The Quick Ratio also decreases and reported at 5.67 in year 2016. Both of the
ratios of ABR are less than the Pavilion Holdings, but still the ratios are satisfactory which
implies that the company’s liquidity position is better and it has enough assets to pay off its
short term liabilities.
Profitability ratios:
These ratios help in knowing the ability of a company to generate profits from its operations.
They provide an overview of the company’s profits made during the year (Coelli, Rao,
O'Donnell and Battese, 2005).
As we see there is 5% decrease in the operating profit ratio of Pavilion Holdings, whereas
ABR’s Operating Profit Ratio reduced by 3% only. This shows that ABR is good at
⊘ This is a preview!⊘
Do you want full access?
Subscribe today to unlock all pages.
Trusted by 1+ million students worldwide
Financial Analysis 7
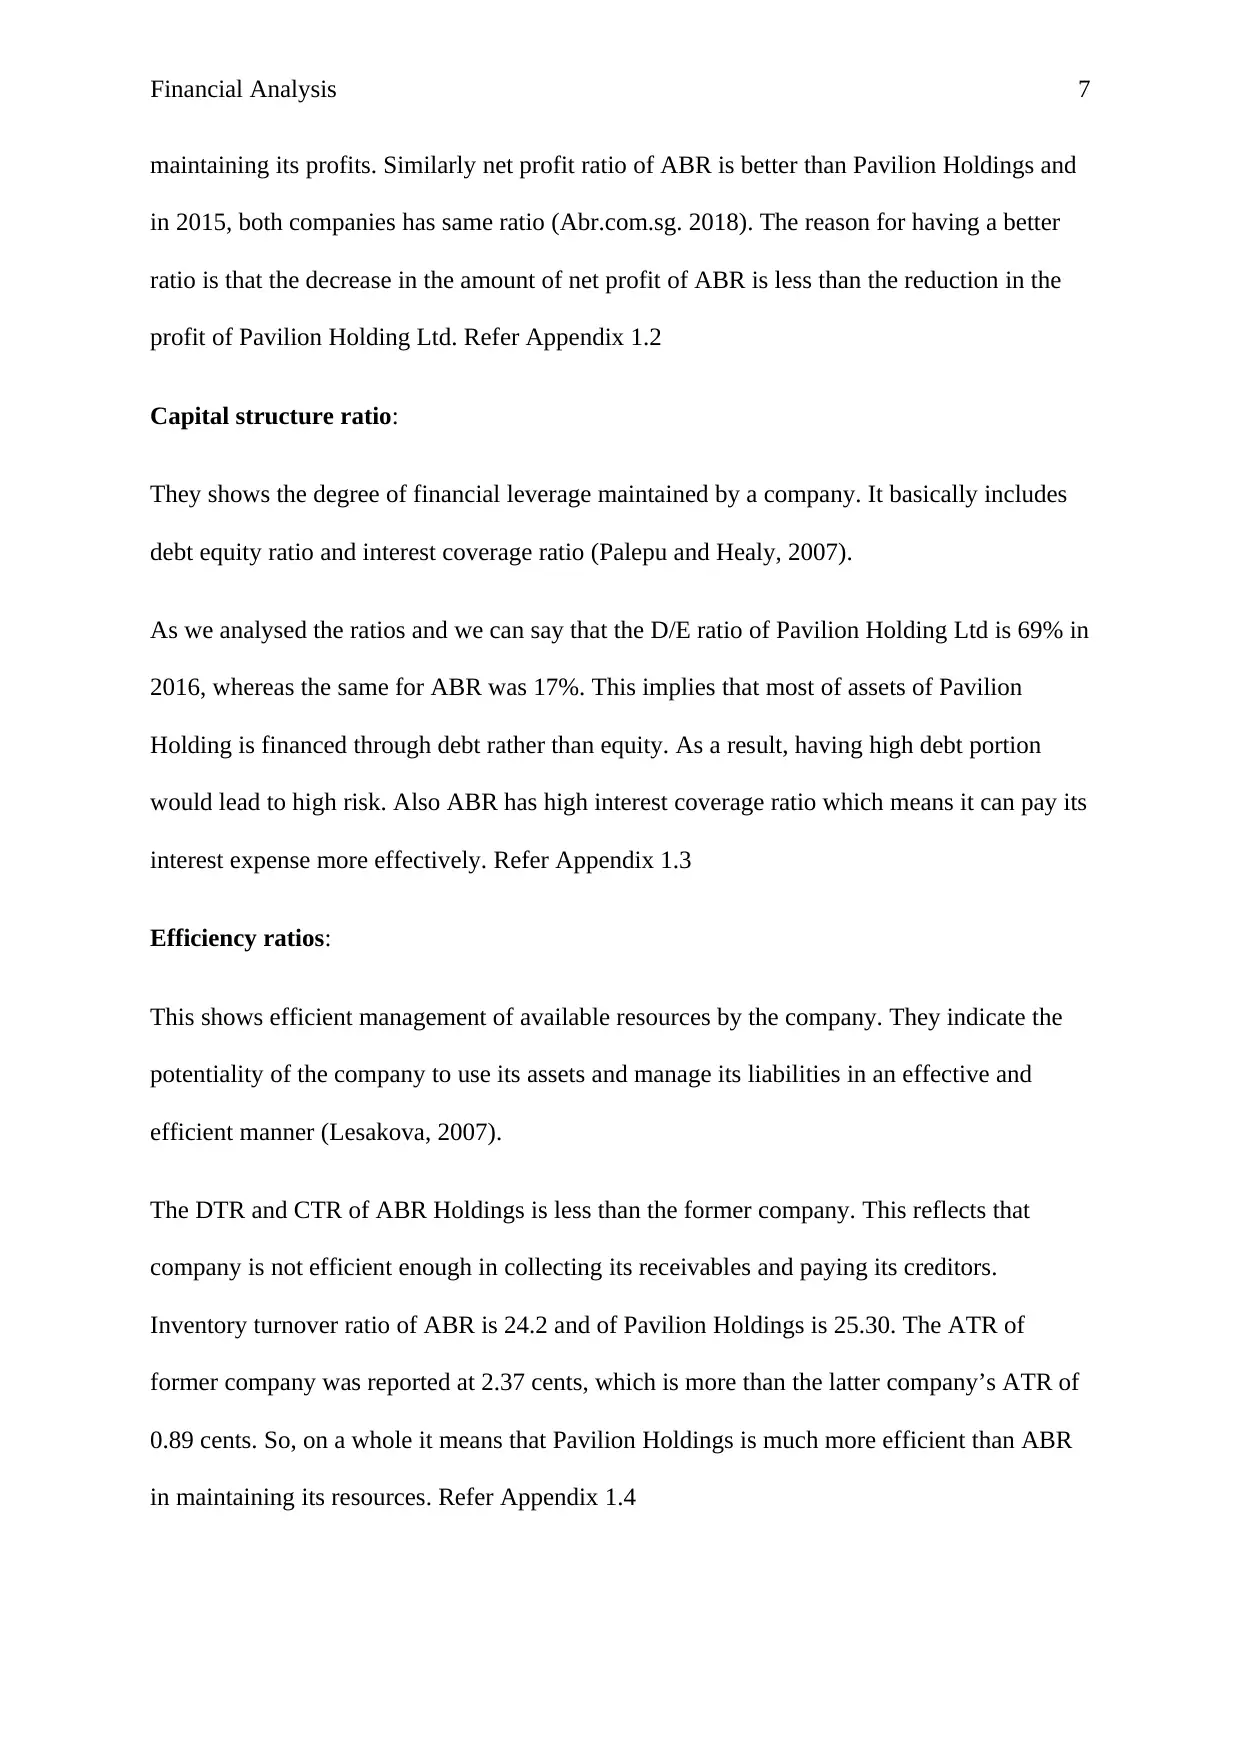
maintaining its profits. Similarly net profit ratio of ABR is better than Pavilion Holdings and
in 2015, both companies has same ratio (Abr.com.sg. 2018). The reason for having a better
ratio is that the decrease in the amount of net profit of ABR is less than the reduction in the
profit of Pavilion Holding Ltd. Refer Appendix 1.2
Capital structure ratio:
They shows the degree of financial leverage maintained by a company. It basically includes
debt equity ratio and interest coverage ratio (Palepu and Healy, 2007).
As we analysed the ratios and we can say that the D/E ratio of Pavilion Holding Ltd is 69% in
2016, whereas the same for ABR was 17%. This implies that most of assets of Pavilion
Holding is financed through debt rather than equity. As a result, having high debt portion
would lead to high risk. Also ABR has high interest coverage ratio which means it can pay its
interest expense more effectively. Refer Appendix 1.3
Efficiency ratios:
This shows efficient management of available resources by the company. They indicate the
potentiality of the company to use its assets and manage its liabilities in an effective and
efficient manner (Lesakova, 2007).
The DTR and CTR of ABR Holdings is less than the former company. This reflects that
company is not efficient enough in collecting its receivables and paying its creditors.
Inventory turnover ratio of ABR is 24.2 and of Pavilion Holdings is 25.30. The ATR of
former company was reported at 2.37 cents, which is more than the latter company’s ATR of
0.89 cents. So, on a whole it means that Pavilion Holdings is much more efficient than ABR
in maintaining its resources. Refer Appendix 1.4
Paraphrase This Document
Need a fresh take? Get an instant paraphrase of this document with our AI Paraphraser

Financial Analysis 8
Financial Analysis 9
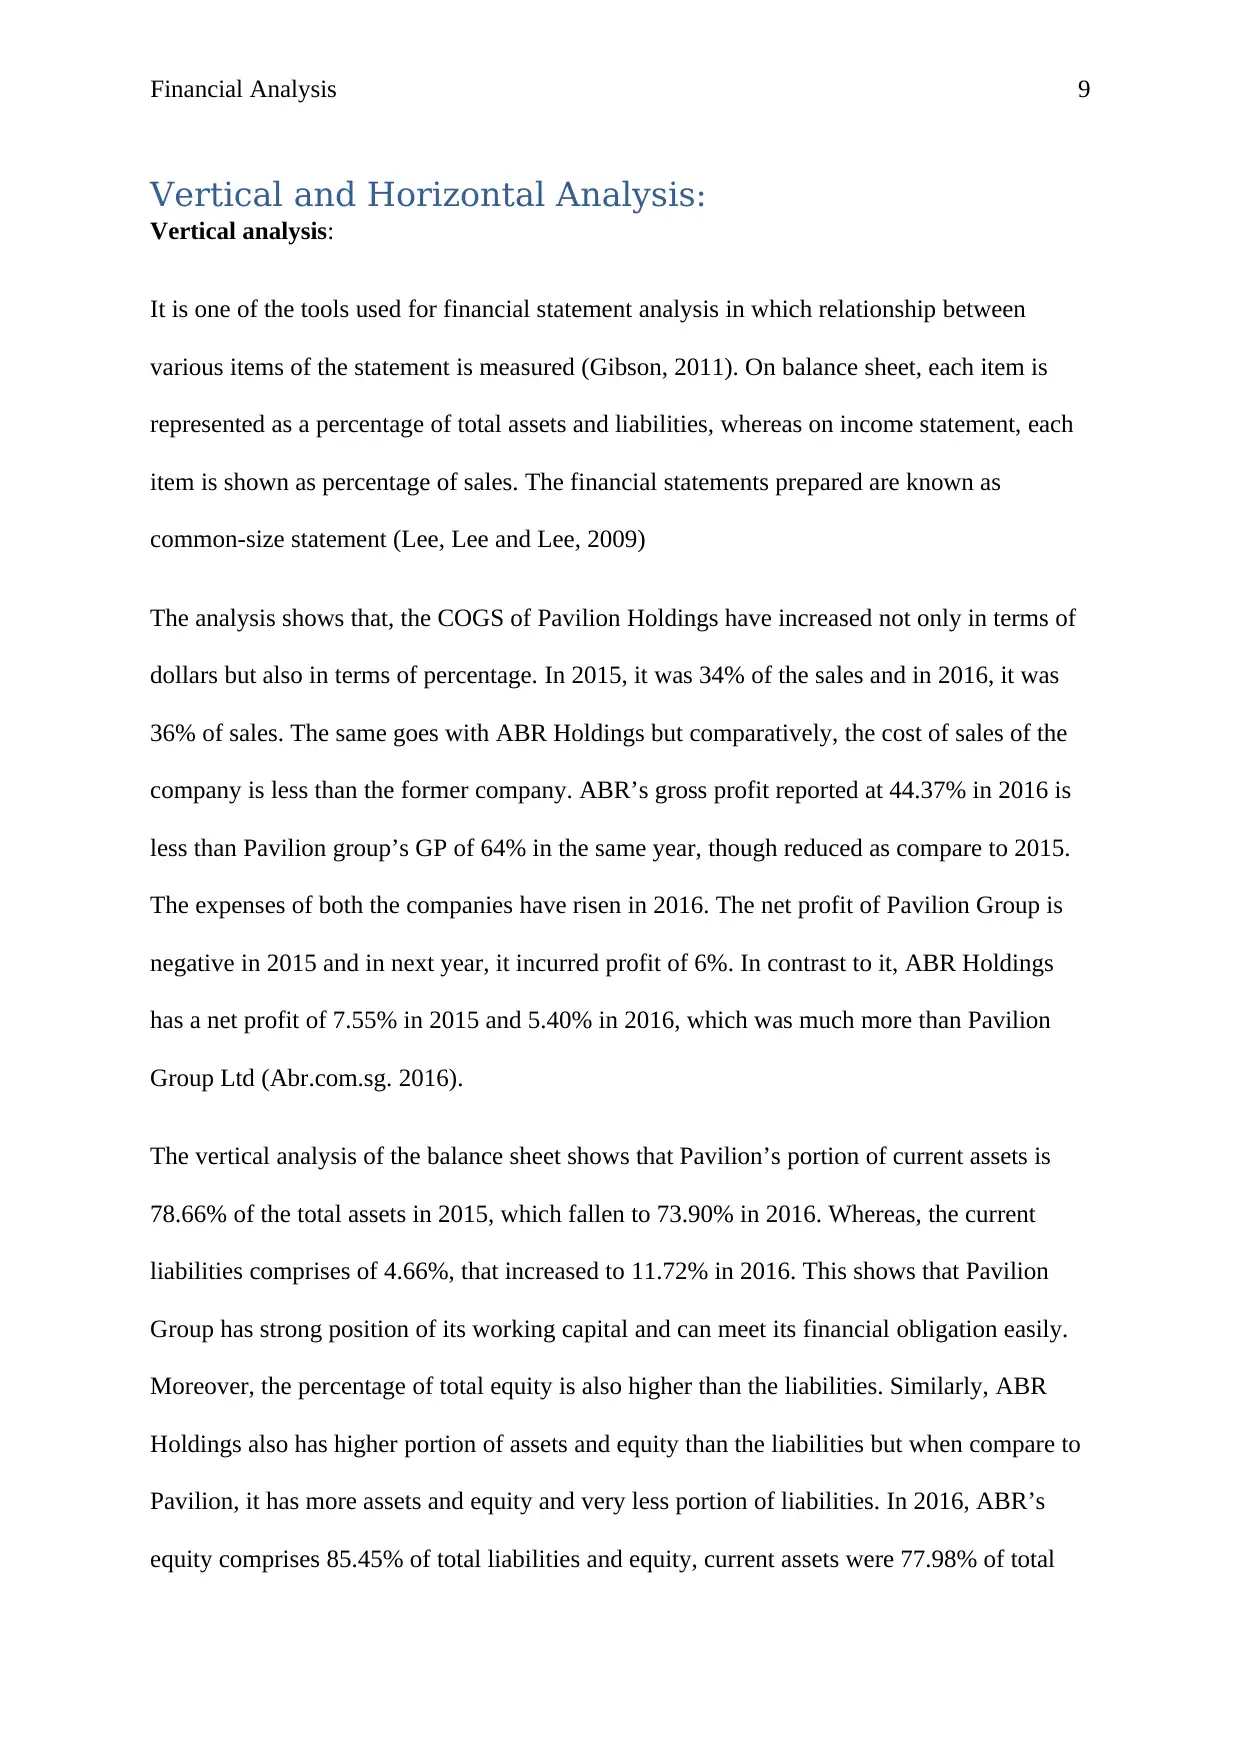
Vertical and Horizontal Analysis:
Vertical analysis:
It is one of the tools used for financial statement analysis in which relationship between
various items of the statement is measured (Gibson, 2011). On balance sheet, each item is
represented as a percentage of total assets and liabilities, whereas on income statement, each
item is shown as percentage of sales. The financial statements prepared are known as
common-size statement (Lee, Lee and Lee, 2009)
The analysis shows that, the COGS of Pavilion Holdings have increased not only in terms of
dollars but also in terms of percentage. In 2015, it was 34% of the sales and in 2016, it was
36% of sales. The same goes with ABR Holdings but comparatively, the cost of sales of the
company is less than the former company. ABR’s gross profit reported at 44.37% in 2016 is
less than Pavilion group’s GP of 64% in the same year, though reduced as compare to 2015.
The expenses of both the companies have risen in 2016. The net profit of Pavilion Group is
negative in 2015 and in next year, it incurred profit of 6%. In contrast to it, ABR Holdings
has a net profit of 7.55% in 2015 and 5.40% in 2016, which was much more than Pavilion
Group Ltd (Abr.com.sg. 2016).
The vertical analysis of the balance sheet shows that Pavilion’s portion of current assets is
78.66% of the total assets in 2015, which fallen to 73.90% in 2016. Whereas, the current
liabilities comprises of 4.66%, that increased to 11.72% in 2016. This shows that Pavilion
Group has strong position of its working capital and can meet its financial obligation easily.
Moreover, the percentage of total equity is also higher than the liabilities. Similarly, ABR
Holdings also has higher portion of assets and equity than the liabilities but when compare to
Pavilion, it has more assets and equity and very less portion of liabilities. In 2016, ABR’s
equity comprises 85.45% of total liabilities and equity, current assets were 77.98% of total
⊘ This is a preview!⊘
Do you want full access?
Subscribe today to unlock all pages.
Trusted by 1+ million students worldwide
Financial Analysis 10
assets and current liabilities were only 13.39% of total liabilities. This implies that, ABR is
better at maintaining its capital structure and meeting its short term and long term obligations.
Refer Appendix 1.5
Horizontal analysis:
It measures year to year change in each and every item of financial statement. The change is
determined in the terms, dollar and percentage by taking one year as a base. In other words,
the analysis shows increase or decrease in the items of statement (Sharan, 2015).
Referring to Appendix 1.6, in income statement, the revenue of Pavilion Group has been
increased by $2204 and 16.54% in 2016 along with the increase in gross profit of $1143 and
13.04%. In contrary to this, revenue of ABR has increased by $3514 and 3.5% with a rise of
0.1% in gross profit. But in terms of amount, revenue and GP of ABR is much more than
Pavilion Group. The net profit of both the companies has reduced in 2016 but comparatively,
the decrease in the profit of ABR is less than that of in the profit of Pavilion Group Ltd. So
overall, it can be said that, though the change in the revenue earned by ABR is less but the
company is making profits which are more than Pavilion Group.
The analysis on the balance sheet shows that, former company’s total assets decreases by
$644 which is less than the increase in the total assets of latter company that is $1815. The
total liabilities of Pavilion group have increased by 29.24%, whereas in case of ABR, same
has risen by 6.25%. Moreover, an increase of 0.82% is been noticed in the total equity of
ABR Holdings as compare to Pavilion Group. This reflects that, the financial position of
ABR Holdings is better than Pavilion Group Ltd, because of high percentage of assets and
equity and less debt.
Paraphrase This Document
Need a fresh take? Get an instant paraphrase of this document with our AI Paraphraser
Financial Analysis 11
Cash flow Analysis
Cash flow statement shows the inflow and outflow of the cash in the business (Weygandt,
Kimmel and Kieso, 2009). In Appendix 1.7, the cash flow statements of both the companies
are analysed. In year 2016, ABR has generated more cash from its operations than Pavilion,
amounted to $9376, though less than that of in 2015. This is because the changes in working
capital of the company are comparatively less, creditors has increased which leads to the
inflow of cash in the business. Talking about investing activities, Pavilion only has cash
outflow of $2016 and $602 for the purpose of purchasing property and acquiring shares. On
the other hand, major cash outflow in ABR’s investing activities was in purchase of property
amounted to $5839 in 2016. This resulted in net cash used worth $5074, which is more than
that of Pavilion group. Similarly, in financing activities, ABR and Pavilion group has more
cash outflow than inflow. But comparatively, the net cash used in the financing activities of
Pavilion group Ltd, is less than ABR because of its gross proceeds from IPO worth $7518.
This overall analysis shows that, the former company is slightly more effective and efficient
in managing its cash position than the latter company (Jury, 2012).
Financial Analysis 12
Segment analysis
The analysis of each and every segment of the companies is done. The revenue generated
from the segments is determined. Referring to Appendix 1.8, Pavilion’s most of the revenue
is generated from Singapore amounted to $54,941 and the non-current assets used are worth
$6,798 .On the other hand, ABR has its revenue mostly form Singapore and Malaysia
amounted to $89,611 and $14,239 respectively. Also its Non-current assets are in the same
countries worth $20,828 and $4,866. This shows that segments of ABR produces more
revenue than Pavilion Group Ltd., reason being the company not only operates in Singapore
but also in Malaysia and rest of the Asia.
⊘ This is a preview!⊘
Do you want full access?
Subscribe today to unlock all pages.
Trusted by 1+ million students worldwide
1 out of 30


Your All-in-One AI-Powered Toolkit for Academic Success.
+13062052269
info@desklib.com
Available 24*7 on WhatsApp / Email
![[object Object]](/_next/static/media/star-bottom.7253800d.svg)
Unlock your academic potential
Copyright © 2020–2026 A2Z Services. All Rights Reserved. Developed and managed by ZUCOL.