ATMC ACC701 Semester 2 2019: Financial Analysis Report of Breville
VerifiedAdded on 2022/12/23
|19
|3597
|58
Report
AI Summary
This report presents a comprehensive financial analysis of Breville Group Limited, an Australian-based home appliance manufacturer. The analysis employs financial ratios, trend analysis, and common-size balance sheet analysis to assess the company's financial health. Key areas of focus include liquidity, solvency, profitability, and efficiency ratios, with a comparative analysis against Whirlpool Limited. The report examines current ratios, cash flow operation ratios, gross and net profit margins, and return on equity, providing insights into Breville's performance and financial position over a five-year period. The analysis highlights Breville's stable liquidity and profitability compared to its competitor, leading to conclusions and recommendations regarding the company's financial strategy and future outlook.
Running head: ANALYSIS OF FINANCIALS
Analysis of Financials
Name of the Student:
Name of the University:
Author Note:
Analysis of Financials
Name of the Student:
Name of the University:
Author Note:
Paraphrase This Document
Need a fresh take? Get an instant paraphrase of this document with our AI Paraphraser
1ANALYSIS OF FINANCIALS
Executive Summary:
The financial analysis of a company is important in understanding its long term viability and
any problems which can arise in future. The financial analysis of the company helps it to
understand certain situation which the company is probably going to face in the future and it
can create some contingency plan to avoid the same. The ratio analysis of a company is
helpful to understand the level of operation of the company and the company has a weaker
performance in which aspect. These ratio can then be compared to an industry average or a
competing peer company in the same industry and compare the result of our target company.
The trend analysis also helps to understand the trend which the company had been following
for years and a forecast on the future trend can be made by analysing the past. The common
size balance sheet helps to understand changes in items in the balance sheet over years which
have an effect on the overall profitability of the company. The company Breville Group
Limited, a company which manufactures kitchen supplies is taken for the purpose of financial
analysis. All the three analysis techniques are used to determine the financial position and a
conclusion is made at the end of the report along with recommendation. Whirlpool limited is
taken as a competing peer firm for the purpose of the analysis.
2ANALYSIS OF FINANCIALS
Table of Contents
Introduction:...............................................................................................................................3
Discussion:.................................................................................................................................3
Financial Ratio and Trend Analysis:......................................................................................3
Liquidity Ratio:..................................................................................................................4
Profitability Ratio:..............................................................................................................7
Efficiency Ratio:..............................................................................................................12
Solvency Ratio:................................................................................................................14
Common Size Balance Sheet Analysis:...............................................................................15
Conclusion:..............................................................................................................................15
Recommendation:....................................................................................................................16
References and Bibliographies:................................................................................................17
⊘ This is a preview!⊘
Do you want full access?
Subscribe today to unlock all pages.
Trusted by 1+ million students worldwide
3ANALYSIS OF FINANCIALS
Introduction:
The following assessment is based upon the study of the financial statements of
Breville Group Limited, a home appliance manufacturer based in Australia. The financial
statements of the company like the balance sheet, statement of income and the statement of
cash flow of the company are used for the purpose of the analysis. The financial ratio of the
company like liquidity, solvency, profitability and efficiency ratio are analysed for the
purpose of this report. The trend analysis is conducted of the financial statements along with
the preparation of a common size financial statements is prepared to understand the effects of
the economy on the company. The financial ratio are compared to the benchmark company
whirlpool limited to understand the current position of the company focused which is the
Breville Group limited.
This analysis is subjective and is based on a few financial ratio and the common size
financial statements. The scope of this analysis is limited to the relevant ratio calculated for
the purpose of this report.
Discussion:
Financial Ratio and Trend Analysis:
Financial ratio are a measure to understand the current financial health of the
company and the effect of certain factors which had an effect on the financial reports of the
company. The liquidity ratio shows and evaluates the current short term financial position of
the company and its ability to meet its liabilities in the near future. The solvency ratio is an
indicator of the leverage taken by the company for its business purpose and shows the risk
faced by the equity shareholders of the company who have a direct stake in the operations of
the company (Eckert, Hüsler, Liniger and Hodel 2015). The profitability ratio are an indicator
Paraphrase This Document
Need a fresh take? Get an instant paraphrase of this document with our AI Paraphraser
4ANALYSIS OF FINANCIALS
of the return which is earned by the company for its stakeholders after meeting all the
relevant expenses of the company. The efficiency ratio shows how the company utilizes its
assets in its business operation and generate return for the relevant stakeholders of the
company. It measure the level of efficiency at which the company is able to use the resources
which it has in its hand (Zainudin and Hashim 2016).
Ratio of Liquidity:
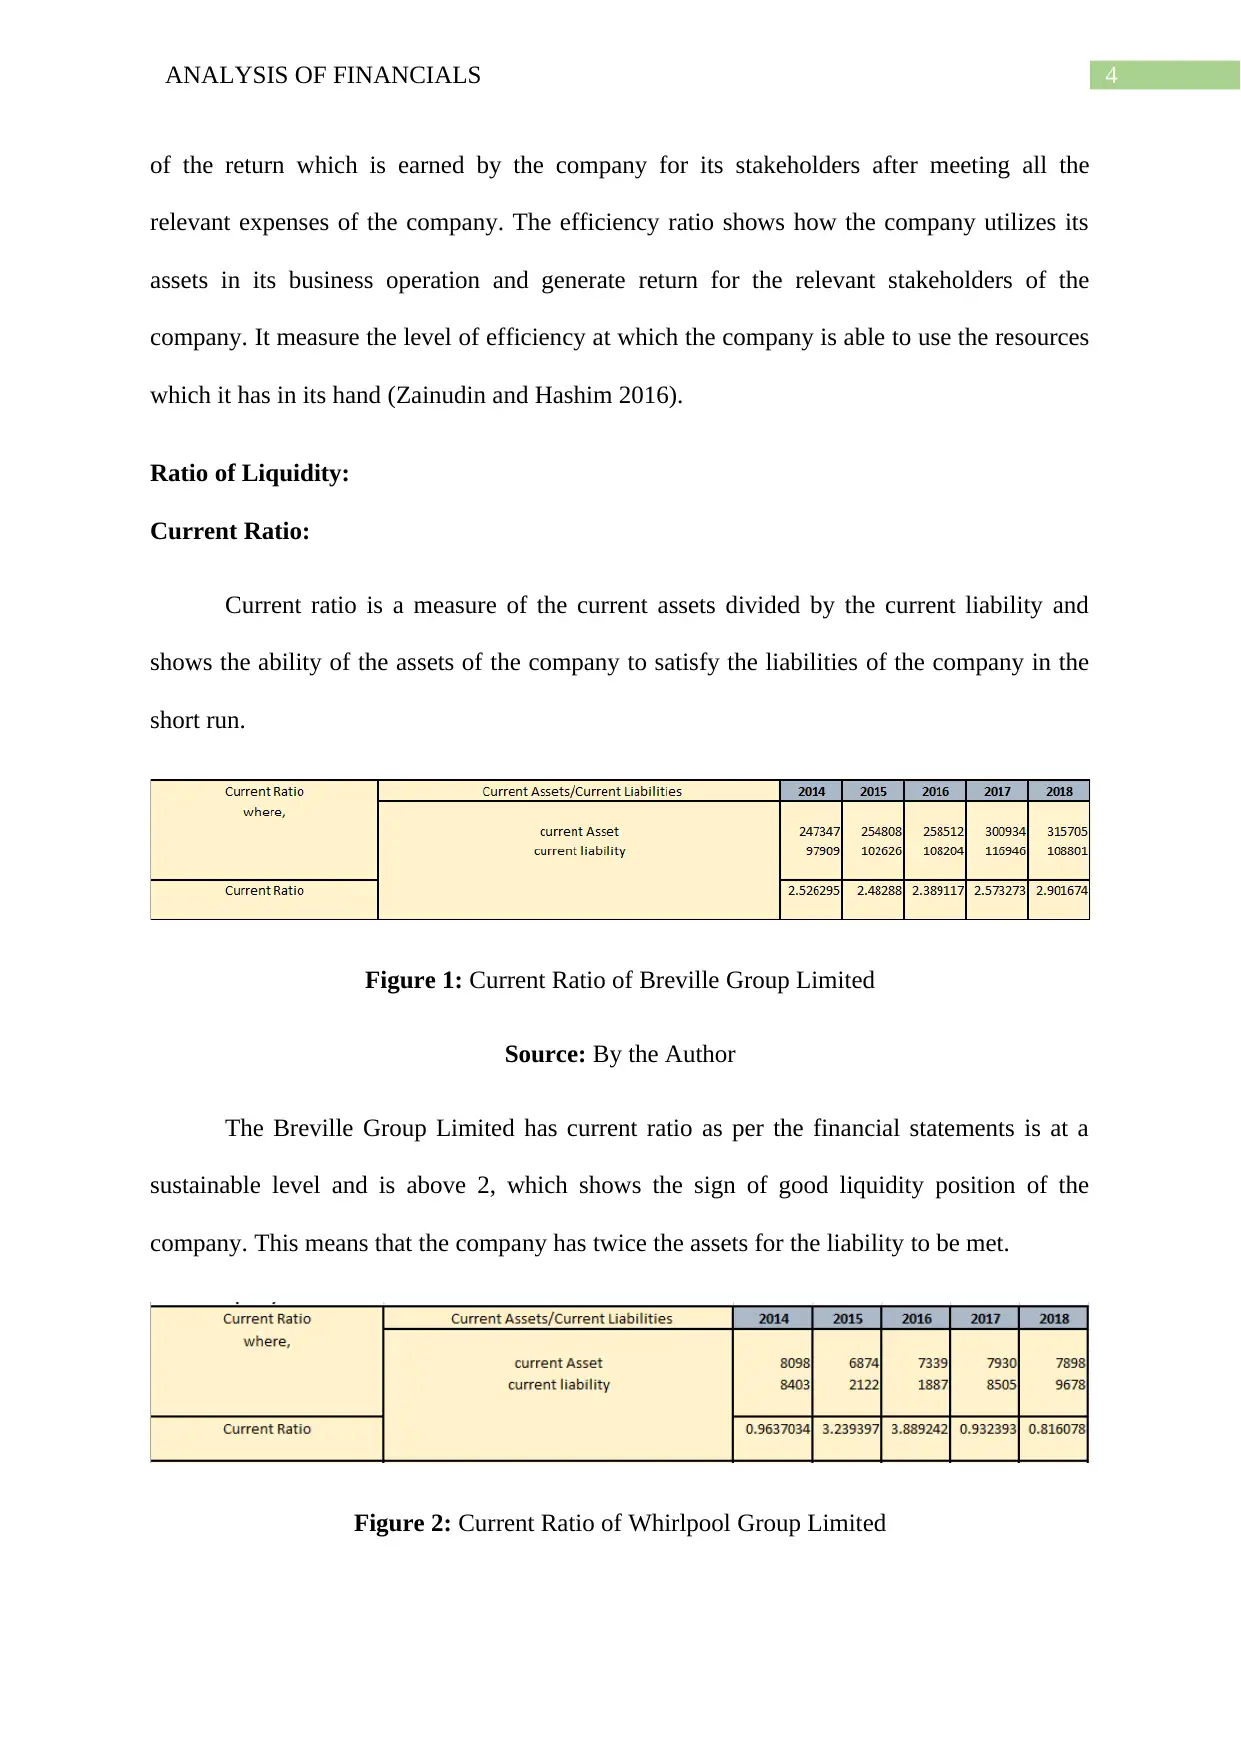
Current Ratio:
Current ratio is a measure of the current assets divided by the current liability and
shows the ability of the assets of the company to satisfy the liabilities of the company in the
short run.
Figure 1: Current Ratio of Breville Group Limited
Source: By the Author
The Breville Group Limited has current ratio as per the financial statements is at a
sustainable level and is above 2, which shows the sign of good liquidity position of the
company. This means that the company has twice the assets for the liability to be met.
Figure 2: Current Ratio of Whirlpool Group Limited
of the return which is earned by the company for its stakeholders after meeting all the
relevant expenses of the company. The efficiency ratio shows how the company utilizes its
assets in its business operation and generate return for the relevant stakeholders of the
company. It measure the level of efficiency at which the company is able to use the resources
which it has in its hand (Zainudin and Hashim 2016).
Ratio of Liquidity:
Current Ratio:
Current ratio is a measure of the current assets divided by the current liability and
shows the ability of the assets of the company to satisfy the liabilities of the company in the
short run.
Figure 1: Current Ratio of Breville Group Limited
Source: By the Author
The Breville Group Limited has current ratio as per the financial statements is at a
sustainable level and is above 2, which shows the sign of good liquidity position of the
company. This means that the company has twice the assets for the liability to be met.
Figure 2: Current Ratio of Whirlpool Group Limited
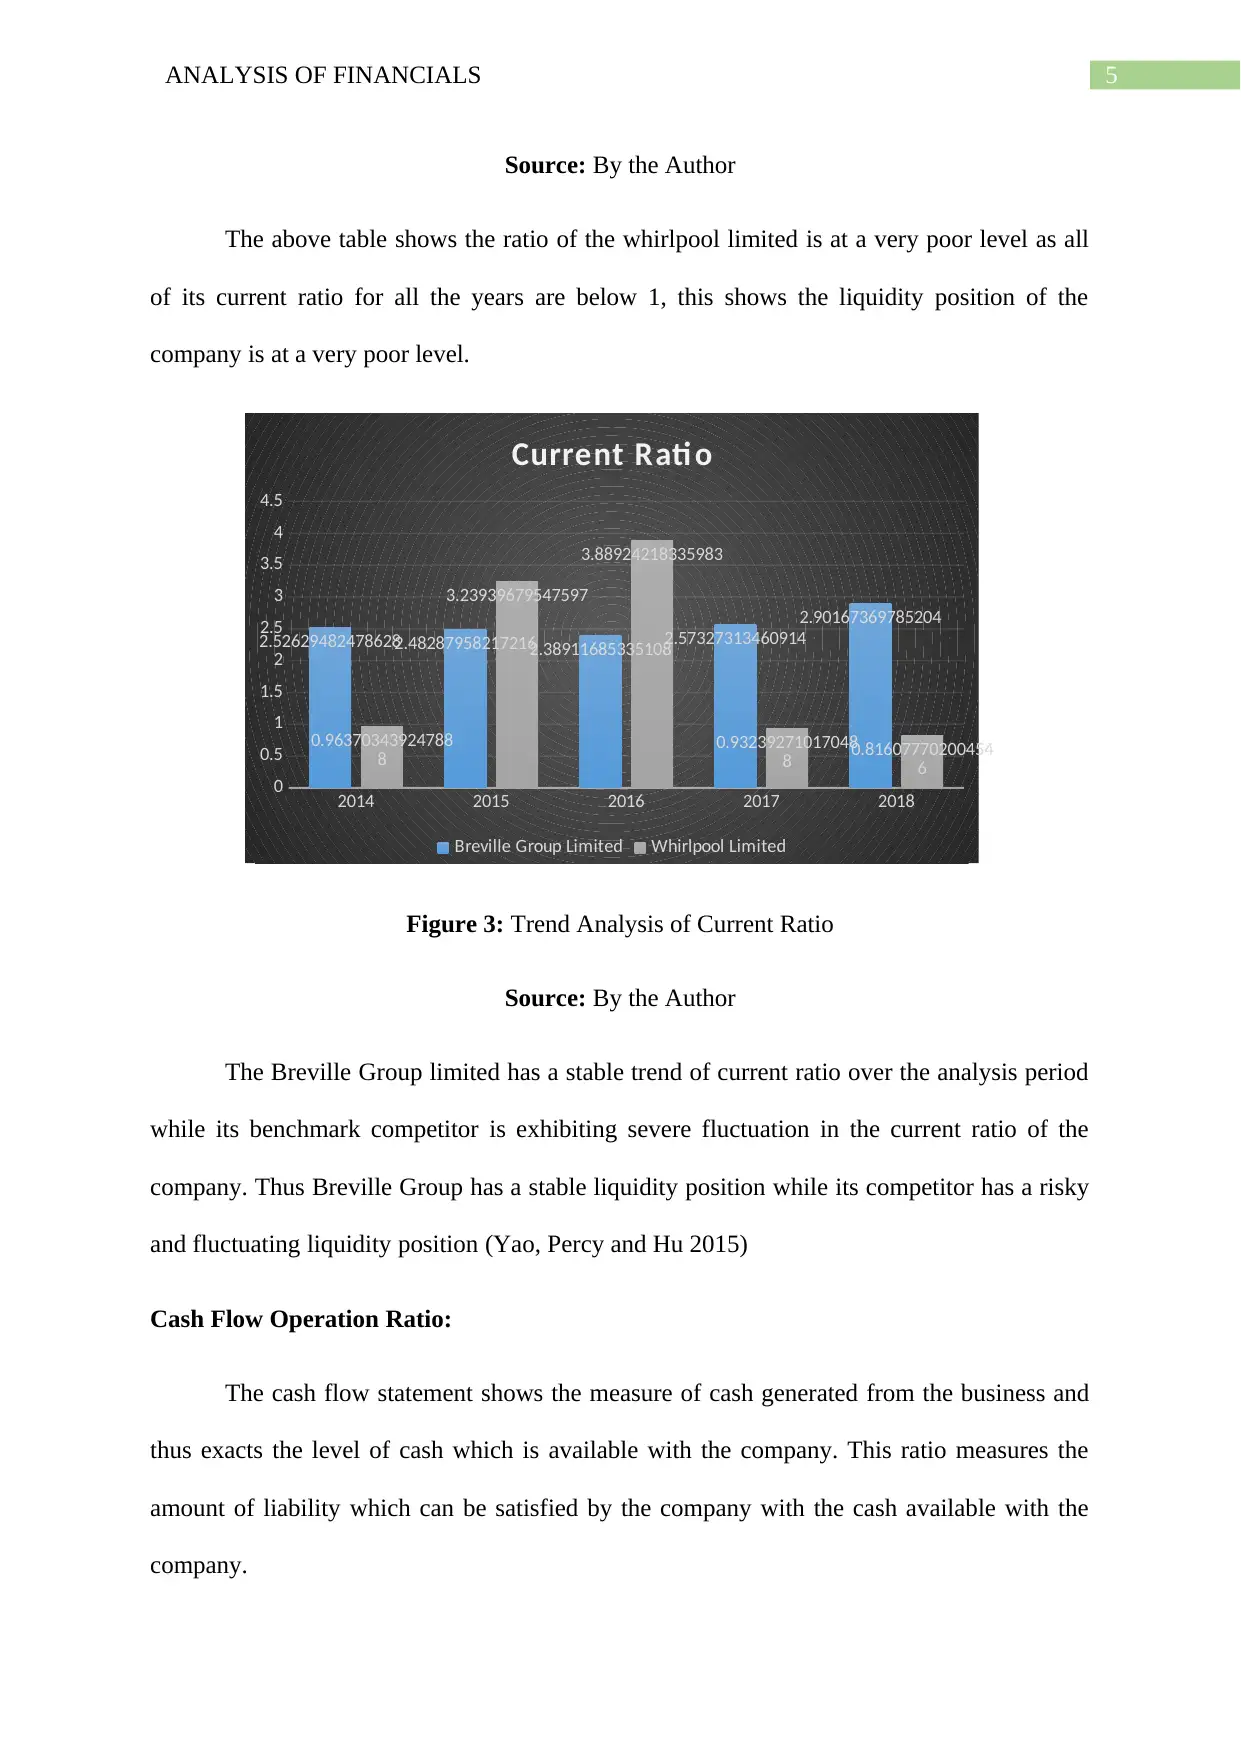
5ANALYSIS OF FINANCIALS
Source: By the Author
The above table shows the ratio of the whirlpool limited is at a very poor level as all
of its current ratio for all the years are below 1, this shows the liquidity position of the
company is at a very poor level.
2014 2015 2016 2017 2018
0
0.5
1
1.5
2
2.5
3
3.5
4
4.5
2.526294824786282.482879582172162.38911685335108
2.57327313460914
2.90167369785204
0.96370343924788
8
3.23939679547597
3.88924218335983
0.93239271017048
8 0.81607770200454
6
Current Rati o
Breville Group Limited Whirlpool Limited
Figure 3: Trend Analysis of Current Ratio
Source: By the Author
The Breville Group limited has a stable trend of current ratio over the analysis period
while its benchmark competitor is exhibiting severe fluctuation in the current ratio of the
company. Thus Breville Group has a stable liquidity position while its competitor has a risky
and fluctuating liquidity position (Yao, Percy and Hu 2015)
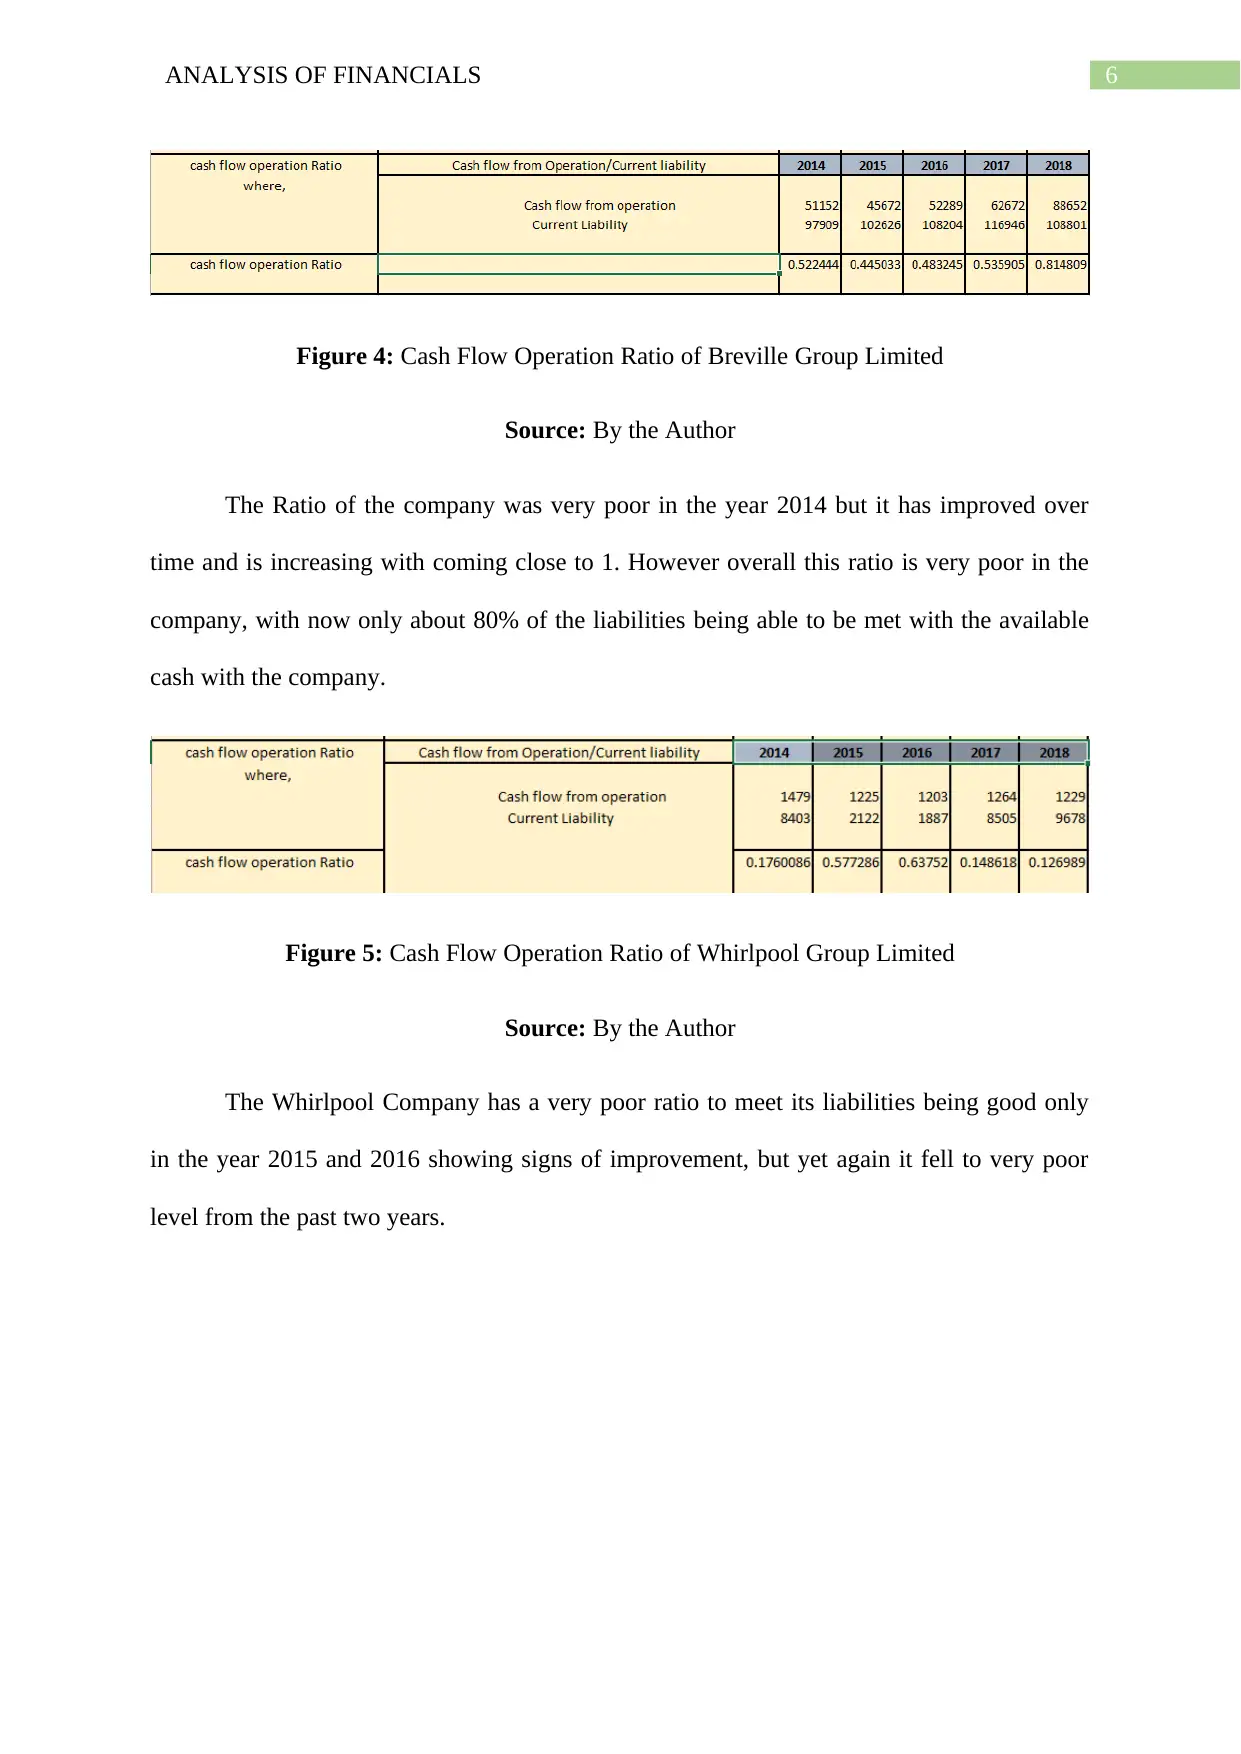
Cash Flow Operation Ratio:
The cash flow statement shows the measure of cash generated from the business and
thus exacts the level of cash which is available with the company. This ratio measures the
amount of liability which can be satisfied by the company with the cash available with the
company.
Source: By the Author
The above table shows the ratio of the whirlpool limited is at a very poor level as all
of its current ratio for all the years are below 1, this shows the liquidity position of the
company is at a very poor level.
2014 2015 2016 2017 2018
0
0.5
1
1.5
2
2.5
3
3.5
4
4.5
2.526294824786282.482879582172162.38911685335108
2.57327313460914
2.90167369785204
0.96370343924788
8
3.23939679547597
3.88924218335983
0.93239271017048
8 0.81607770200454
6
Current Rati o
Breville Group Limited Whirlpool Limited
Figure 3: Trend Analysis of Current Ratio
Source: By the Author
The Breville Group limited has a stable trend of current ratio over the analysis period
while its benchmark competitor is exhibiting severe fluctuation in the current ratio of the
company. Thus Breville Group has a stable liquidity position while its competitor has a risky
and fluctuating liquidity position (Yao, Percy and Hu 2015)
Cash Flow Operation Ratio:
The cash flow statement shows the measure of cash generated from the business and
thus exacts the level of cash which is available with the company. This ratio measures the
amount of liability which can be satisfied by the company with the cash available with the
company.
⊘ This is a preview!⊘
Do you want full access?
Subscribe today to unlock all pages.
Trusted by 1+ million students worldwide
6ANALYSIS OF FINANCIALS
Figure 4: Cash Flow Operation Ratio of Breville Group Limited
Source: By the Author
The Ratio of the company was very poor in the year 2014 but it has improved over
time and is increasing with coming close to 1. However overall this ratio is very poor in the
company, with now only about 80% of the liabilities being able to be met with the available
cash with the company.
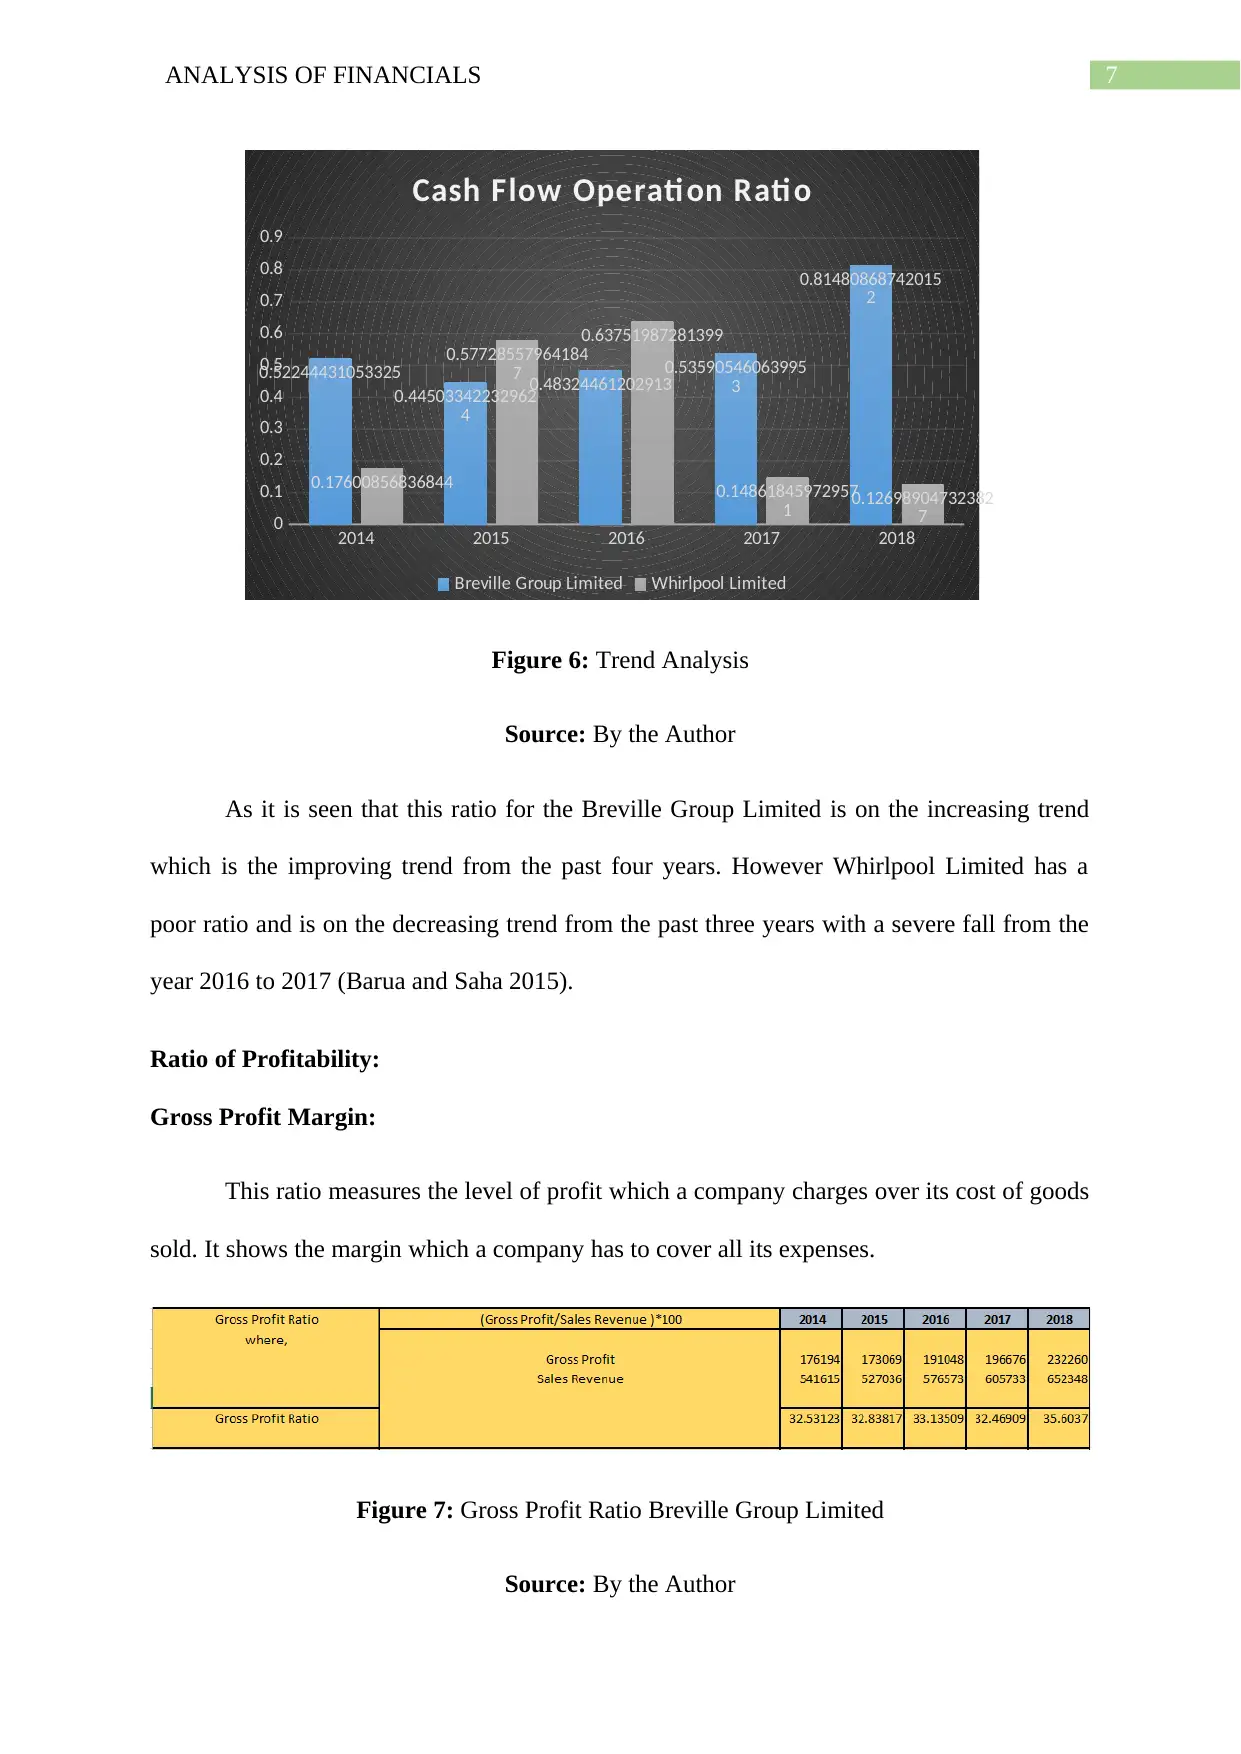
Figure 5: Cash Flow Operation Ratio of Whirlpool Group Limited
Source: By the Author
The Whirlpool Company has a very poor ratio to meet its liabilities being good only
in the year 2015 and 2016 showing signs of improvement, but yet again it fell to very poor
level from the past two years.
Figure 4: Cash Flow Operation Ratio of Breville Group Limited
Source: By the Author
The Ratio of the company was very poor in the year 2014 but it has improved over
time and is increasing with coming close to 1. However overall this ratio is very poor in the
company, with now only about 80% of the liabilities being able to be met with the available
cash with the company.
Figure 5: Cash Flow Operation Ratio of Whirlpool Group Limited
Source: By the Author
The Whirlpool Company has a very poor ratio to meet its liabilities being good only
in the year 2015 and 2016 showing signs of improvement, but yet again it fell to very poor
level from the past two years.
Paraphrase This Document
Need a fresh take? Get an instant paraphrase of this document with our AI Paraphraser
7ANALYSIS OF FINANCIALS
2014 2015 2016 2017 2018
0
0.1
0.2
0.3
0.4
0.5
0.6
0.7
0.8
0.9
0.52244431053325
0.44503342232962
4
0.48324461202913
0.53590546063995
3
0.81480868742015
2
0.17600856836844
0.57728557964184
7
0.63751987281399
0.14861845972957
1 0.12698904732382
7
Cash Flow Operation Rati o
Breville Group Limited Whirlpool Limited
Figure 6: Trend Analysis
Source: By the Author
As it is seen that this ratio for the Breville Group Limited is on the increasing trend
which is the improving trend from the past four years. However Whirlpool Limited has a
poor ratio and is on the decreasing trend from the past three years with a severe fall from the
year 2016 to 2017 (Barua and Saha 2015).
Ratio of Profitability:
Gross Profit Margin:
This ratio measures the level of profit which a company charges over its cost of goods
sold. It shows the margin which a company has to cover all its expenses.
Figure 7: Gross Profit Ratio Breville Group Limited
Source: By the Author
8ANALYSIS OF FINANCIALS
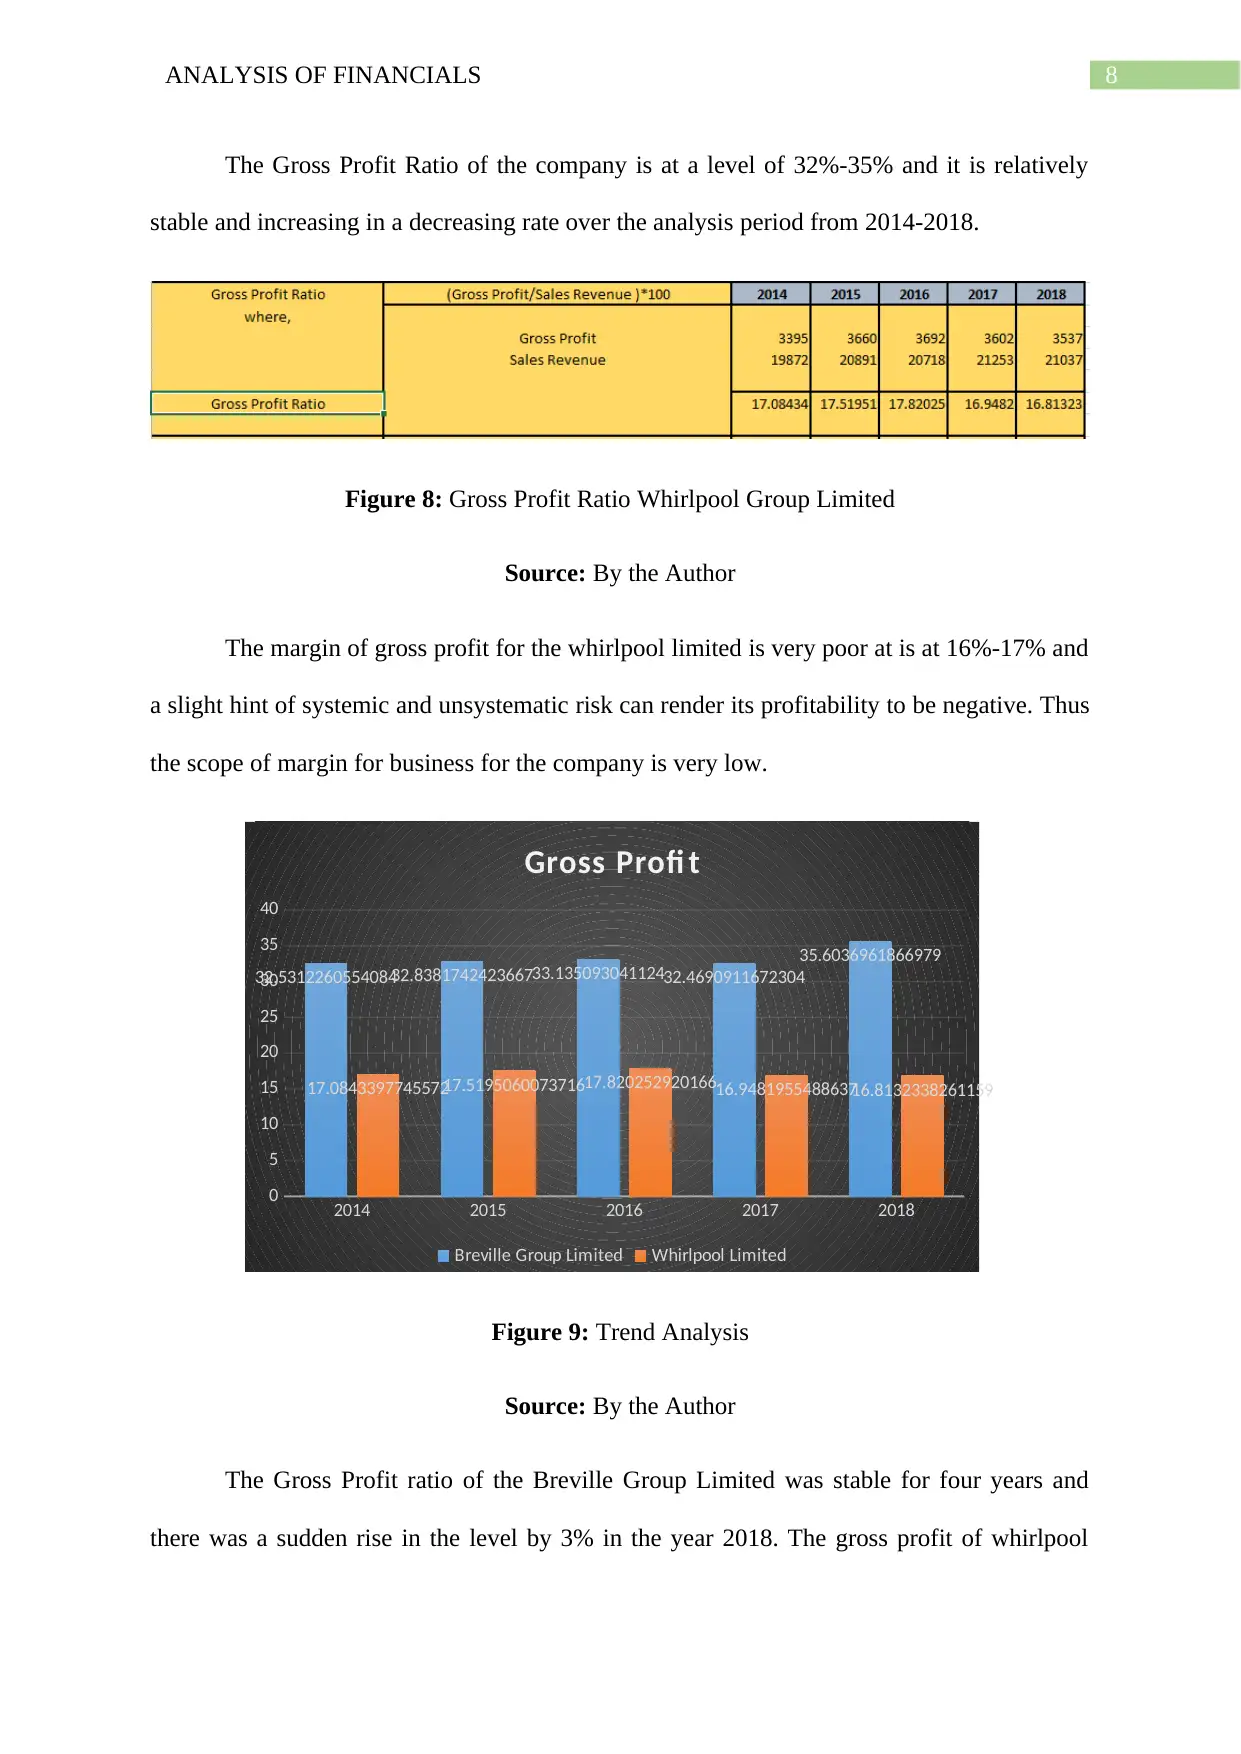
The Gross Profit Ratio of the company is at a level of 32%-35% and it is relatively
stable and increasing in a decreasing rate over the analysis period from 2014-2018.
Figure 8: Gross Profit Ratio Whirlpool Group Limited
Source: By the Author
The margin of gross profit for the whirlpool limited is very poor at is at 16%-17% and
a slight hint of systemic and unsystematic risk can render its profitability to be negative. Thus
the scope of margin for business for the company is very low.
2014 2015 2016 2017 2018
0
5
10
15
20
25
30
35
40
32.531226055408432.838174242366733.13509304112432.4690911672304
35.6036961866979
17.084339774557217.519506007371617.82025292016616.948195548863716.8132338261159
Gross Profi t
Breville Group Limited Whirlpool Limited
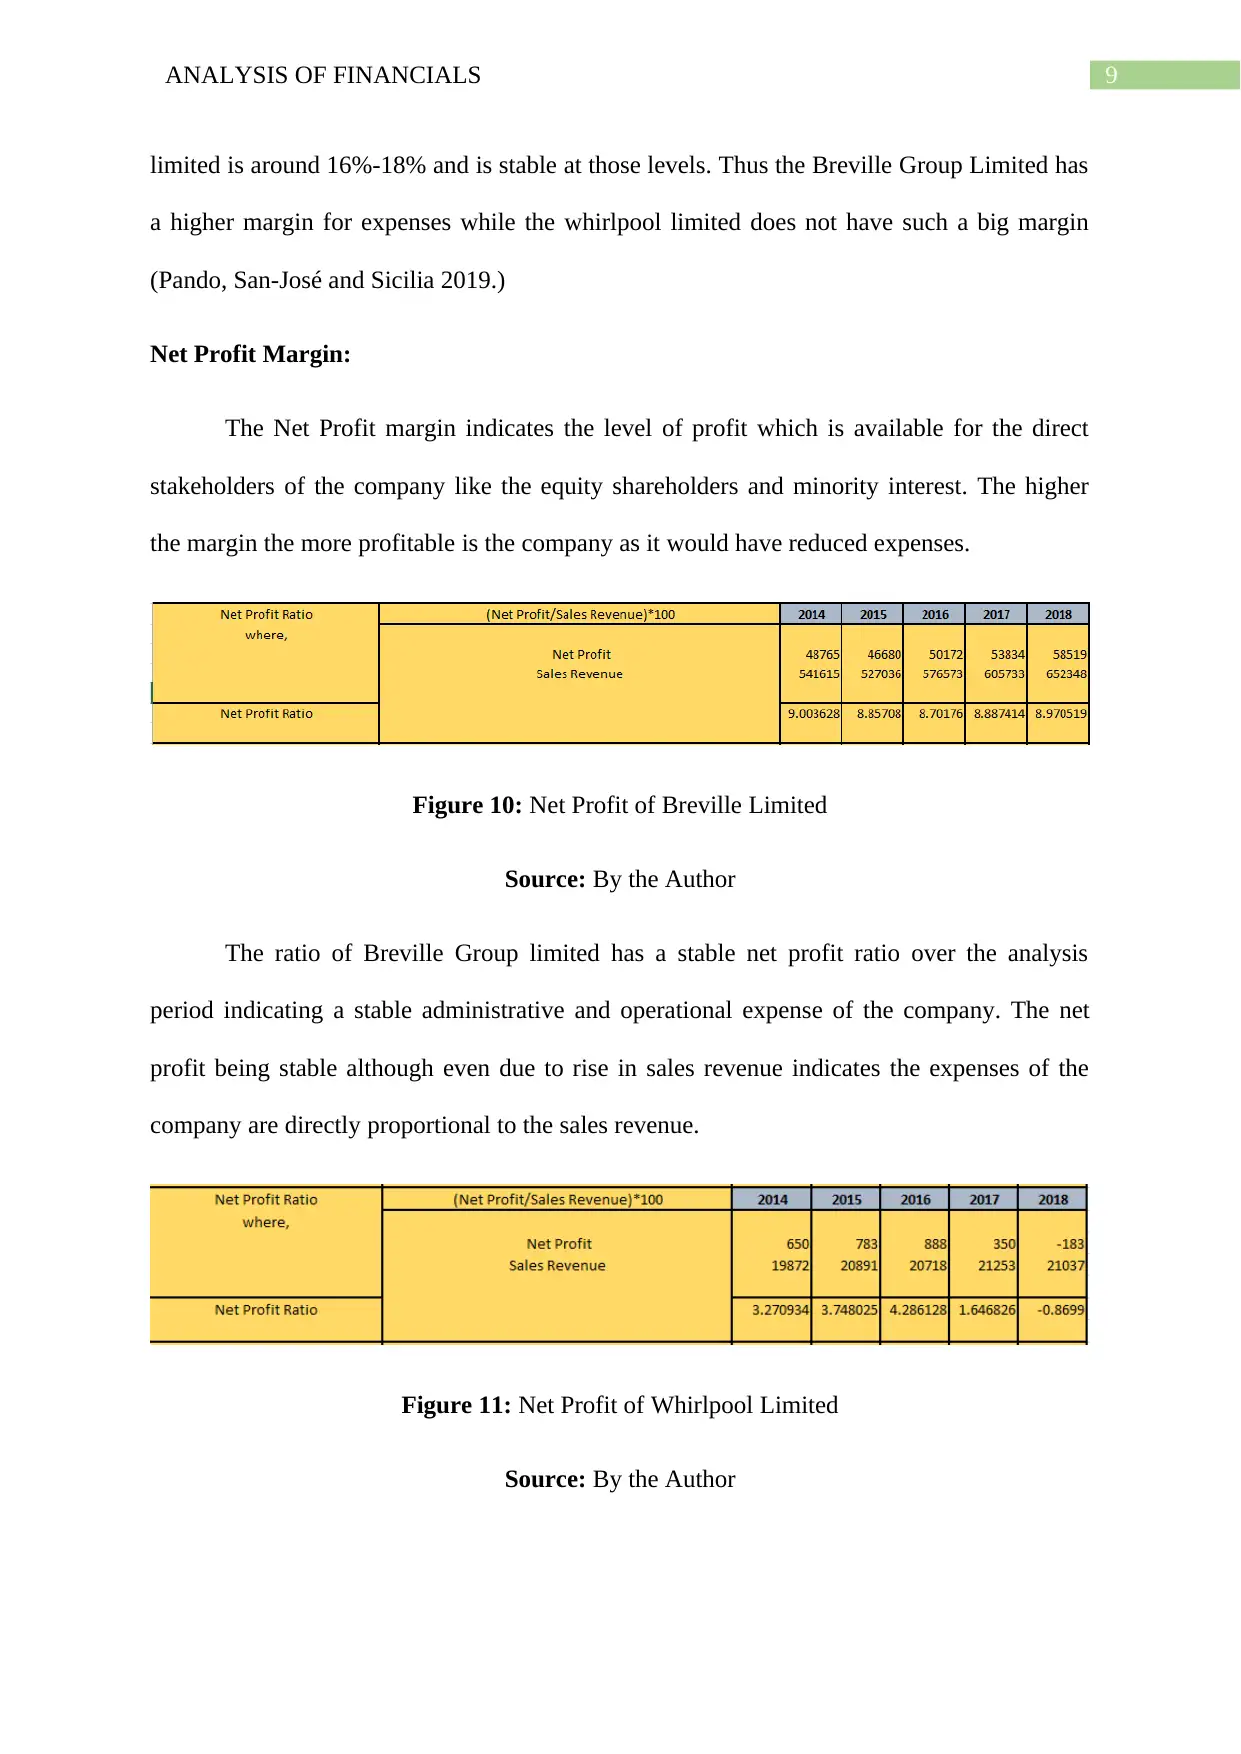
Figure 9: Trend Analysis
Source: By the Author
The Gross Profit ratio of the Breville Group Limited was stable for four years and
there was a sudden rise in the level by 3% in the year 2018. The gross profit of whirlpool
The Gross Profit Ratio of the company is at a level of 32%-35% and it is relatively
stable and increasing in a decreasing rate over the analysis period from 2014-2018.
Figure 8: Gross Profit Ratio Whirlpool Group Limited
Source: By the Author
The margin of gross profit for the whirlpool limited is very poor at is at 16%-17% and
a slight hint of systemic and unsystematic risk can render its profitability to be negative. Thus
the scope of margin for business for the company is very low.
2014 2015 2016 2017 2018
0
5
10
15
20
25
30
35
40
32.531226055408432.838174242366733.13509304112432.4690911672304
35.6036961866979
17.084339774557217.519506007371617.82025292016616.948195548863716.8132338261159
Gross Profi t
Breville Group Limited Whirlpool Limited
Figure 9: Trend Analysis
Source: By the Author
The Gross Profit ratio of the Breville Group Limited was stable for four years and
there was a sudden rise in the level by 3% in the year 2018. The gross profit of whirlpool
⊘ This is a preview!⊘
Do you want full access?
Subscribe today to unlock all pages.
Trusted by 1+ million students worldwide
9ANALYSIS OF FINANCIALS
limited is around 16%-18% and is stable at those levels. Thus the Breville Group Limited has
a higher margin for expenses while the whirlpool limited does not have such a big margin
(Pando, San-José and Sicilia 2019.)
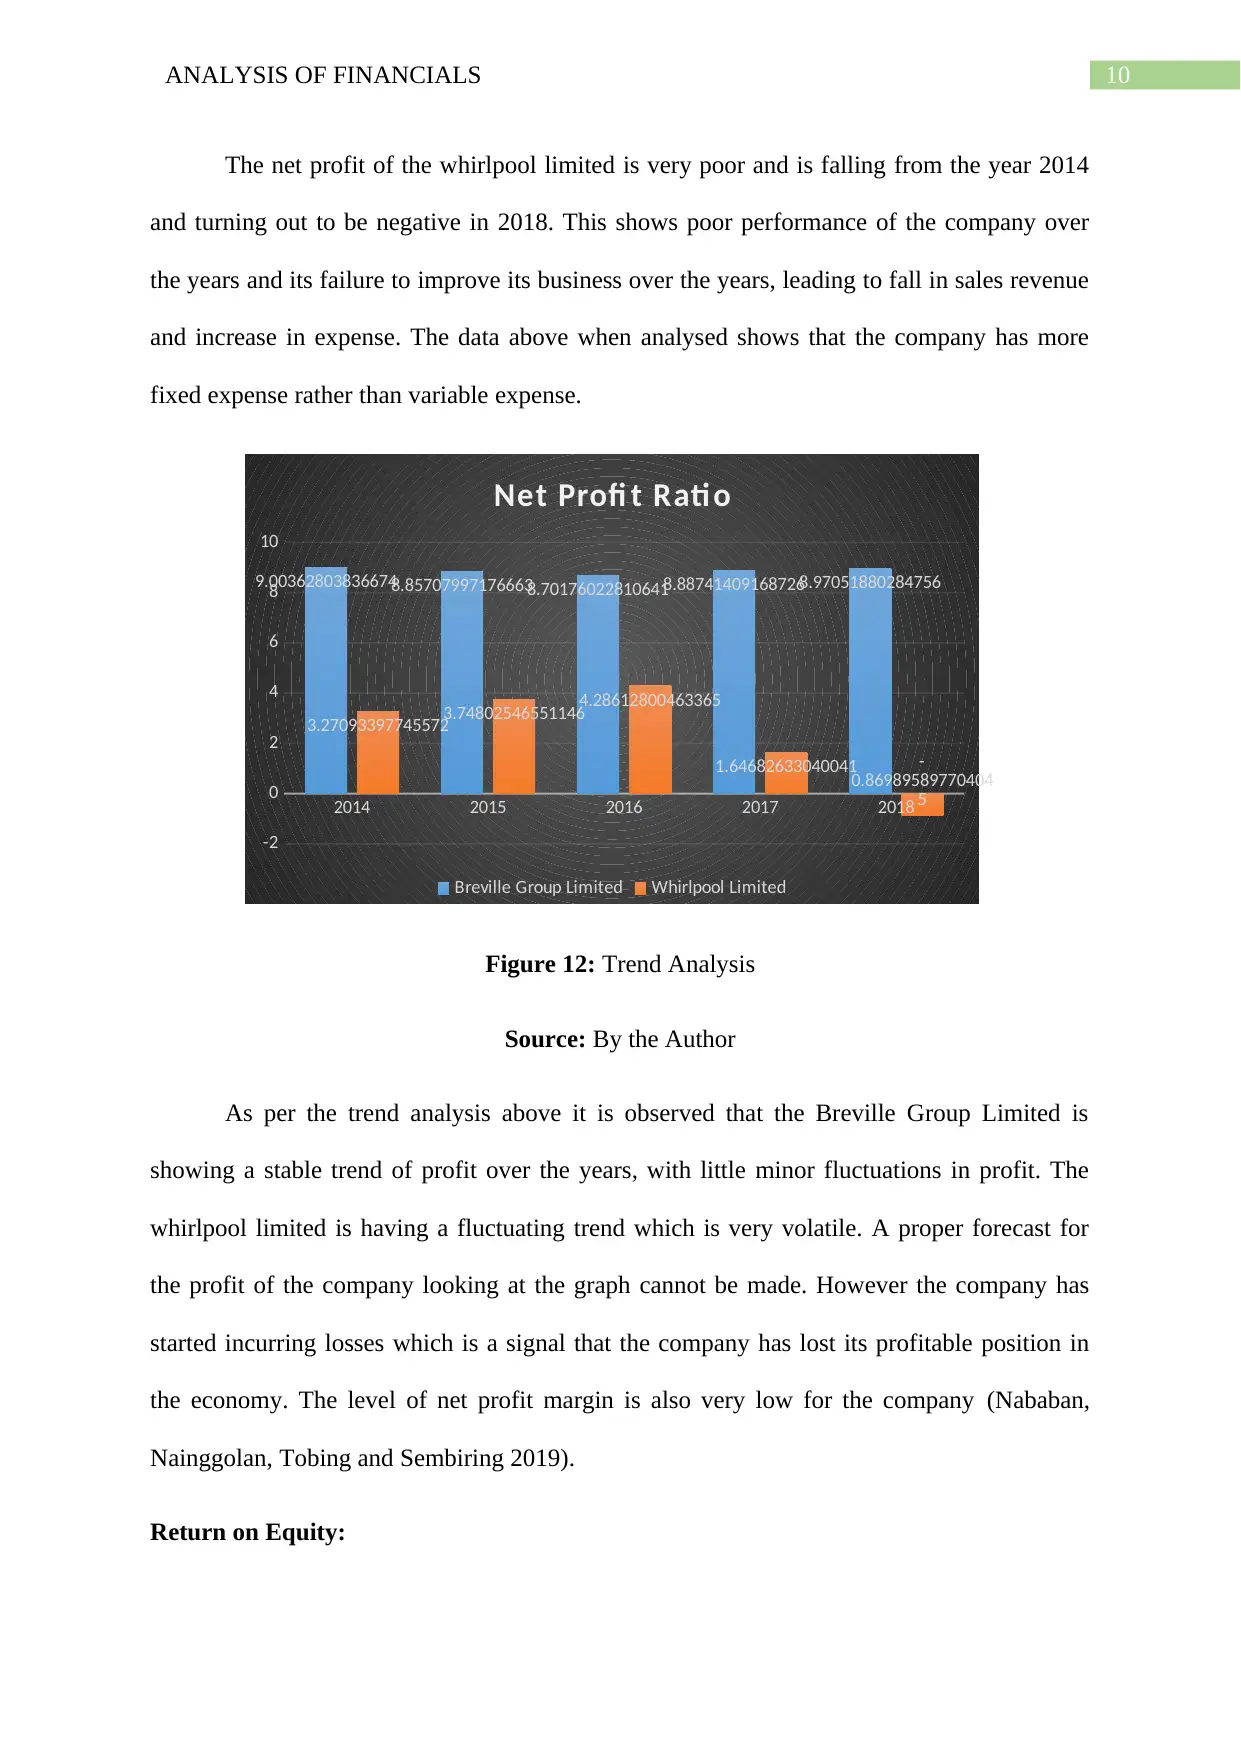
Net Profit Margin:
The Net Profit margin indicates the level of profit which is available for the direct
stakeholders of the company like the equity shareholders and minority interest. The higher
the margin the more profitable is the company as it would have reduced expenses.
Figure 10: Net Profit of Breville Limited
Source: By the Author
The ratio of Breville Group limited has a stable net profit ratio over the analysis
period indicating a stable administrative and operational expense of the company. The net
profit being stable although even due to rise in sales revenue indicates the expenses of the
company are directly proportional to the sales revenue.
Figure 11: Net Profit of Whirlpool Limited
Source: By the Author
limited is around 16%-18% and is stable at those levels. Thus the Breville Group Limited has
a higher margin for expenses while the whirlpool limited does not have such a big margin
(Pando, San-José and Sicilia 2019.)
Net Profit Margin:
The Net Profit margin indicates the level of profit which is available for the direct
stakeholders of the company like the equity shareholders and minority interest. The higher
the margin the more profitable is the company as it would have reduced expenses.
Figure 10: Net Profit of Breville Limited
Source: By the Author
The ratio of Breville Group limited has a stable net profit ratio over the analysis
period indicating a stable administrative and operational expense of the company. The net
profit being stable although even due to rise in sales revenue indicates the expenses of the
company are directly proportional to the sales revenue.
Figure 11: Net Profit of Whirlpool Limited
Source: By the Author
Paraphrase This Document
Need a fresh take? Get an instant paraphrase of this document with our AI Paraphraser
10ANALYSIS OF FINANCIALS
The net profit of the whirlpool limited is very poor and is falling from the year 2014
and turning out to be negative in 2018. This shows poor performance of the company over
the years and its failure to improve its business over the years, leading to fall in sales revenue
and increase in expense. The data above when analysed shows that the company has more
fixed expense rather than variable expense.
2014 2015 2016 2017 2018
-2
0
2
4
6
8
10
9.003628038366748.857079971766638.701760228106418.887414091687268.97051880284756
3.27093397745572
3.74802546551146
4.28612800463365
1.64682633040041 -
0.86989589770404
5
Net Profi t Ratio
Breville Group Limited Whirlpool Limited
Figure 12: Trend Analysis
Source: By the Author
As per the trend analysis above it is observed that the Breville Group Limited is
showing a stable trend of profit over the years, with little minor fluctuations in profit. The
whirlpool limited is having a fluctuating trend which is very volatile. A proper forecast for
the profit of the company looking at the graph cannot be made. However the company has
started incurring losses which is a signal that the company has lost its profitable position in
the economy. The level of net profit margin is also very low for the company (Nababan,
Nainggolan, Tobing and Sembiring 2019).
Return on Equity:
11ANALYSIS OF FINANCIALS
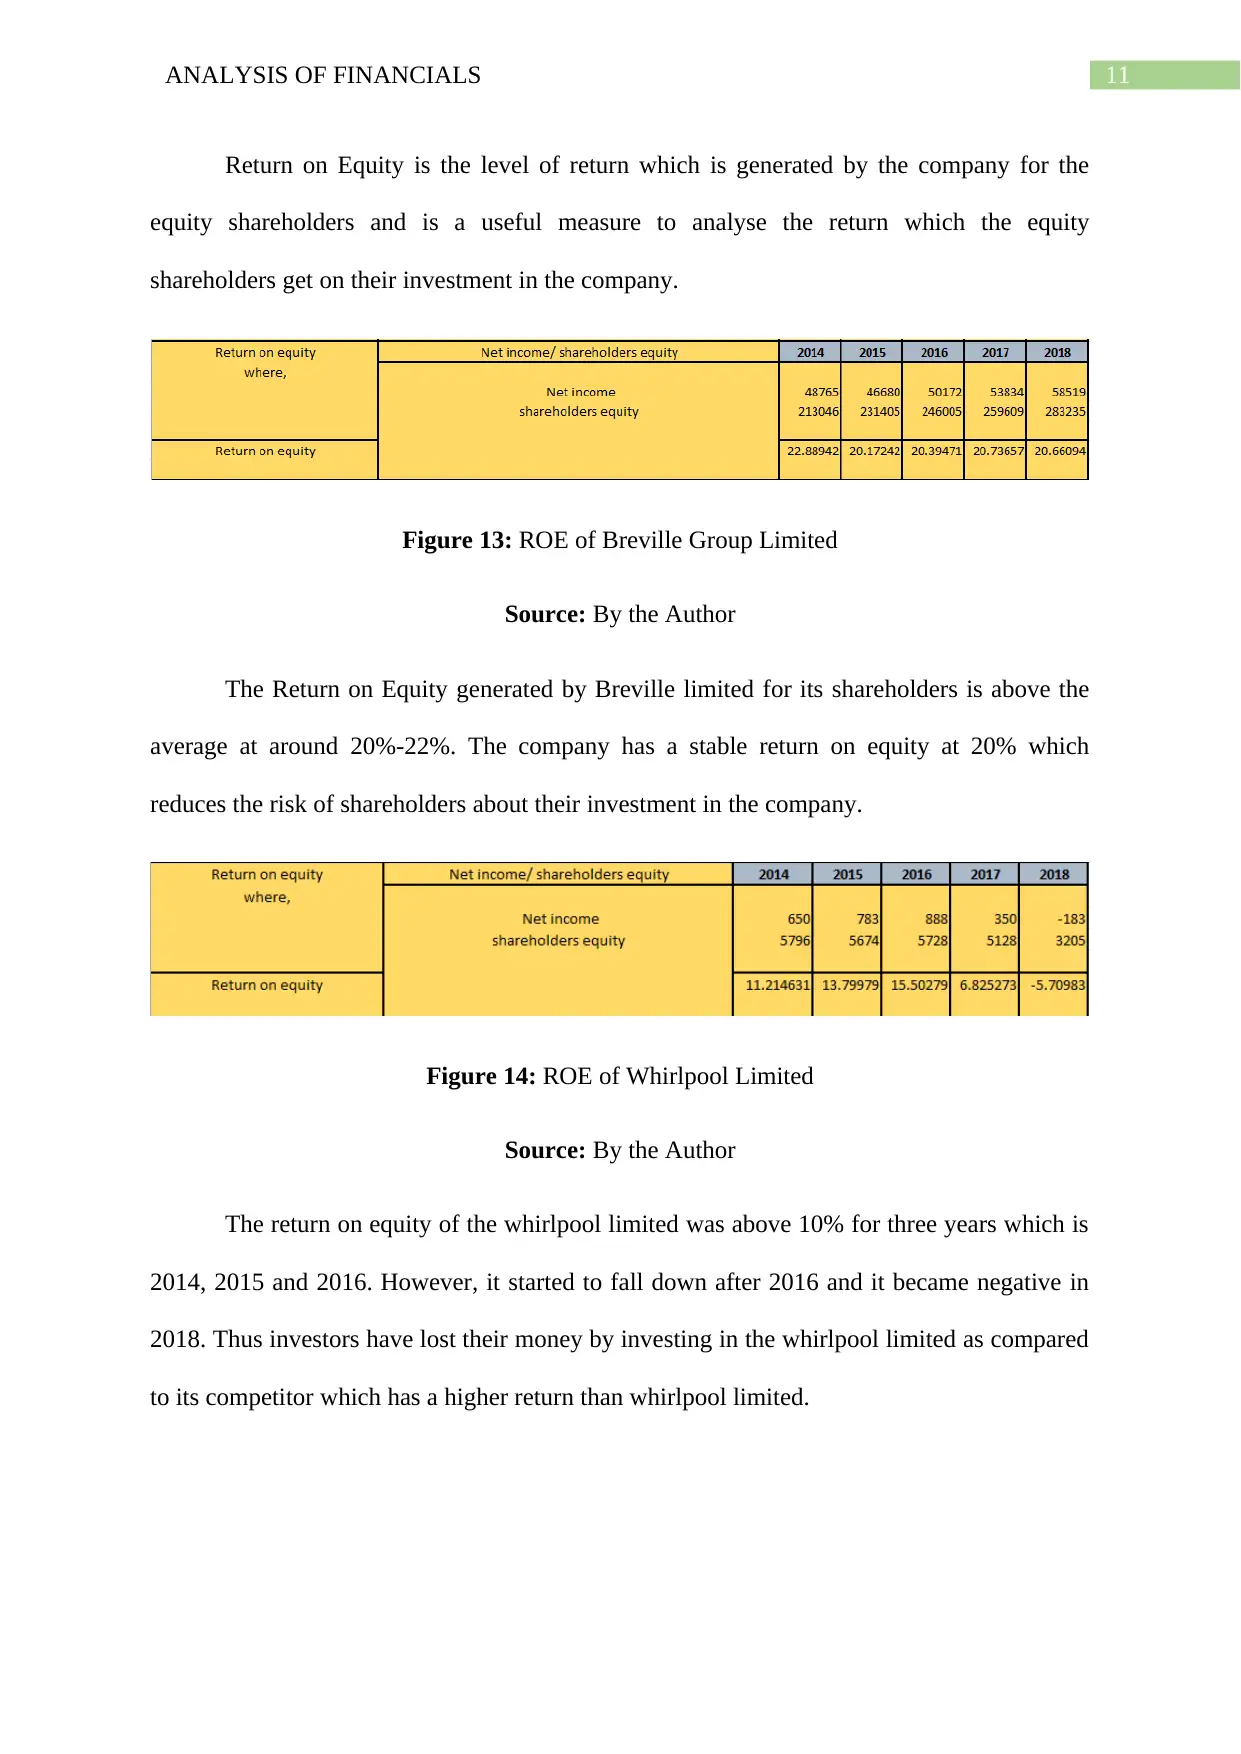
Return on Equity is the level of return which is generated by the company for the
equity shareholders and is a useful measure to analyse the return which the equity
shareholders get on their investment in the company.
Figure 13: ROE of Breville Group Limited
Source: By the Author
The Return on Equity generated by Breville limited for its shareholders is above the
average at around 20%-22%. The company has a stable return on equity at 20% which
reduces the risk of shareholders about their investment in the company.
Figure 14: ROE of Whirlpool Limited
Source: By the Author
The return on equity of the whirlpool limited was above 10% for three years which is
2014, 2015 and 2016. However, it started to fall down after 2016 and it became negative in
2018. Thus investors have lost their money by investing in the whirlpool limited as compared
to its competitor which has a higher return than whirlpool limited.
⊘ This is a preview!⊘
Do you want full access?
Subscribe today to unlock all pages.
Trusted by 1+ million students worldwide
1 out of 19
Related Documents


Your All-in-One AI-Powered Toolkit for Academic Success.
+13062052269
info@desklib.com
Available 24*7 on WhatsApp / Email
![[object Object]](/_next/static/media/star-bottom.7253800d.svg)
Unlock your academic potential
Copyright © 2020–2026 A2Z Services. All Rights Reserved. Developed and managed by ZUCOL.