Financial Report: Analyzing Daily Returns of AUD/GBP and MYR/GBP

Verified

Added on  2023/03/17

|6
|722
|26
Report
AI Summary
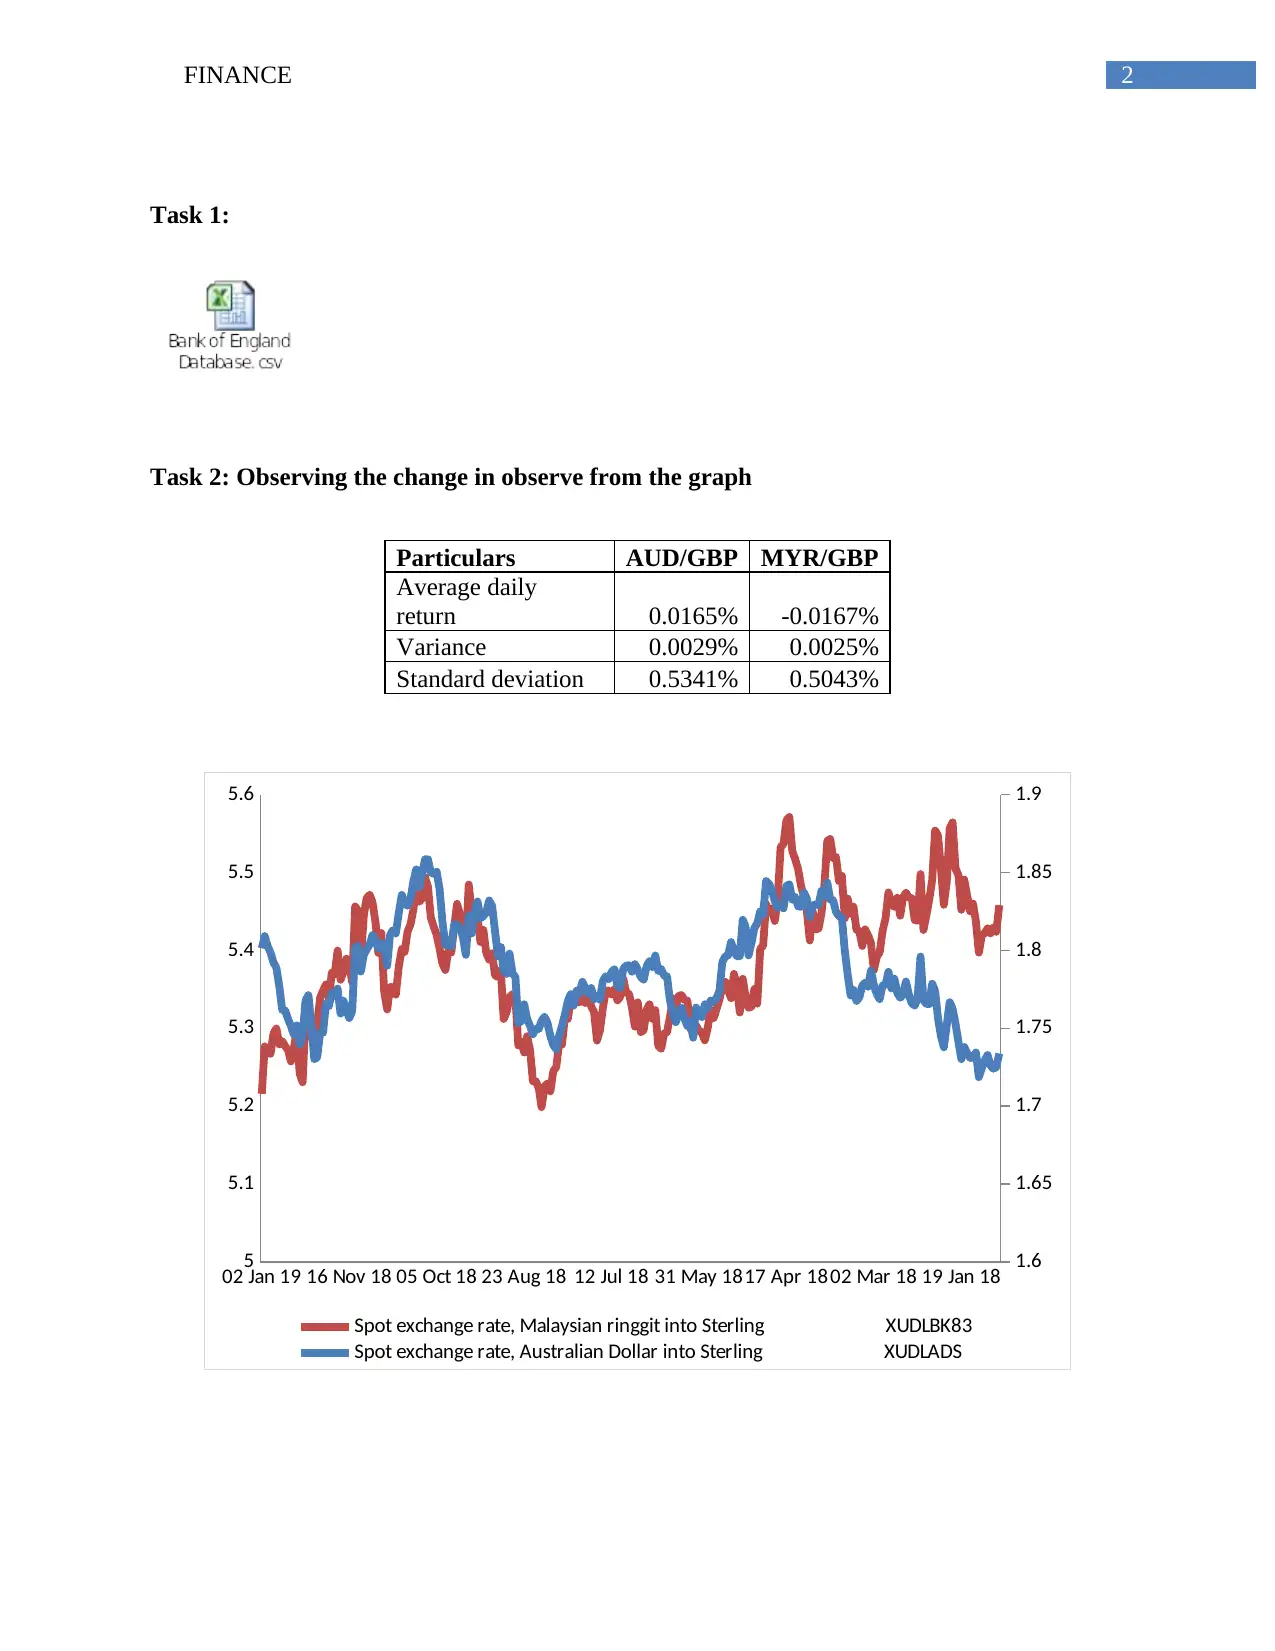
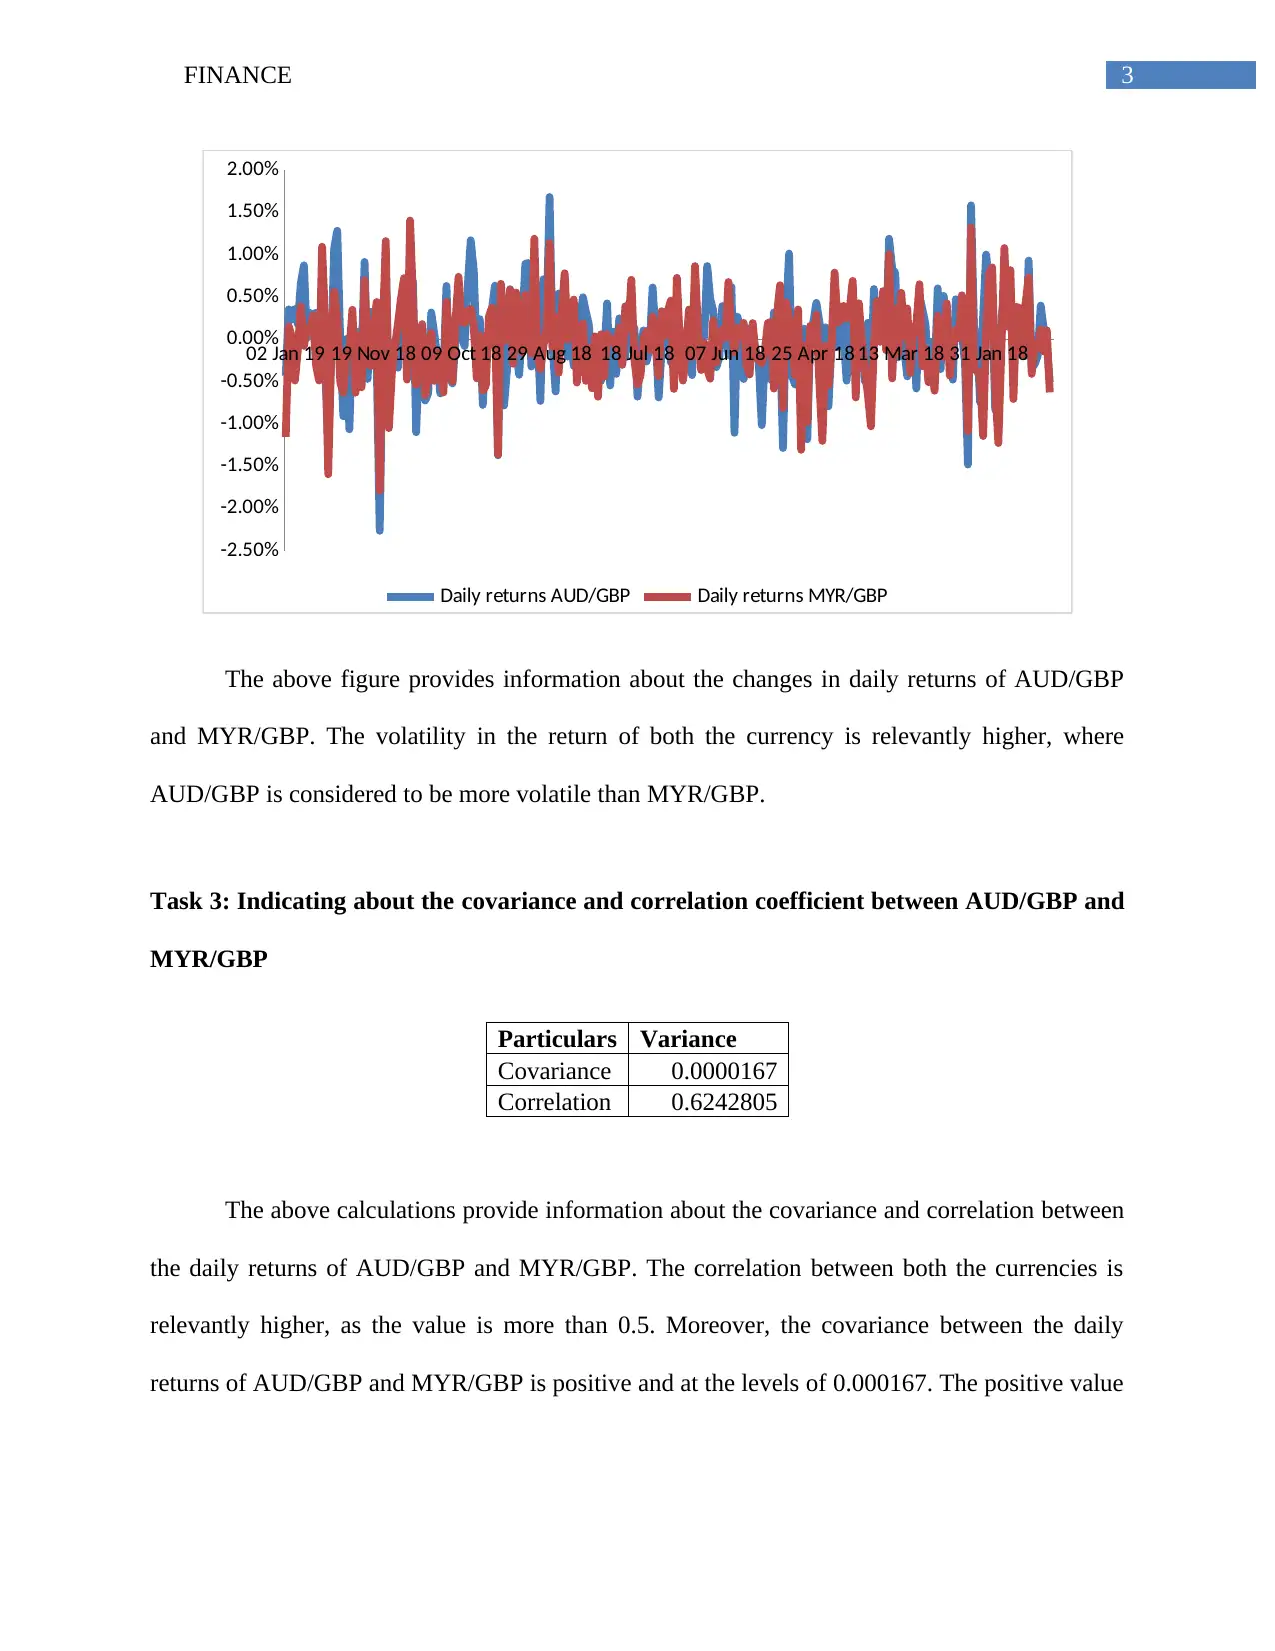
This finance report presents an analysis of AUD/GBP and MYR/GBP exchange rates from January 2, 2018, to January 2, 2019. The analysis includes calculating daily returns, average daily returns, variance, and standard deviation for both currency pairs. The report also examines the covariance and correlation coefficient between AUD/GBP and MYR/GBP, providing insights into their relationship. Furthermore, the report constructs and analyzes an equally weighted portfolio of AUD/GBP and MYR/GBP, calculating its daily returns, average daily returns, variance, and standard deviation. The findings are presented through graphs and tables, offering a comprehensive understanding of the exchange rate dynamics and portfolio performance. The volatility of the currency pairs and the portfolio's risk diversification are also discussed.
Document Page
Running head: FINANCE
Finance
Name of the Student:
Name of the University:
Author’s Note:
Course ID:
tabler-icon-diamond-filled.svg

Paraphrase This Document

Need a fresh take? Get an instant paraphrase of this document with our AI Paraphraser
Document Page
1FINANCE
Table of Contents
Task 1:.............................................................................................................................................2
Task 2: Observing the change in observe from the graph...............................................................2
Task 3: Indicating about the covariance and correlation coefficient between AUD/GBP and
MYR/GBP.......................................................................................................................................3
Task 4: Observing the graph and comparing it with others.............................................................4
References and Bibliography:..........................................................................................................5
Document Page
2FINANCE
Task 1:
Task 2: Observing the change in observe from the graph
Particulars AUD/GBP MYR/GBP
Average daily
return 0.0165% -0.0167%
Variance 0.0029% 0.0025%
Standard deviation 0.5341% 0.5043%
02 Jan 19 16 Nov 18 05 Oct 18 23 Aug 18 12 Jul 18 31 May 1817 Apr 1802 Mar 18 19 Jan 18
5
5.1
5.2
5.3
5.4
5.5
5.6
1.6
1.65
1.7
1.75
1.8
1.85
1.9
Spot exchange rate, Malaysian ringgit into Sterling XUDLBK83
Spot exchange rate, Australian Dollar into Sterling XUDLADS
Document Page
3FINANCE
02 Jan 19 19 Nov 18 09 Oct 18 29 Aug 18 18 Jul 18 07 Jun 18 25 Apr 18 13 Mar 18 31 Jan 18
-2.50%
-2.00%
-1.50%
-1.00%
-0.50%
0.00%
0.50%
1.00%
1.50%
2.00%
Daily returns AUD/GBP Daily returns MYR/GBP
The above figure provides information about the changes in daily returns of AUD/GBP
and MYR/GBP. The volatility in the return of both the currency is relevantly higher, where
AUD/GBP is considered to be more volatile than MYR/GBP.
Task 3: Indicating about the covariance and correlation coefficient between AUD/GBP and
MYR/GBP
Particulars Variance
Covariance 0.0000167
Correlation 0.6242805
The above calculations provide information about the covariance and correlation between
the daily returns of AUD/GBP and MYR/GBP. The correlation between both the currencies is
relevantly higher, as the value is more than 0.5. Moreover, the covariance between the daily
returns of AUD/GBP and MYR/GBP is positive and at the levels of 0.000167. The positive value
tabler-icon-diamond-filled.svg

Paraphrase This Document

Need a fresh take? Get an instant paraphrase of this document with our AI Paraphraser
Document Page
4FINANCE
of covariance indicates that the overall currencies positive relationship (Syriopoulos, Makram
and Boubaker 2015).
Task 4: Observing the graph and comparing it with others
02 Jan 19 19 Nov 18 09 Oct 18 29 Aug 18 18 Jul 18 07 Jun 18 25 Apr 18 13 Mar 18 31 Jan 18
-2.50%
-2.00%
-1.50%
-1.00%
-0.50%
0.00%
0.50%
1.00%
1.50%
2.00%
Portfolio return
Portfolio Value
Average daily
return -0.0001%
Variance 0.0027%
Standard deviation 0.5194%
The above graph provides information about the volatile in the total portfolio returns
comprises of daily returns from AUD/GBP and MYR/GBP. Moreover, the portfolio weights
have reduced the overall risk involved in investments. However, the graph indicates the high
volatility still present in the portfolio. The overall average daily returns have provided a negative
value, which indicates that the portfolio weights are not adequate to diversify the risk of
investment and maximise the level of income from investment (Mouna and Jarboui 2015).
Document Page
5FINANCE
References and Bibliography:
Bankofengland.co.uk. 2019. Bank of England | Database. [online] Bankofengland.co.uk.
Available at: https://www.bankofengland.co.uk/boeapps/database/fromshowcolumns.asp?
Travel=NIxIRxSUx&FromSeries=1&ToSeries=50&DAT=RNG&FD=2&FM=Jan&FY=2018&
TD=2&TM=Jan&TY=2019&FNY=&CSVF=TT&html.x=284&html.y=46&C=EC3&C=IN8&Fi
lter=N [Accessed 9 May 2019].
Mensi, W., Hammoudeh, S. and Kang, S.H., 2015. Precious metals, cereal, oil and stock market
linkages and portfolio risk management: Evidence from Saudi Arabia. Economic Modelling, 51,
pp.340-358.
Mouna, A. and Jarboui, A., 2015. Financial literacy and portfolio diversification: an observation
from the Tunisian stock market. International Journal of Bank Marketing, 33(6), pp.808-822.
Syriopoulos, T., Makram, B. and Boubaker, A., 2015. Stock market volatility spillovers and
portfolio hedging: BRICS and the financial crisis. International Review of Financial
Analysis, 39, pp.7-18.
chevron_up_icon
1 out of 6
circle_padding
hide_on_mobile
zoom_out_icon
[object Object]