Financial Analysis Report: Walmart vs. Tesco for Asian Food Supplier
VerifiedAdded on 2022/12/23
|19
|3548
|89
Report
AI Summary
This report provides a comprehensive financial analysis of Walmart and Tesco, evaluating their performance from 2014 to 2017 to advise an Asian food manufacturer on a potential client. The analysis incorporates horizontal, vertical, and ratio analysis of financial statements, including income statements and balance sheets, to assess profitability, liquidity, and financial position. The report also examines working capital and cash flow to provide a complete financial overview of both supermarkets. The findings aim to identify which supermarket presents a more promising partnership opportunity for the Asian food supplier, considering their financial stability and potential for long-term business relationships. The analysis highlights trends in revenue, cost of sales, gross profit, operating profit, and net income, as well as key financial ratios, to provide actionable recommendations.
Financial analysis management enterprise
Paraphrase This Document
Need a fresh take? Get an instant paraphrase of this document with our AI Paraphraser
Contents
INTRODUCTION.....................................................................................................................................3
MAIN BODY.............................................................................................................................................3
CONCLUSION........................................................................................................................................14
REFERENCES........................................................................................................................................15
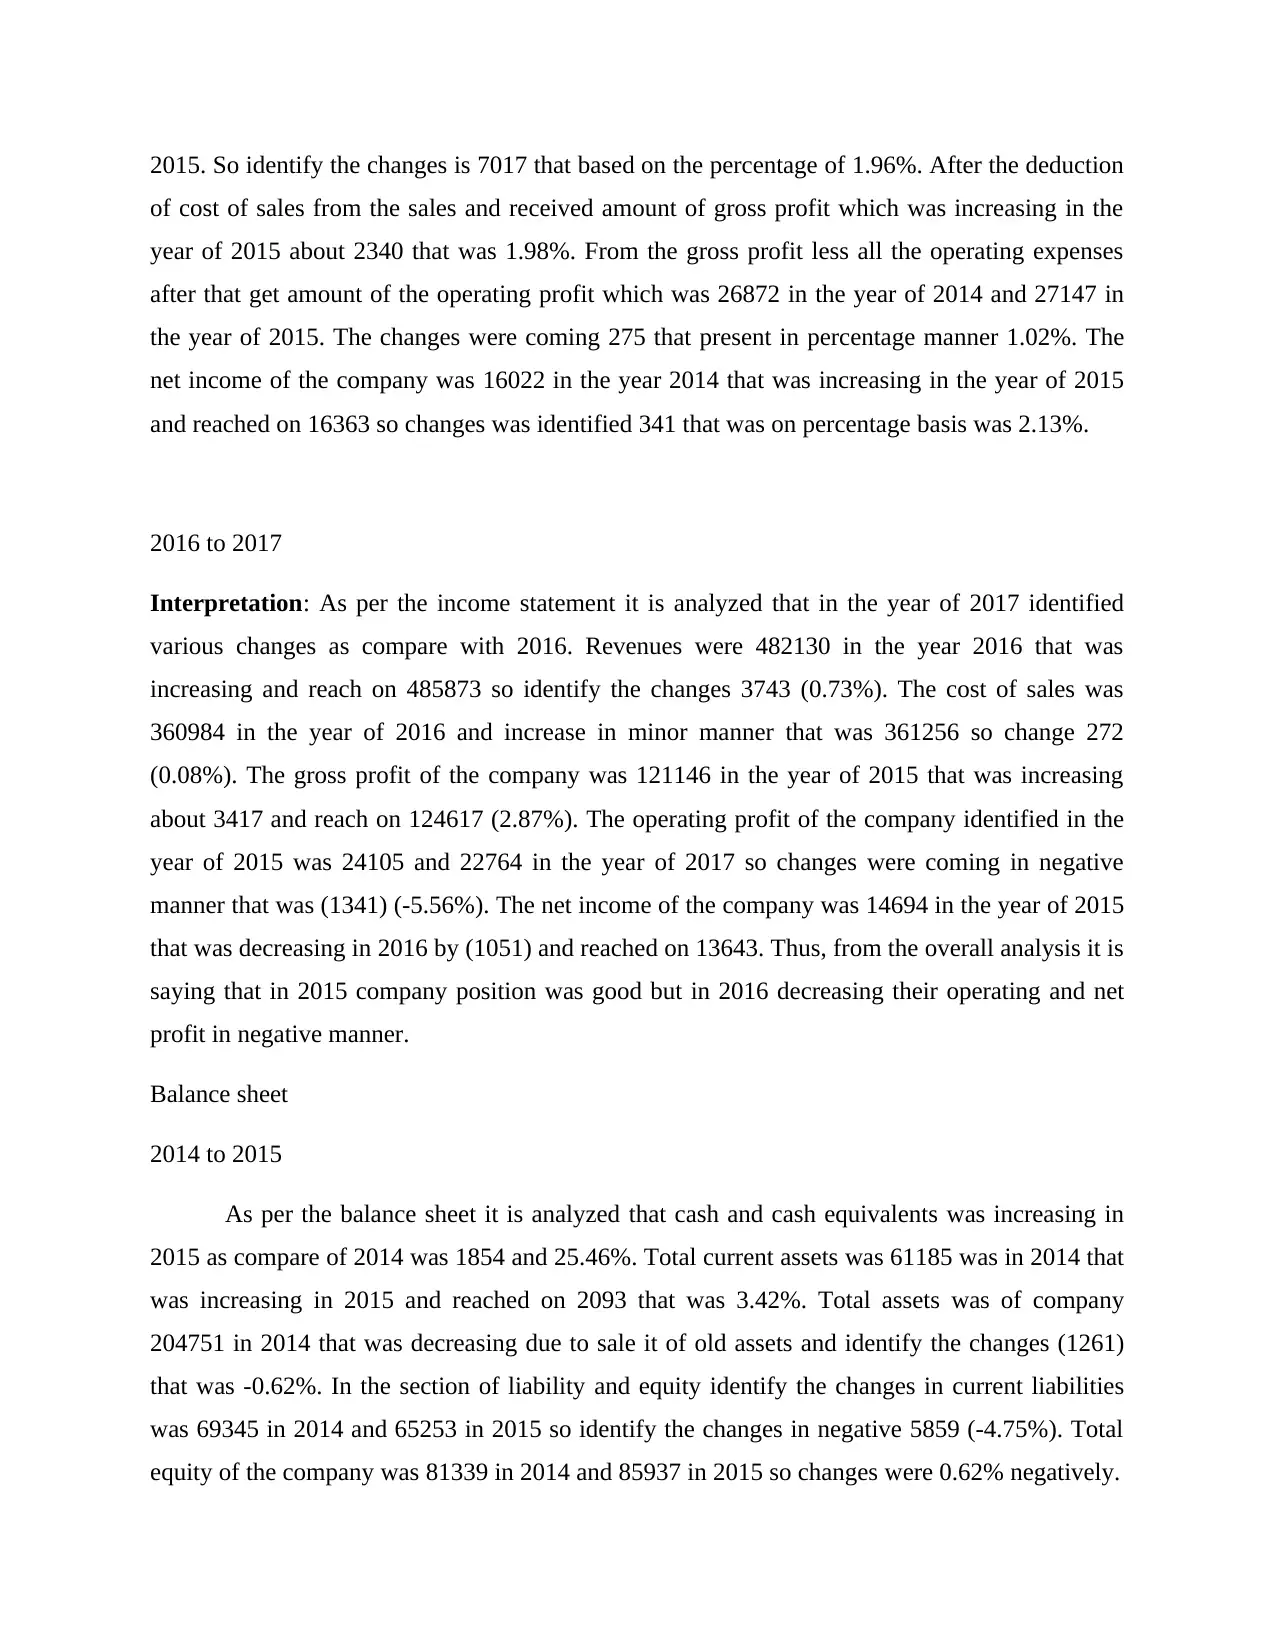
INTRODUCTION
The term financial analysis can be defined as a systematic process to study information of
produced financial statement of companies for a particular accounting period (AREAS, 2018).
By help of such analysis this becomes easier for firms to know own weaknesses and strengths.
The scenario of project report is that Asian food manufacturer wants to supply products to two
major supermarkets Wal-Mart and Tesco. For this purpose, detailed analysis of both entities has
been done in project report. The aim of such report is to recommend Asian food manufacturer in
order to decide which supermarket need to be selected for supply. The report includes
information about various kinds of techniques of financial analysis like horizontal, vertical and
ratio analysis. As well as working capital and cash flow analysis is also done for both of
companies.
MAIN BODY
Evaluation of the financial performance and financial position of Wal-Mart and Tesco.
In this task of report financial performance of both Wal-Mart and Tesco has been done as per
suitable techniques like as:
Horizontal analysis-
Horizontal method is used to evaluate statistical statistics, for example averages or line objects,
over many accounting cycles in a financial accounting analysis (Grennan and Michaely, 2019).
Horizontal regression may take absolute contrasts or percentages, where figures are represented
as a proportion of the sum in the baseline year in each following year and a baseline of 100
percent in the base year. This is called base-year research as well.
Income statement
2014 to 2015
As per the Horizontal analysis revenues of the Wal-Mart company is 476294 in the year of 2014
and 485651 in 2015. The change amount is 9357 and change percentage is 1.96%. Sales was
increasing in 2015 in little manner as compare of last year. For the comparison in between both
years analysis amount of cost of sales in 2014 which was 358069 and 365086 in the year of
⊘ This is a preview!⊘
Do you want full access?
Subscribe today to unlock all pages.
Trusted by 1+ million students worldwide
2015. So identify the changes is 7017 that based on the percentage of 1.96%. After the deduction
of cost of sales from the sales and received amount of gross profit which was increasing in the
year of 2015 about 2340 that was 1.98%. From the gross profit less all the operating expenses
after that get amount of the operating profit which was 26872 in the year of 2014 and 27147 in
the year of 2015. The changes were coming 275 that present in percentage manner 1.02%. The
net income of the company was 16022 in the year 2014 that was increasing in the year of 2015
and reached on 16363 so changes was identified 341 that was on percentage basis was 2.13%.
2016 to 2017
Interpretation: As per the income statement it is analyzed that in the year of 2017 identified
various changes as compare with 2016. Revenues were 482130 in the year 2016 that was
increasing and reach on 485873 so identify the changes 3743 (0.73%). The cost of sales was
360984 in the year of 2016 and increase in minor manner that was 361256 so change 272
(0.08%). The gross profit of the company was 121146 in the year of 2015 that was increasing
about 3417 and reach on 124617 (2.87%). The operating profit of the company identified in the
year of 2015 was 24105 and 22764 in the year of 2017 so changes were coming in negative
manner that was (1341) (-5.56%). The net income of the company was 14694 in the year of 2015
that was decreasing in 2016 by (1051) and reached on 13643. Thus, from the overall analysis it is
saying that in 2015 company position was good but in 2016 decreasing their operating and net
profit in negative manner.
Balance sheet
2014 to 2015
As per the balance sheet it is analyzed that cash and cash equivalents was increasing in
2015 as compare of 2014 was 1854 and 25.46%. Total current assets was 61185 was in 2014 that
was increasing in 2015 and reached on 2093 that was 3.42%. Total assets was of company
204751 in 2014 that was decreasing due to sale it of old assets and identify the changes (1261)
that was -0.62%. In the section of liability and equity identify the changes in current liabilities
was 69345 in 2014 and 65253 in 2015 so identify the changes in negative 5859 (-4.75%). Total
equity of the company was 81339 in 2014 and 85937 in 2015 so changes were 0.62% negatively.
Paraphrase This Document
Need a fresh take? Get an instant paraphrase of this document with our AI Paraphraser
2016 to 2017
In such time period, this can be inferred that company’s majority of assets are increasing
in a positive manner in year 2017 compared to 2016. This has been justified under prepared
horizontal analysis. While there are less number of liabilities which are increasing in a positive
manner. This shows that company’s condition has been good in year 2017.
Vertical analysis
Vertical analysis: This is known as a form of method in which each line element is listed as % of
basic amount within the statement. So line elements in an income statement can be considered as
a % of overall sales, on the other hands line elements in a balance sheet can be considered as %
of total amount of assets or liabilities (Šimonová, Čentéš and Beleš, 2019). In addition to this,
under cash flow statement each line element is taken as % of total cash inflows. With rationale to
above mentioned supermarkets this analysis has been done in such manner:
Income statement
As per the income statement of Wal-Mart apply vertical analysis where take revenues as 100
basis and identify the changes in different items that was included in profit and loss statement.
The cost of sales considers changes in compare of revenues that was 75.18, 75.17, 74.87 and
74.35 from 2014 to 2017 respectively. The gross profit of the company was increasing in lower
manner that was 24.82 in 2014 and reached on 25.65 in 2017. So there is identified lower
increment in the business activities. The operating profit of the company was decreasing because
of increasing operating expenses that impact on the profitability that was reaching on 4.69 in
2017 in compare of 2014 that was 5.64. The net income of the company was decreasing as
compare of 2014 to 2017 and reached on 2.81.
Balance sheet
For the horizontal analysis in Balance sheet require to take total assets as basis of 100 after that
analysis all the items for changing. Total current assets of the company was decreasing in low
manner when compare with total assets and get results 29.88, 31.10, 30.18 and 29.01
respectively from 2014 to 2017. It is analyses by fixed assets of the company was changing in
decreasing manner year by year and goodwill of the company was lower in compare of total
assets. It was 9.53, 8.90, 8.37 and 8.57 from 2014 to 2017 respectively. In the section of
Liabilities and equity take total liability as basis of 100 after that compare all the items with basis
and identify the changes in different years. Total current liabilities were 56.19, 55.51, 55.72 and
56.58 from 2014 to 2017.
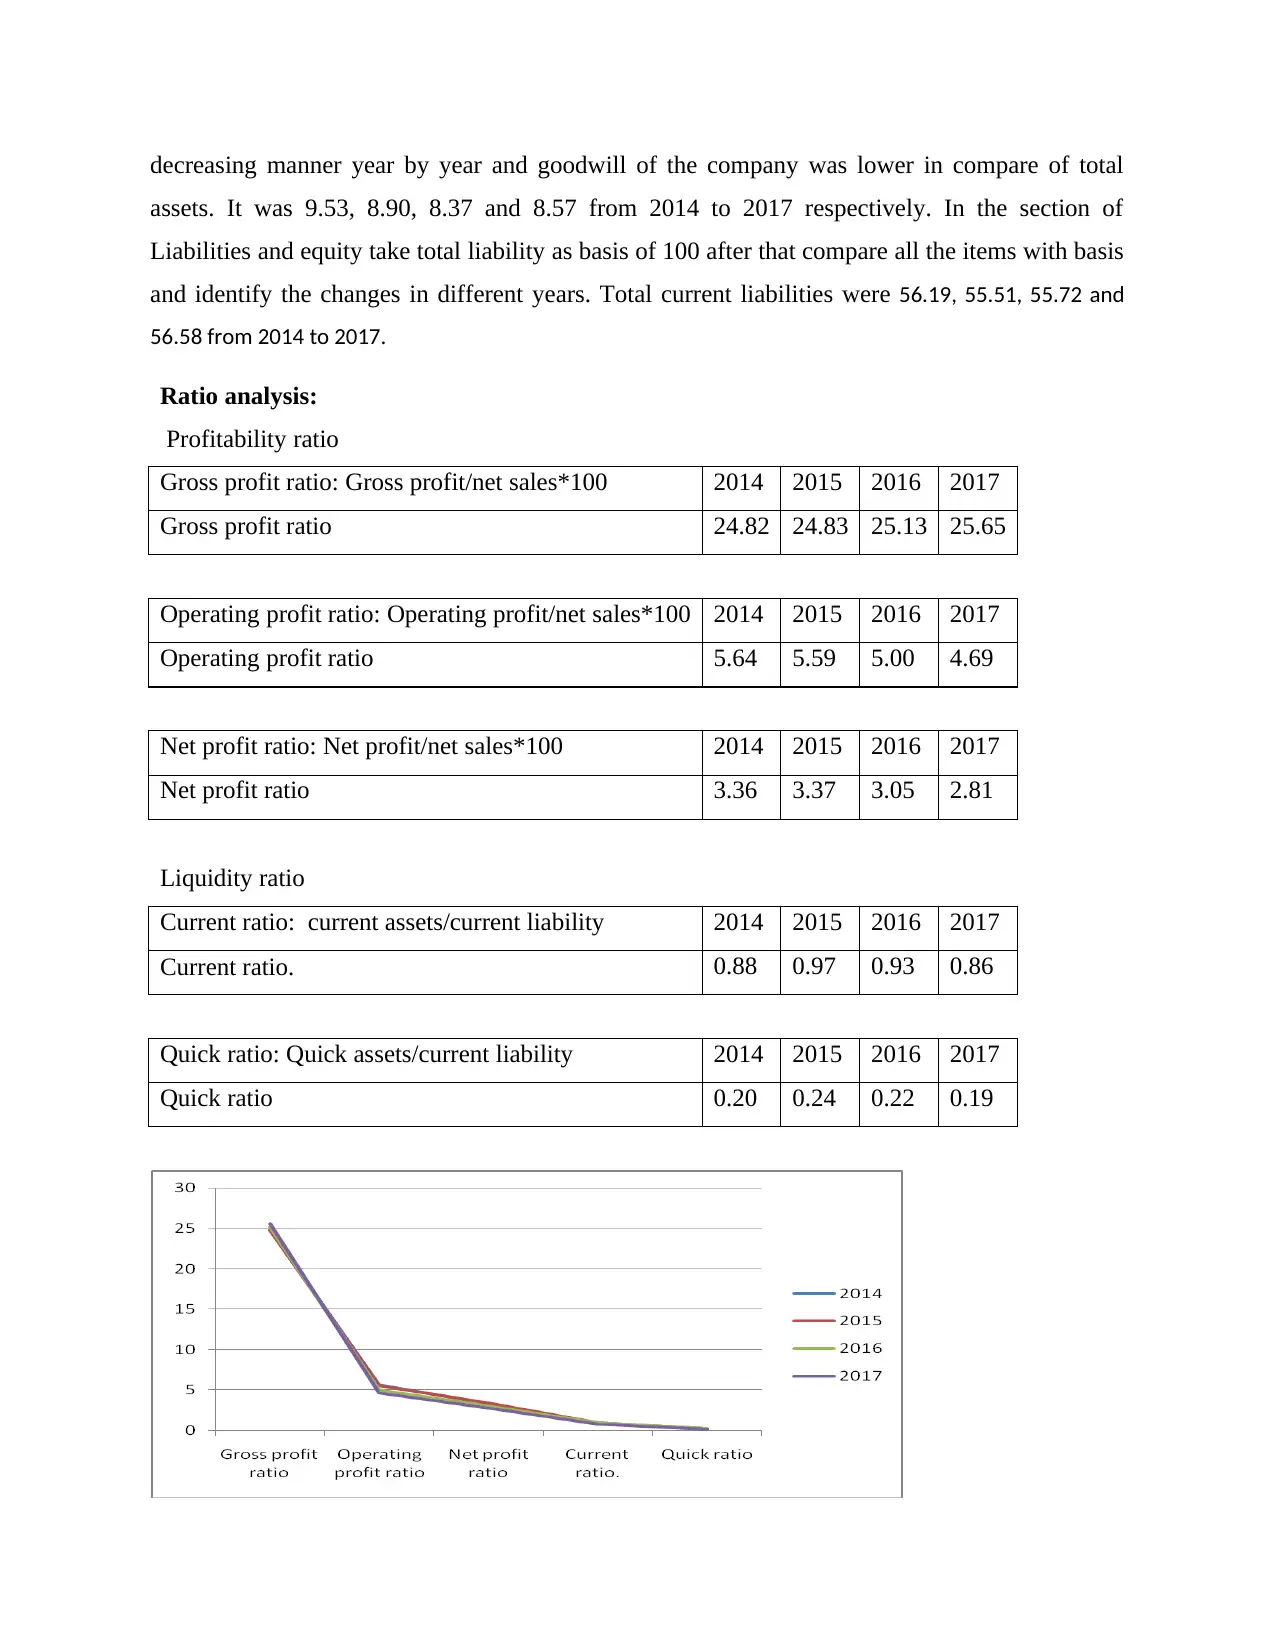
Ratio analysis:
Profitability ratio
Gross profit ratio: Gross profit/net sales*100 2014 2015 2016 2017
Gross profit ratio 24.82 24.83 25.13 25.65
Operating profit ratio: Operating profit/net sales*100 2014 2015 2016 2017
Operating profit ratio 5.64 5.59 5.00 4.69
Net profit ratio: Net profit/net sales*100 2014 2015 2016 2017
Net profit ratio 3.36 3.37 3.05 2.81
Liquidity ratio
Current ratio: current assets/current liability 2014 2015 2016 2017
Current ratio. 0.88 0.97 0.93 0.86
Quick ratio: Quick assets/current liability 2014 2015 2016 2017
Quick ratio 0.20 0.24 0.22 0.19
assets. It was 9.53, 8.90, 8.37 and 8.57 from 2014 to 2017 respectively. In the section of
Liabilities and equity take total liability as basis of 100 after that compare all the items with basis
and identify the changes in different years. Total current liabilities were 56.19, 55.51, 55.72 and
56.58 from 2014 to 2017.
Ratio analysis:
Profitability ratio
Gross profit ratio: Gross profit/net sales*100 2014 2015 2016 2017
Gross profit ratio 24.82 24.83 25.13 25.65
Operating profit ratio: Operating profit/net sales*100 2014 2015 2016 2017
Operating profit ratio 5.64 5.59 5.00 4.69
Net profit ratio: Net profit/net sales*100 2014 2015 2016 2017
Net profit ratio 3.36 3.37 3.05 2.81
Liquidity ratio
Current ratio: current assets/current liability 2014 2015 2016 2017
Current ratio. 0.88 0.97 0.93 0.86
Quick ratio: Quick assets/current liability 2014 2015 2016 2017
Quick ratio 0.20 0.24 0.22 0.19
⊘ This is a preview!⊘
Do you want full access?
Subscribe today to unlock all pages.
Trusted by 1+ million students worldwide
In accordance of above done ratio analysis, it can be stated that company’s performance is
decreasing under each profitability ratio. This is so because of more number of expenses and less
number of revenues. Like under each profitability ratio, company’s performance is dropping in
year 2017 compared to past years. Similar to this, liquidity ratio is also dropping in year 2017
compared to past years. As well as they are not able to meet ideal liquidity ratio.
Analysis of Tesco:
Vertical analysis-
Income statement:
Vertical review is the calculation and comparison of various financial statement line elements
using a consistent base number. The benefit for the year is the starting point for this study.
Taking at the sum of each of the estimated vertical figures (refer to section one), it is clear that
the least extraordinary amount is operating income, which would be 3% of the year's profit. The
fact that operational benefit is the lowest revenue part of the net income leads to the presumption
that financing and acquisitions yield more than the group's core financial operations. The higher
return part, property, is 137% of the income of each year, which is a strong operating result.
When we study these figures more closely, it can be found that the overall profit, 81% of the
profit, has been generated after the critical effect of revenue expense, which constitutes 181% of
the profit. Expenditures on administration stand at 15%. All these considerations lead to a
reduction in operating profit to just 3%.
From 2014 to 2017, the overall tax rate was 87 percent of earnings. It was at 100 percent in 2014,
slashing the company's earnings in half. Tax was 270 percent of earnings in 2016, eliminating
profit in cumulative fractions. When the confidence interval of the income statement elements is
examined from 2014 to 2017, it is clear that the finance expense is the most unpredictable
variable. Standing directly behind would be tax, which sits at an eye-watering 81 percent, while
rent from real estate stands at 68 percent.
Paraphrase This Document
Need a fresh take? Get an instant paraphrase of this document with our AI Paraphraser
Balance sheet-
From 2014 to 2017, the total of net current liabilities was 475 percent of net assets. The
company's net current liabilities are often more than 400% higher than its overall net assets,
indicating a problem. Net non-current liabilities account for 344 percent of total liabilities on
aggregate, while total liabilities account for 775 percent. In contrast, the estimated ratio of total
non-existing assets to total assets is about 250 percent - 300 percent. The above data suggests
that the capital structure is largely reliant on debt. The value of the accounting records to the
lenders is very little, meaning that the borrowers own the bulk of the yields and prices of the
securities. This shows a considerable gear ratio. If the existing liabilities of a corporation or
entity are heavily incurred, the bulk of current asset is responsible for a majority of the return on
debt maintenance. The largest share of existing assets is stock, averaging 72%. This means that
debt servicing is due to the gains made from the transactions as seen in the above portion.
Horizontal analysis-
Income statement
Benefit from property-related products, financing costs, administrative costs, profit, and EPS all
seem to follow a similar trend, with a dip in 2015. Profits from many other organizations seem to
provide a continuous distribution of returns. The cost of revenue seems to have decreased in
2015, although profit before tax increased dramatically. It is clear from the foregoing that, while
profit before tax rose in 2015 due to lower cost of sales, the net profit was severely by financing
and administrative costs, as well as a decrease in property yields. Property is a significant
contributor to net earnings, with a greater impact than operating profit. Property has greater
control than operating profit as a core indicator of net profit and is able to determine how the
company's profit is directed.
Balance sheet
As shown by the above, net current liabilities appear to be the primary influencer of total equity.
The year 2014 appears to be the peak for existing liabilities. Based on the evidence from the
preceding study, it can be inferred that the financial leverage for 2014 has weighed down the
income statement for 2015. As a result, once the irregular disparity of non-existing liabilities is
neutralized in 2015, the non-current liability and interest expense merge. Non-current assets
appear to be the lowest boiling balance-sheet component, followed quickly by current assets.
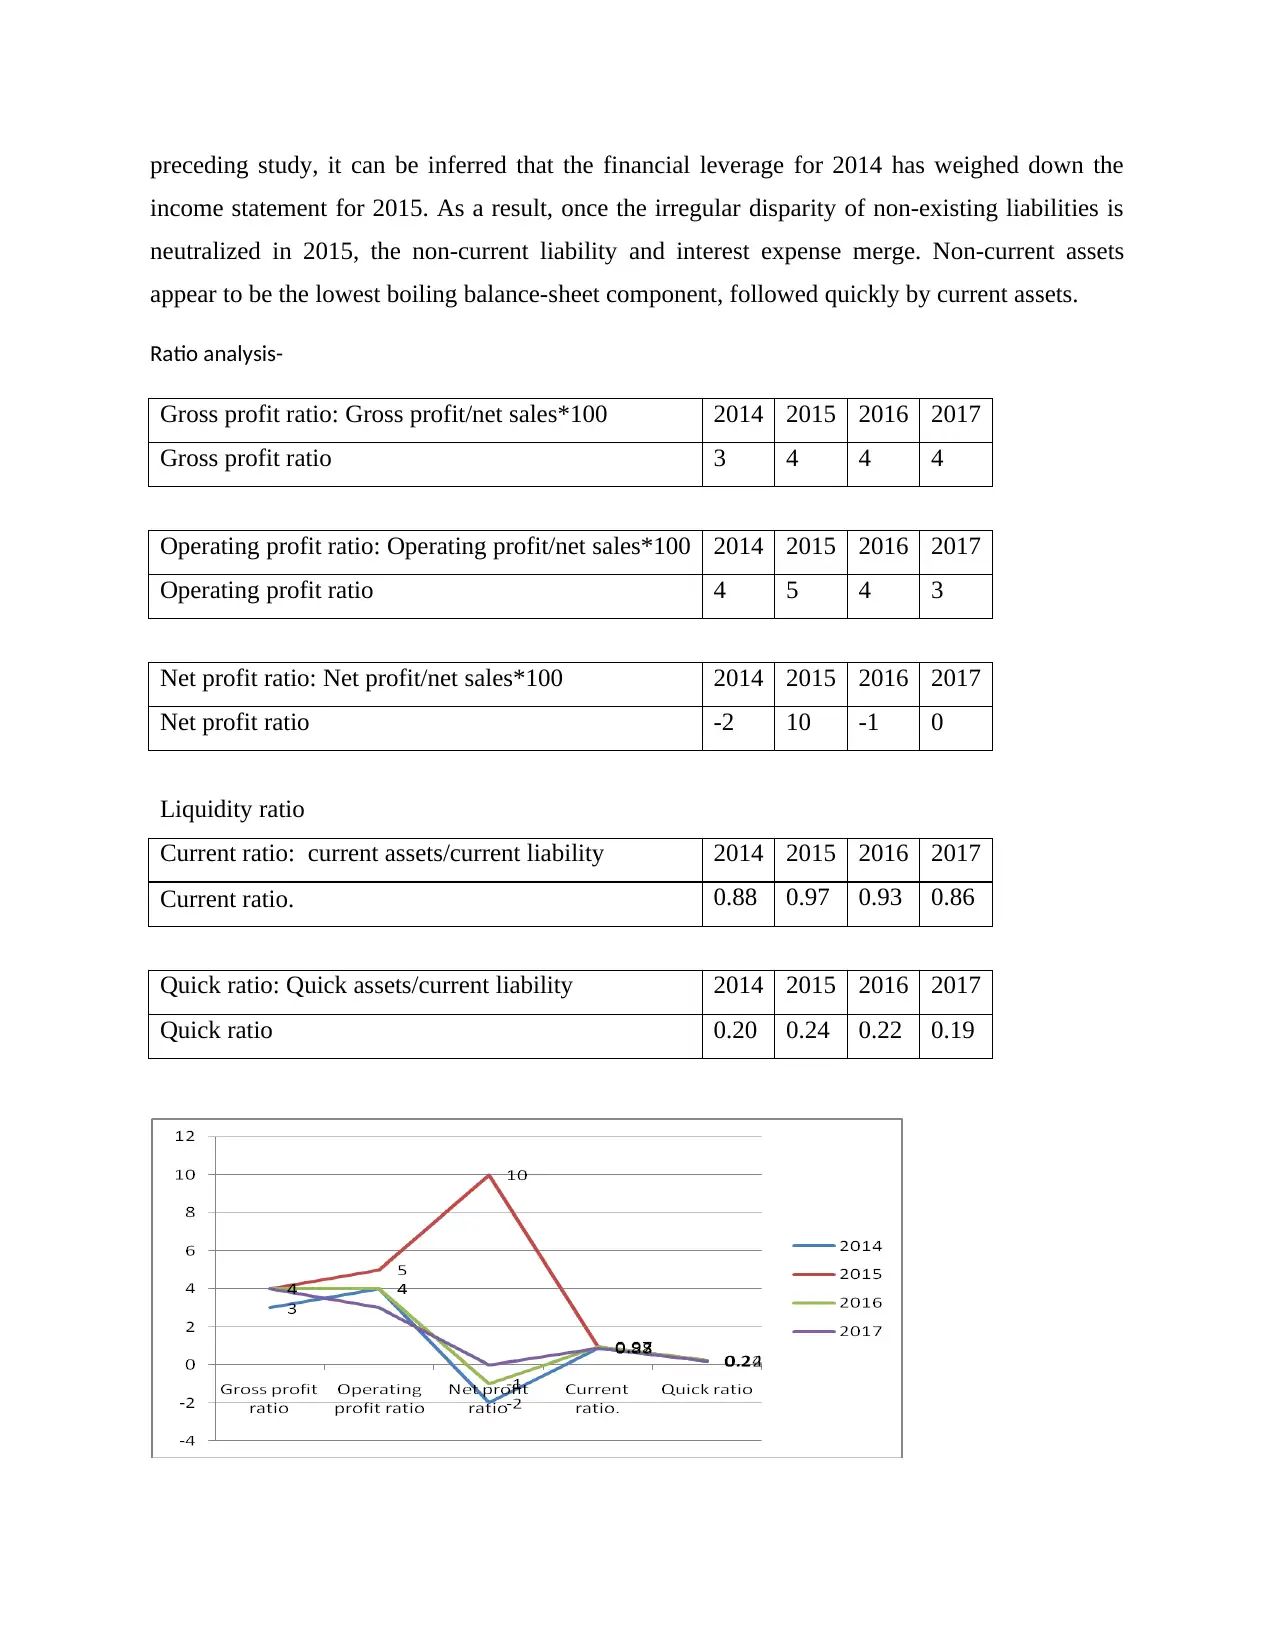
Ratio analysis-
Gross profit ratio: Gross profit/net sales*100 2014 2015 2016 2017
Gross profit ratio 3 4 4 4
Operating profit ratio: Operating profit/net sales*100 2014 2015 2016 2017
Operating profit ratio 4 5 4 3
Net profit ratio: Net profit/net sales*100 2014 2015 2016 2017
Net profit ratio -2 10 -1 0
Liquidity ratio
Current ratio: current assets/current liability 2014 2015 2016 2017
Current ratio. 0.88 0.97 0.93 0.86
Quick ratio: Quick assets/current liability 2014 2015 2016 2017
Quick ratio 0.20 0.24 0.22 0.19
income statement for 2015. As a result, once the irregular disparity of non-existing liabilities is
neutralized in 2015, the non-current liability and interest expense merge. Non-current assets
appear to be the lowest boiling balance-sheet component, followed quickly by current assets.
Ratio analysis-
Gross profit ratio: Gross profit/net sales*100 2014 2015 2016 2017
Gross profit ratio 3 4 4 4
Operating profit ratio: Operating profit/net sales*100 2014 2015 2016 2017
Operating profit ratio 4 5 4 3
Net profit ratio: Net profit/net sales*100 2014 2015 2016 2017
Net profit ratio -2 10 -1 0
Liquidity ratio
Current ratio: current assets/current liability 2014 2015 2016 2017
Current ratio. 0.88 0.97 0.93 0.86
Quick ratio: Quick assets/current liability 2014 2015 2016 2017
Quick ratio 0.20 0.24 0.22 0.19
⊘ This is a preview!⊘
Do you want full access?
Subscribe today to unlock all pages.
Trusted by 1+ million students worldwide
Above company’s performance is too poor under each year as they are not able to produce
enough outcomes. Like in net margin their ratio is negative as well as liquidity ratios are also
below idea ratio. The rationale behind this can be due to ineffective management of income and
expenses.
Evaluation of working capital:
Working capital is a predictor of the liquidity, operating performance and brief future prosperity
of a business. If an organization has significant healthy working capital, this should have
investment and growth opportunities (Chang and Zeng, 2019). If current assets of a corporation
may not outweigh existing liabilities, it can have problems with creditors rising or repaying, or
even failing. Working capital that is equal to or better than the market average for a business of
similar quality is typically known as sufficient. A lack of working capital may mean a risk of
financial hardship or default.
Working capital management is critical to a company's underlying financial stability and
organizational performance. The ability to use financial performance to keep a steady balance
between productivity, productivity, and flexibility is a result of good business administration
(Schroeder, Clark and Cathey, 2019). In its normal activities, a company uses working capital;
capital structure differs from the existing assets of a company and current obligations or debts.
Working capital is a criterion for the efficiency and financial stability of an organization in the
near term. The working capital ratio, divided by existing liabilities, shows the appropriate cash
balance for a corporation to fund short-term obligations and expenditures.
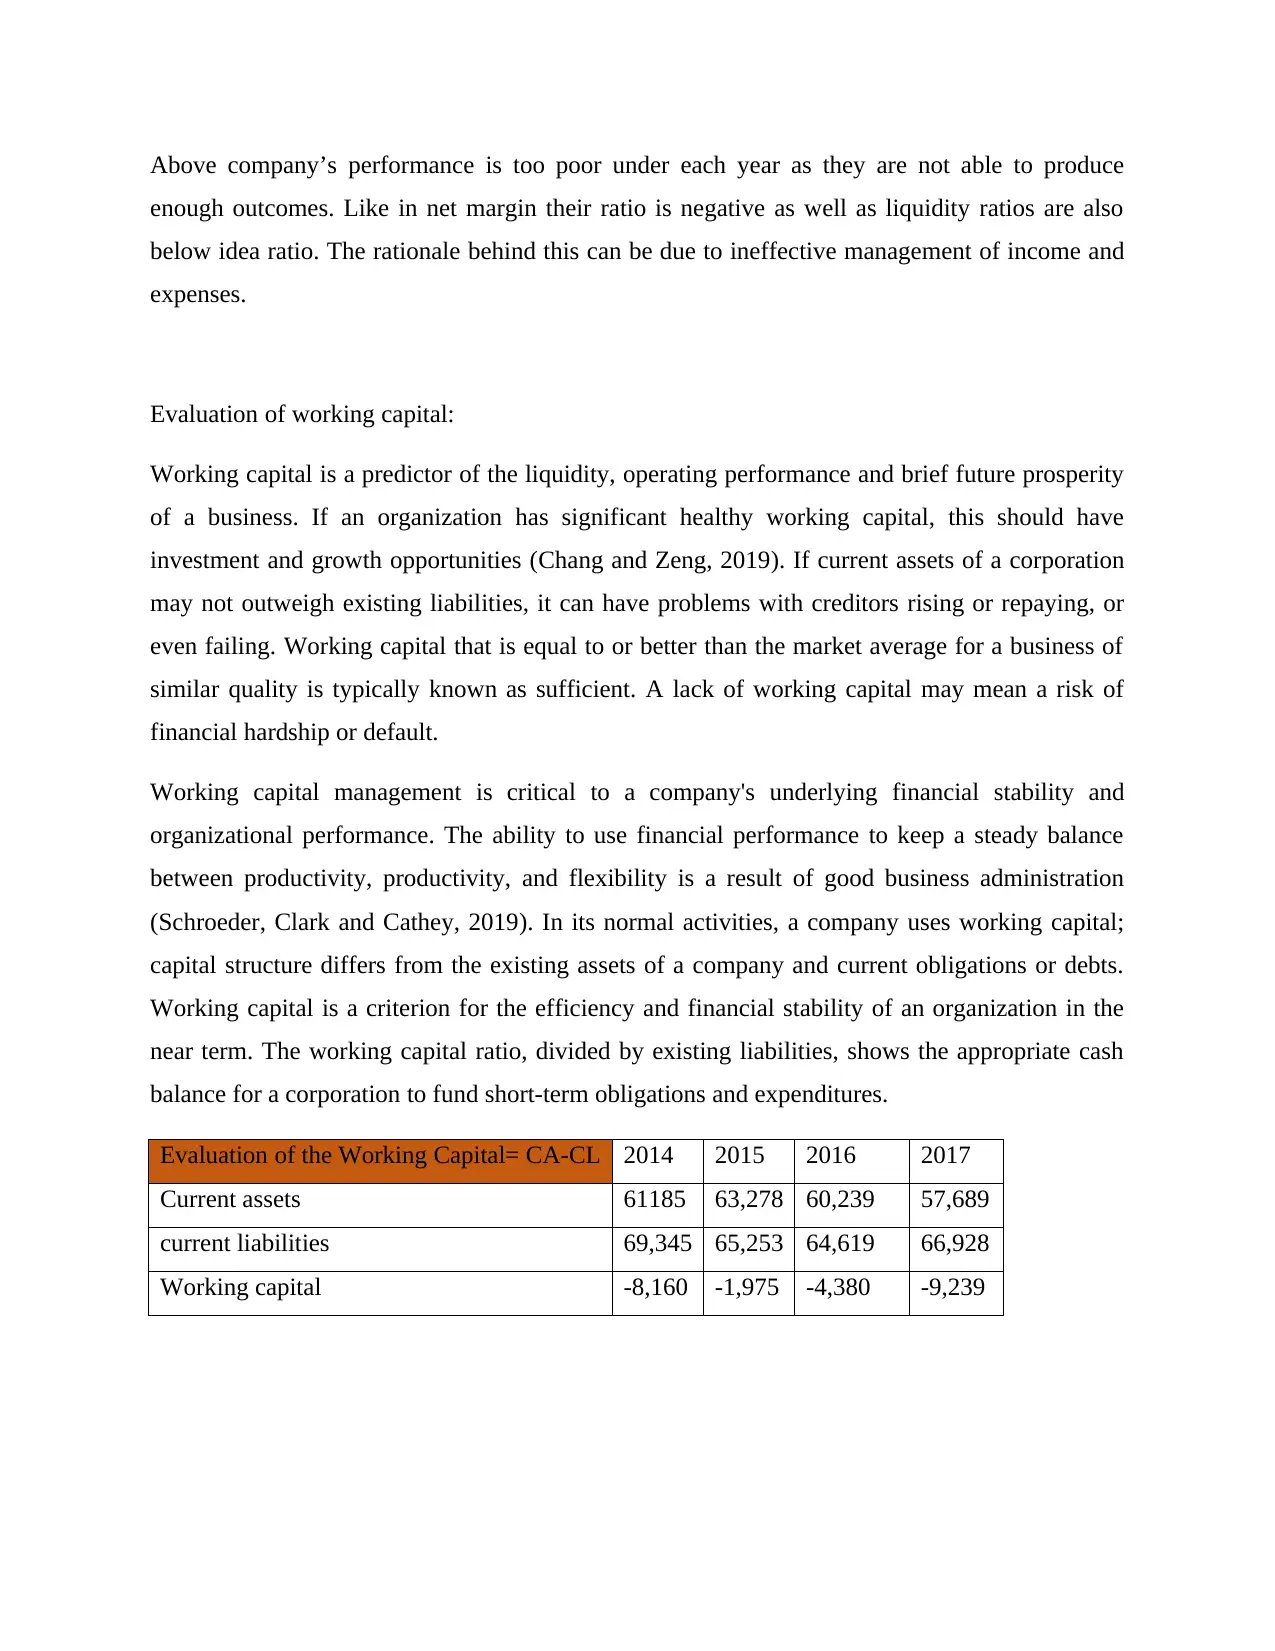
Evaluation of the Working Capital= CA-CL 2014 2015 2016 2017
Current assets 61185 63,278 60,239 57,689
current liabilities 69,345 65,253 64,619 66,928
Working capital -8,160 -1,975 -4,380 -9,239
enough outcomes. Like in net margin their ratio is negative as well as liquidity ratios are also
below idea ratio. The rationale behind this can be due to ineffective management of income and
expenses.
Evaluation of working capital:
Working capital is a predictor of the liquidity, operating performance and brief future prosperity
of a business. If an organization has significant healthy working capital, this should have
investment and growth opportunities (Chang and Zeng, 2019). If current assets of a corporation
may not outweigh existing liabilities, it can have problems with creditors rising or repaying, or
even failing. Working capital that is equal to or better than the market average for a business of
similar quality is typically known as sufficient. A lack of working capital may mean a risk of
financial hardship or default.
Working capital management is critical to a company's underlying financial stability and
organizational performance. The ability to use financial performance to keep a steady balance
between productivity, productivity, and flexibility is a result of good business administration
(Schroeder, Clark and Cathey, 2019). In its normal activities, a company uses working capital;
capital structure differs from the existing assets of a company and current obligations or debts.
Working capital is a criterion for the efficiency and financial stability of an organization in the
near term. The working capital ratio, divided by existing liabilities, shows the appropriate cash
balance for a corporation to fund short-term obligations and expenditures.
Evaluation of the Working Capital= CA-CL 2014 2015 2016 2017
Current assets 61185 63,278 60,239 57,689
current liabilities 69,345 65,253 64,619 66,928
Working capital -8,160 -1,975 -4,380 -9,239
Paraphrase This Document
Need a fresh take? Get an instant paraphrase of this document with our AI Paraphraser
In accordance of above done analysis, this can be stated that above company’s performance is
weak in terms of working capital. This has been justified by above table in which under each
year company is not able to produce enough working capital due to higher number of current
liabilities and less number of current assets.
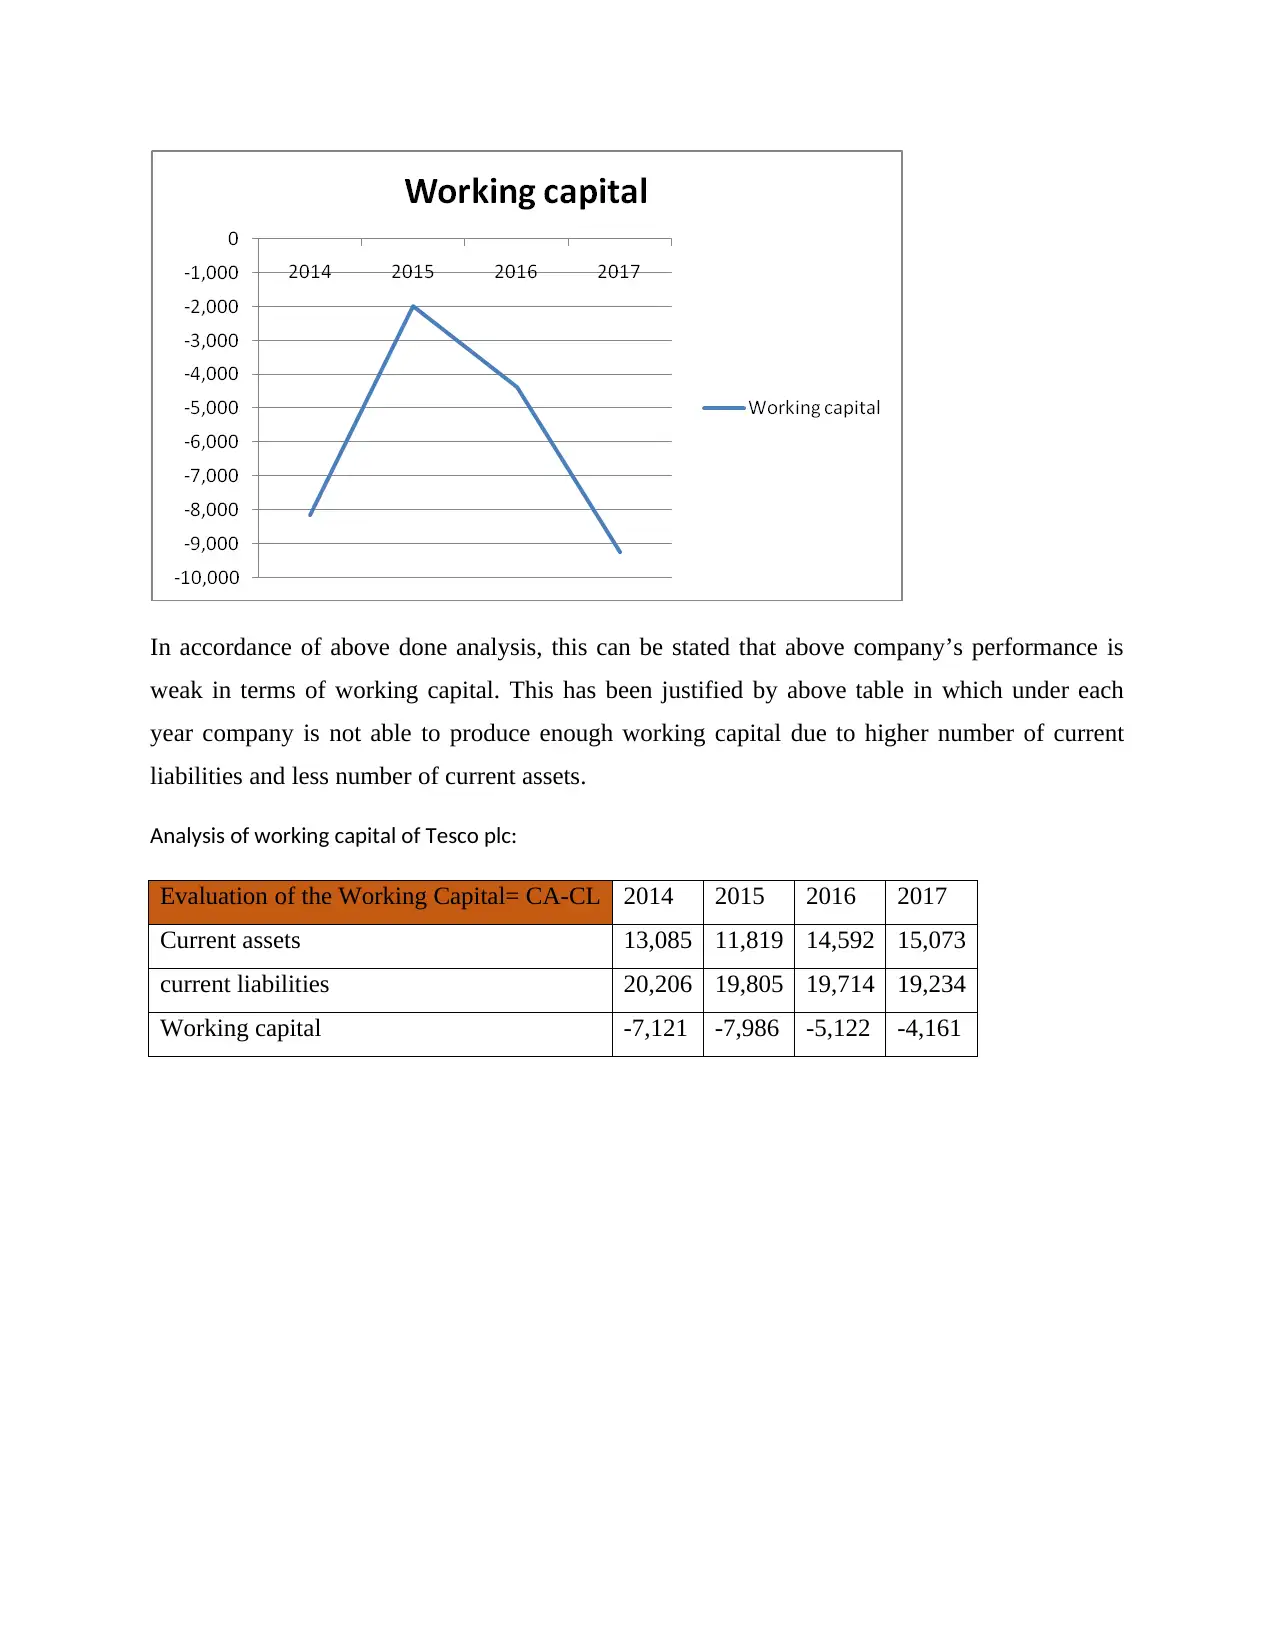
Analysis of working capital of Tesco plc:
Evaluation of the Working Capital= CA-CL 2014 2015 2016 2017
Current assets 13,085 11,819 14,592 15,073
current liabilities 20,206 19,805 19,714 19,234
Working capital -7,121 -7,986 -5,122 -4,161
weak in terms of working capital. This has been justified by above table in which under each
year company is not able to produce enough working capital due to higher number of current
liabilities and less number of current assets.
Analysis of working capital of Tesco plc:
Evaluation of the Working Capital= CA-CL 2014 2015 2016 2017
Current assets 13,085 11,819 14,592 15,073
current liabilities 20,206 19,805 19,714 19,234
Working capital -7,121 -7,986 -5,122 -4,161
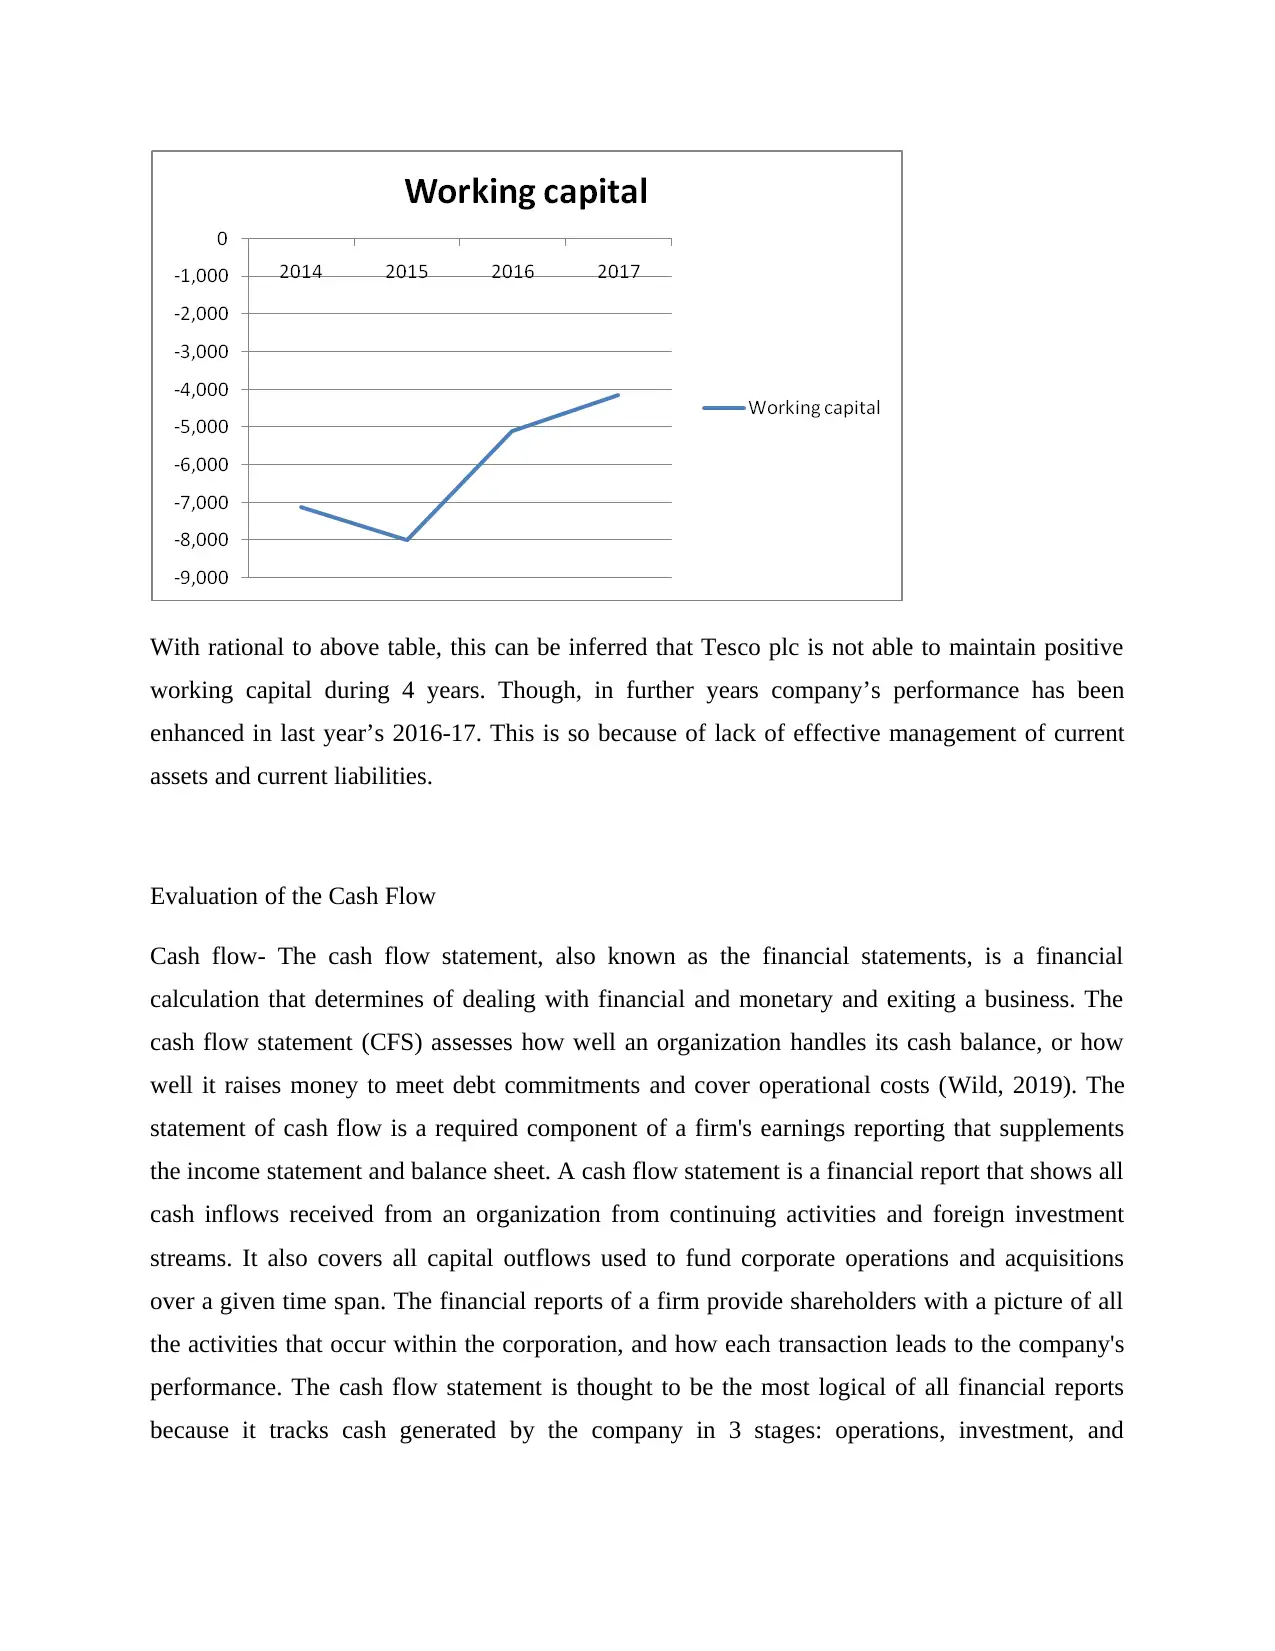
With rational to above table, this can be inferred that Tesco plc is not able to maintain positive
working capital during 4 years. Though, in further years company’s performance has been
enhanced in last year’s 2016-17. This is so because of lack of effective management of current
assets and current liabilities.
Evaluation of the Cash Flow
Cash flow- The cash flow statement, also known as the financial statements, is a financial
calculation that determines of dealing with financial and monetary and exiting a business. The
cash flow statement (CFS) assesses how well an organization handles its cash balance, or how
well it raises money to meet debt commitments and cover operational costs (Wild, 2019). The
statement of cash flow is a required component of a firm's earnings reporting that supplements
the income statement and balance sheet. A cash flow statement is a financial report that shows all
cash inflows received from an organization from continuing activities and foreign investment
streams. It also covers all capital outflows used to fund corporate operations and acquisitions
over a given time span. The financial reports of a firm provide shareholders with a picture of all
the activities that occur within the corporation, and how each transaction leads to the company's
performance. The cash flow statement is thought to be the most logical of all financial reports
because it tracks cash generated by the company in 3 stages: operations, investment, and
⊘ This is a preview!⊘
Do you want full access?
Subscribe today to unlock all pages.
Trusted by 1+ million students worldwide
1 out of 19
Related Documents


Your All-in-One AI-Powered Toolkit for Academic Success.
+13062052269
info@desklib.com
Available 24*7 on WhatsApp / Email
![[object Object]](/_next/static/media/star-bottom.7253800d.svg)
Unlock your academic potential
Copyright © 2020–2026 A2Z Services. All Rights Reserved. Developed and managed by ZUCOL.