Managerial Finance Report: Company Performance, Ratios and Investment
VerifiedAdded on 2023/01/17
|17
|4009
|20
Report
AI Summary
This report delves into managerial finance, comparing the financial performance of Reckitt Benckiser Group Plc and Glaxo Smith Kline Plc. It begins with a comprehensive calculation of ten key financial ratios, including current ratio, quick ratio, net profit margin, gross profit margin, gearing ratio, P/E ratio, earnings per share, return on capital employed, average inventories turnover period, and dividend payout ratio for both companies across two years. The analysis then presents a comparative assessment of the companies' performance, financial positions, and investment potential, using charts to illustrate the trends of the calculated ratios. Based on the ratio analysis, recommendations are provided to improve the financial performance of the underperforming company, alongside a discussion of the limitations of relying solely on financial ratios for company interpretation. The report further explores investment appraisal techniques, advising senior management on project selection and discussing the limitations of these techniques in long-term decision-making. The conclusion synthesizes the findings, providing a final assessment and recommendations based on the financial analysis conducted.

Managerial Finance
Paraphrase This Document
Need a fresh take? Get an instant paraphrase of this document with our AI Paraphraser
Table of Contents
INTRODUCTION...........................................................................................................................1
PORTFOLIO 1.................................................................................................................................1
a. Calculation of 10 different financial ratios..............................................................................1
b. Analysis of the performance, financial position and investment potential..............................4
c. Recommendation of the way in which financial performance of the poorly performing
business can be improved............................................................................................................9
d. Discussion of the limitation of relaying on financial ratios to interpret a company's
performance...............................................................................................................................10
PORTFOLIO 2...............................................................................................................................10
a. Use of appropriate investment appraisal techniques and advise to senior management on
whether project a or b should be selected..................................................................................10
b. Discussion of limitation of using investment appraisal technique to help in long term
decision making.........................................................................................................................13
CONCLUSION..............................................................................................................................13
REFERENCES..............................................................................................................................15
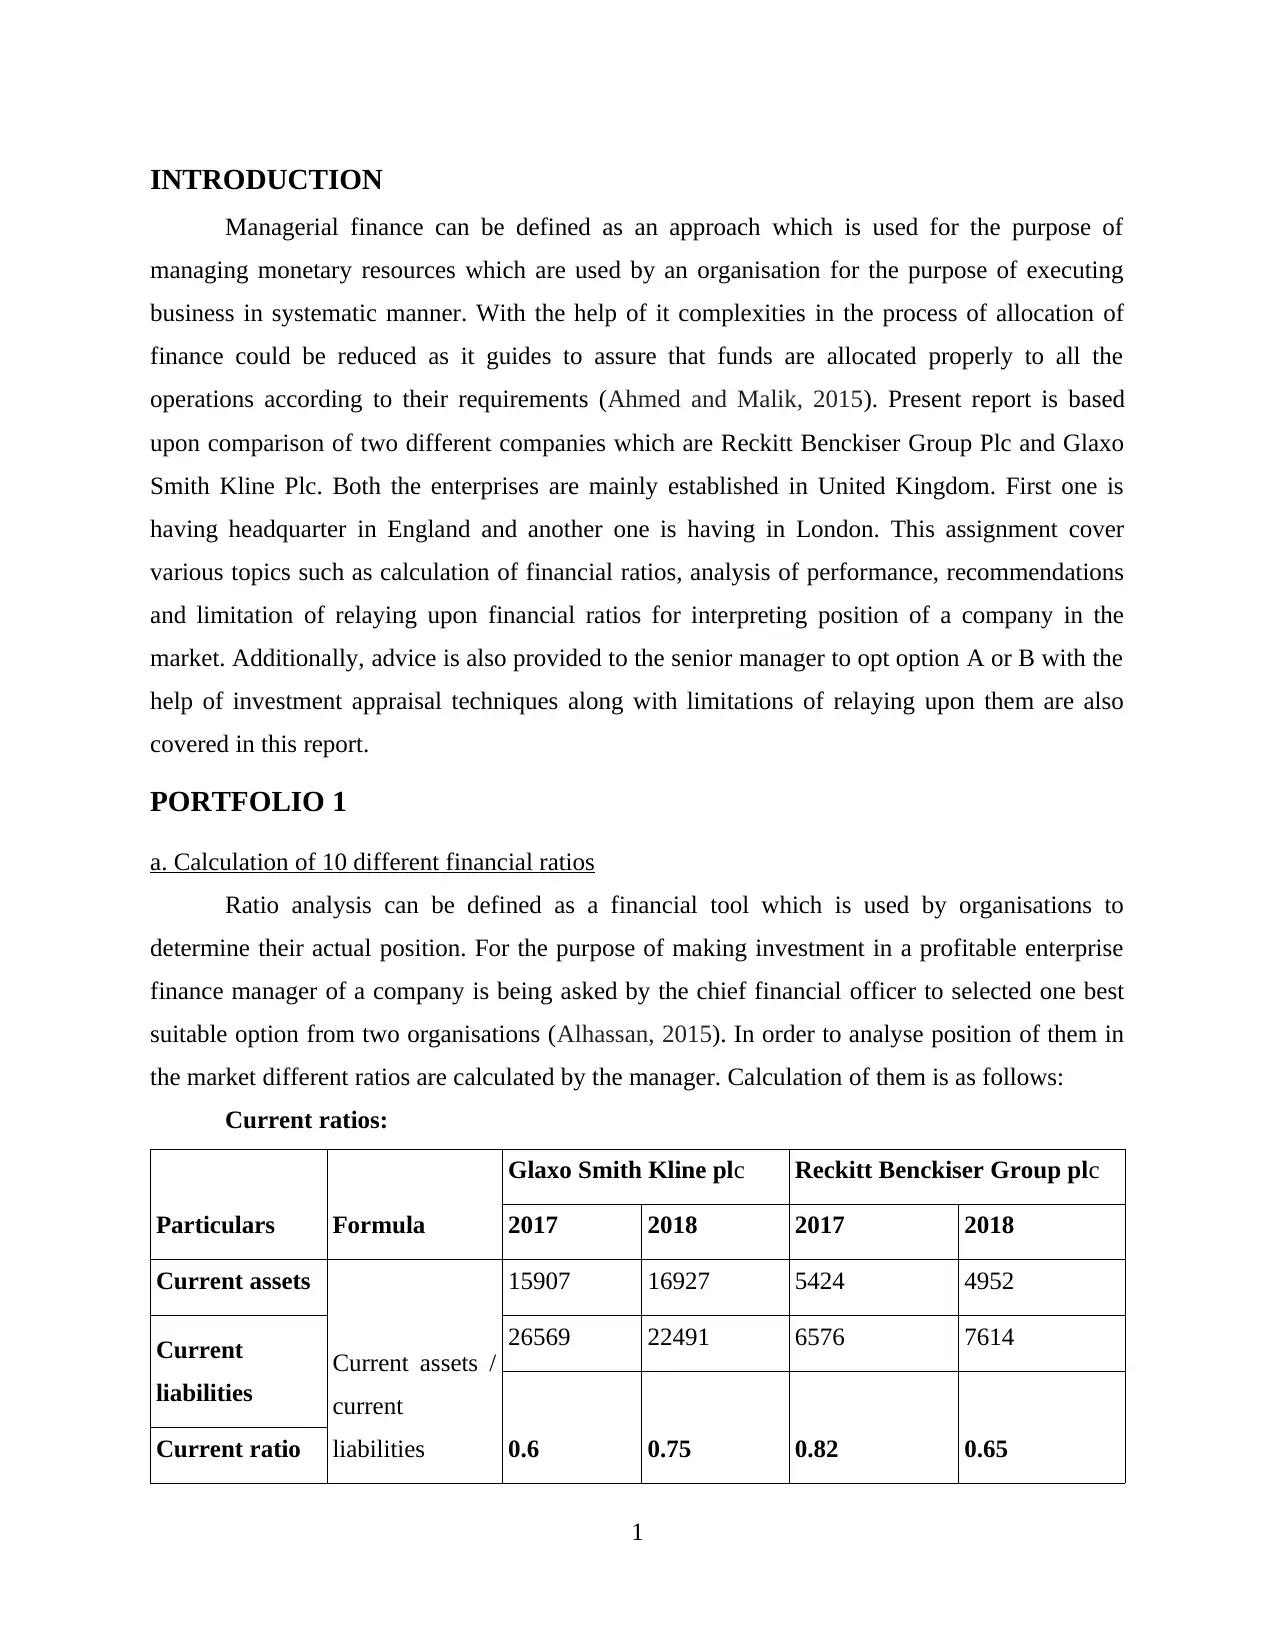
INTRODUCTION
Managerial finance can be defined as an approach which is used for the purpose of
managing monetary resources which are used by an organisation for the purpose of executing
business in systematic manner. With the help of it complexities in the process of allocation of
finance could be reduced as it guides to assure that funds are allocated properly to all the
operations according to their requirements (Ahmed and Malik, 2015). Present report is based
upon comparison of two different companies which are Reckitt Benckiser Group Plc and Glaxo
Smith Kline Plc. Both the enterprises are mainly established in United Kingdom. First one is
having headquarter in England and another one is having in London. This assignment cover
various topics such as calculation of financial ratios, analysis of performance, recommendations
and limitation of relaying upon financial ratios for interpreting position of a company in the
market. Additionally, advice is also provided to the senior manager to opt option A or B with the
help of investment appraisal techniques along with limitations of relaying upon them are also
covered in this report.
PORTFOLIO 1
a. Calculation of 10 different financial ratios
Ratio analysis can be defined as a financial tool which is used by organisations to
determine their actual position. For the purpose of making investment in a profitable enterprise
finance manager of a company is being asked by the chief financial officer to selected one best
suitable option from two organisations (Alhassan, 2015). In order to analyse position of them in
the market different ratios are calculated by the manager. Calculation of them is as follows:
Current ratios:
Particulars Formula
Glaxo Smith Kline plc Reckitt Benckiser Group plc
2017 2018 2017 2018
Current assets
Current assets /
current
liabilities
15907 16927 5424 4952
Current
liabilities
26569 22491 6576 7614
0.6 0.75 0.82 0.65Current ratio
1
⊘ This is a preview!⊘
Do you want full access?
Subscribe today to unlock all pages.
Trusted by 1+ million students worldwide
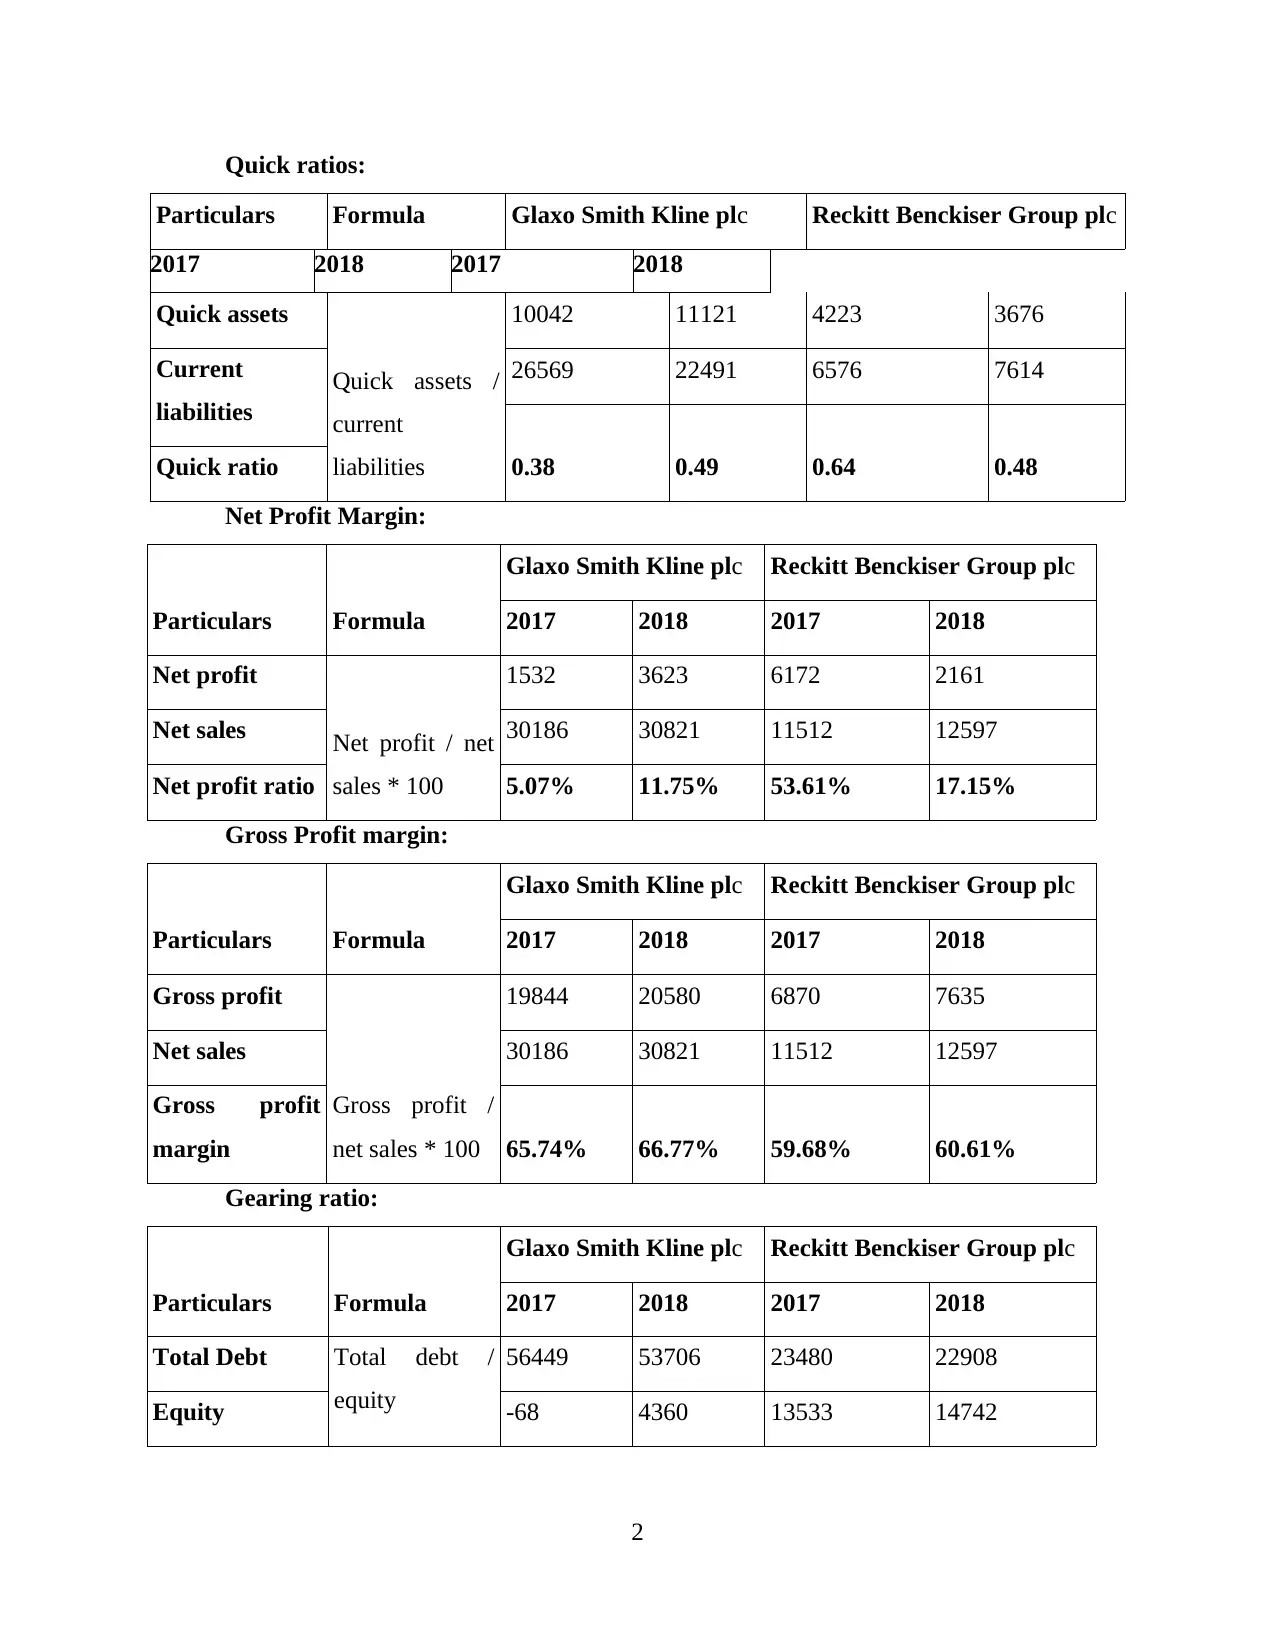
Quick ratios:
Particulars Formula Glaxo Smith Kline plc Reckitt Benckiser Group plc
2017 2018 2017 2018
Quick assets
Quick assets /
current
liabilities
10042 11121 4223 3676
Current
liabilities
26569 22491 6576 7614
0.38 0.49 0.64 0.48Quick ratio
Net Profit Margin:
Particulars Formula
Glaxo Smith Kline plc Reckitt Benckiser Group plc
2017 2018 2017 2018
Net profit
Net profit / net
sales * 100
1532 3623 6172 2161
Net sales 30186 30821 11512 12597
Net profit ratio 5.07% 11.75% 53.61% 17.15%
Gross Profit margin:
Particulars Formula
Glaxo Smith Kline plc Reckitt Benckiser Group plc
2017 2018 2017 2018
Gross profit
Gross profit /
net sales * 100
19844 20580 6870 7635
Net sales 30186 30821 11512 12597
Gross profit
margin 65.74% 66.77% 59.68% 60.61%
Gearing ratio:
Particulars Formula
Glaxo Smith Kline plc Reckitt Benckiser Group plc
2017 2018 2017 2018
Total Debt Total debt /
equity
56449 53706 23480 22908
Equity -68 4360 13533 14742
2
Paraphrase This Document
Need a fresh take? Get an instant paraphrase of this document with our AI Paraphraser
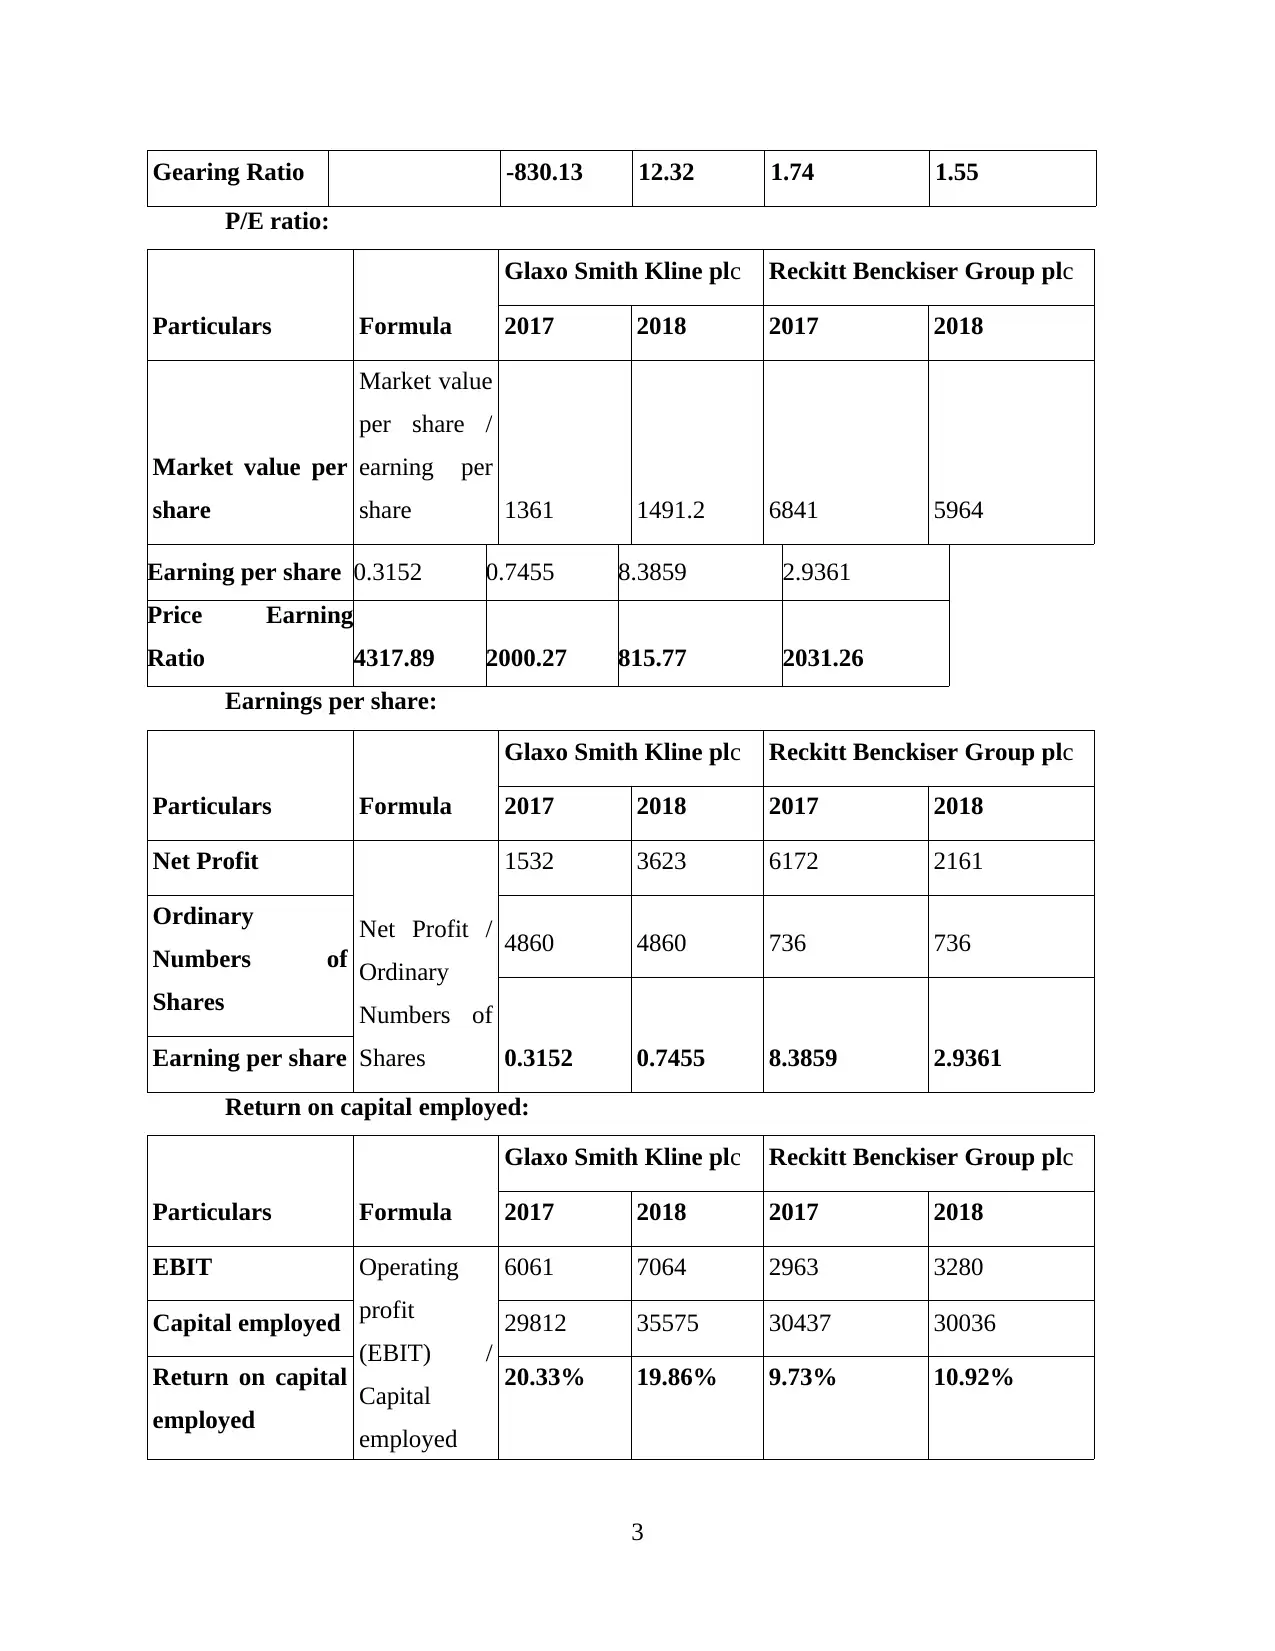
Gearing Ratio -830.13 12.32 1.74 1.55
P/E ratio:
Particulars Formula
Glaxo Smith Kline plc Reckitt Benckiser Group plc
2017 2018 2017 2018
Market value per
share
Market value
per share /
earning per
share 1361 1491.2 6841 5964
Earning per share 0.3152 0.7455 8.3859 2.9361
Price Earning
Ratio 4317.89 2000.27 815.77 2031.26
Earnings per share:
Particulars Formula
Glaxo Smith Kline plc Reckitt Benckiser Group plc
2017 2018 2017 2018
Net Profit
Net Profit /
Ordinary
Numbers of
Shares
1532 3623 6172 2161
Ordinary
Numbers of
Shares
4860 4860 736 736
0.3152 0.7455 8.3859 2.9361Earning per share
Return on capital employed:
Particulars Formula
Glaxo Smith Kline plc Reckitt Benckiser Group plc
2017 2018 2017 2018
EBIT Operating
profit
(EBIT) /
Capital
employed
6061 7064 2963 3280
Capital employed 29812 35575 30437 30036
Return on capital
employed
20.33% 19.86% 9.73% 10.92%
3
Average inventories turnover period:
Particulars Formula
Glaxo Smith Kline plc Reckitt Benckiser Group plc
2017 2018 2017 2018
Average stock Average
stock / Cost
of goods
sold * 365
days
5557 5476 1201 1276
Cost of goods sold 10342 10241 4642 4962
Average
inventory turn
over days 196 195 94 93.86
Dividend payout ratio:
Particulars Formula
Glaxo Smith Kline plc Reckitt Benckiser Group plc
2017 2018 2017 2018
Dividend paid
Dividend
paid / Net
income
3906 3927 1134 1187
Net income 1532 3623 6172 2161
Dividend payout
ratio 2.55 1.08 0.18 0.55
b. Analysis of the performance, financial position and investment potential
For the purpose of analysing the performance of Glaxo Smith Kline Plc and Reckitt
Benckiser Group Plc charts are formed on the basis of calculated ratios. All of them are as
follows:
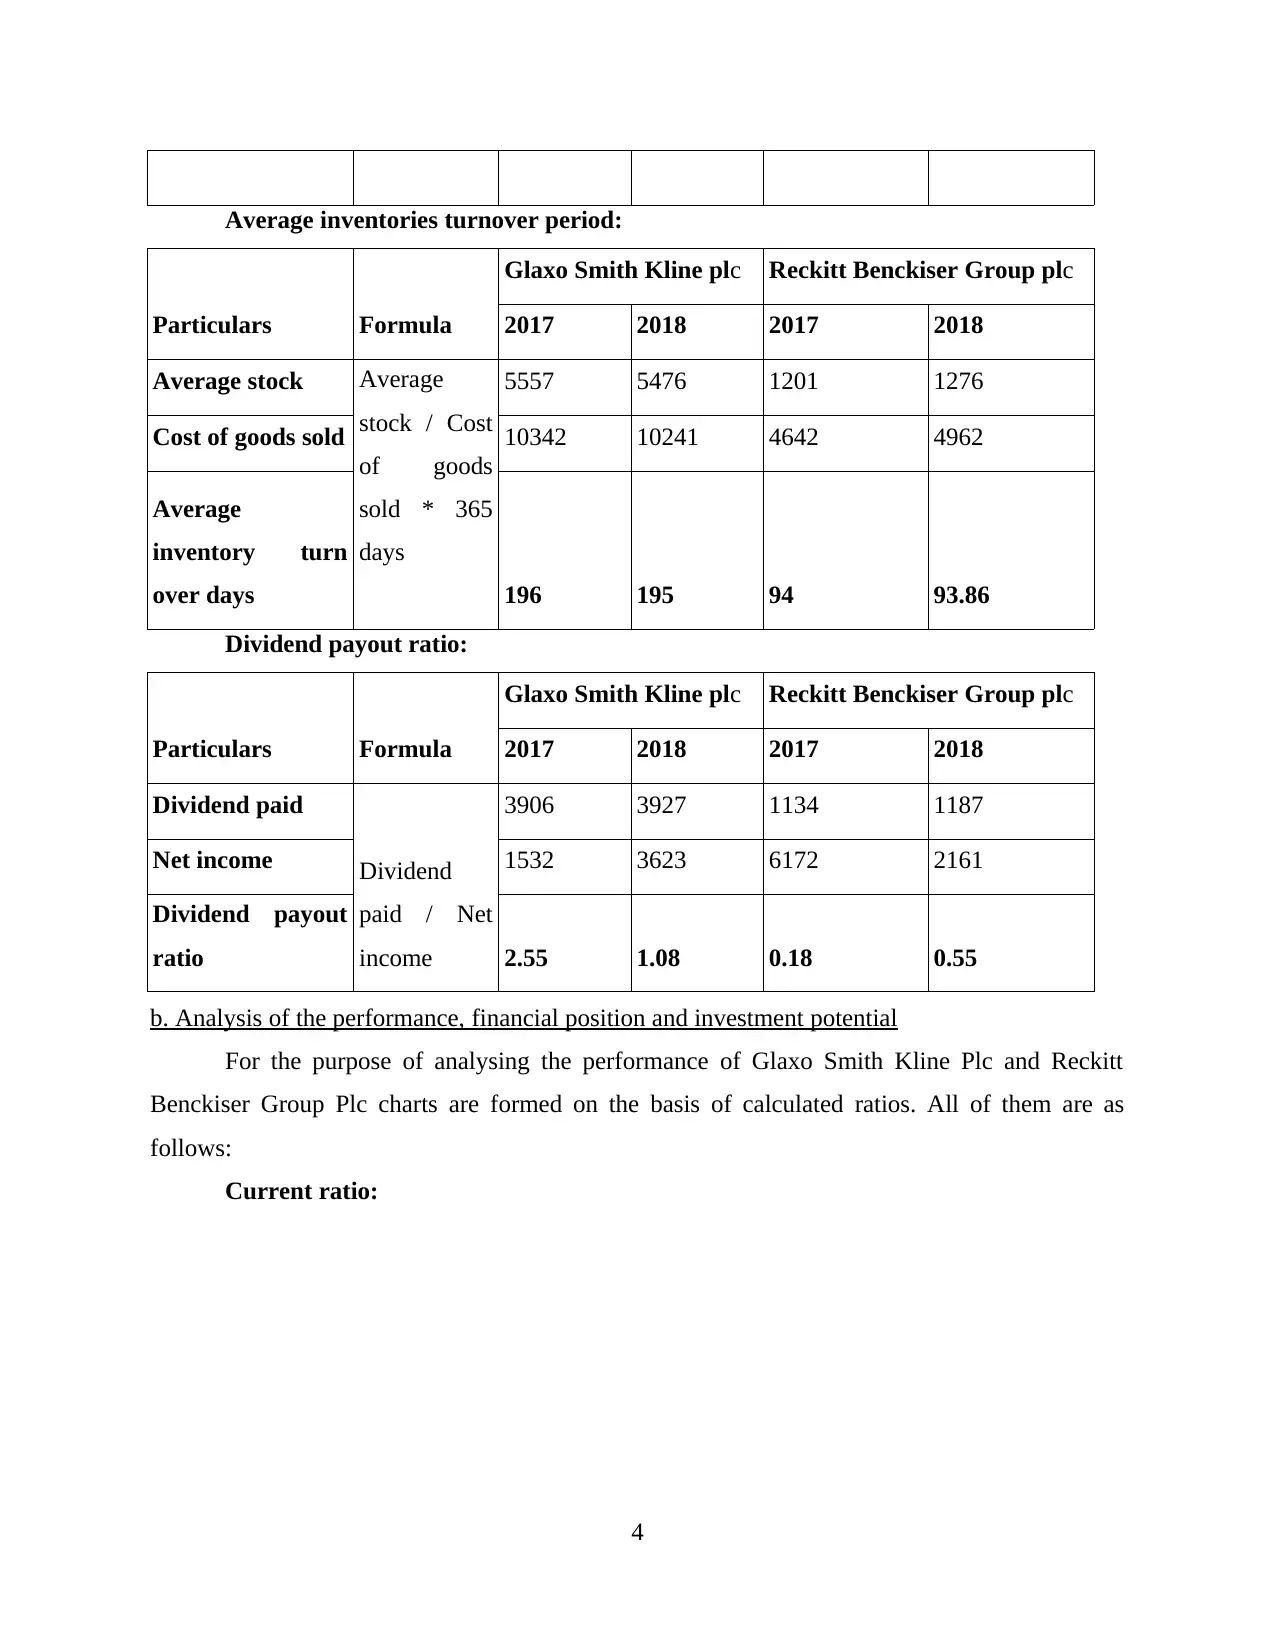
Current ratio:
4
Particulars Formula
Glaxo Smith Kline plc Reckitt Benckiser Group plc
2017 2018 2017 2018
Average stock Average
stock / Cost
of goods
sold * 365
days
5557 5476 1201 1276
Cost of goods sold 10342 10241 4642 4962
Average
inventory turn
over days 196 195 94 93.86
Dividend payout ratio:
Particulars Formula
Glaxo Smith Kline plc Reckitt Benckiser Group plc
2017 2018 2017 2018
Dividend paid
Dividend
paid / Net
income
3906 3927 1134 1187
Net income 1532 3623 6172 2161
Dividend payout
ratio 2.55 1.08 0.18 0.55
b. Analysis of the performance, financial position and investment potential
For the purpose of analysing the performance of Glaxo Smith Kline Plc and Reckitt
Benckiser Group Plc charts are formed on the basis of calculated ratios. All of them are as
follows:
Current ratio:
4
⊘ This is a preview!⊘
Do you want full access?
Subscribe today to unlock all pages.
Trusted by 1+ million students worldwide
2017 (in times) 2018 (in times)
0
0.1
0.2
0.3
0.4
0.5
0.6
0.7
0.8
0.9
0.6
0.75
0.82 0.85
Glaxo Smith Kline plc
Reckitt Benckiser Group plc
The above chart is showing that current ratio of Reckitt Benvkiser group is higher than
Glaxo Smith Kline Plc. It means that the organisation with higher current ratio is having
sufficient funds to pay the short term liabilities within one year. It also shows that the company is
having higher liquidity as compared to another one (Arena and Ferris, 2017).
Quick ratio
2017 (in times) 2018 (in times)
0
0.1
0.2
0.3
0.4
0.5
0.6
0.7
0.38
0.49
0.64
0.48
Glaxo Smith Kline plc
Reckitt Benckiser Group plc
From the above chart it has been determined that in year 2017 quick ratio of Reckitt
Benckier Group Plc was higher than Glaxo Smith Kline Plc but in 2018 the ratio of the entity
was lower than the another one. The difference in the ratio is very low but if comparison is done
of the basis of quick ratio the financial performance of Reckitt is good (Asongu, 2015).
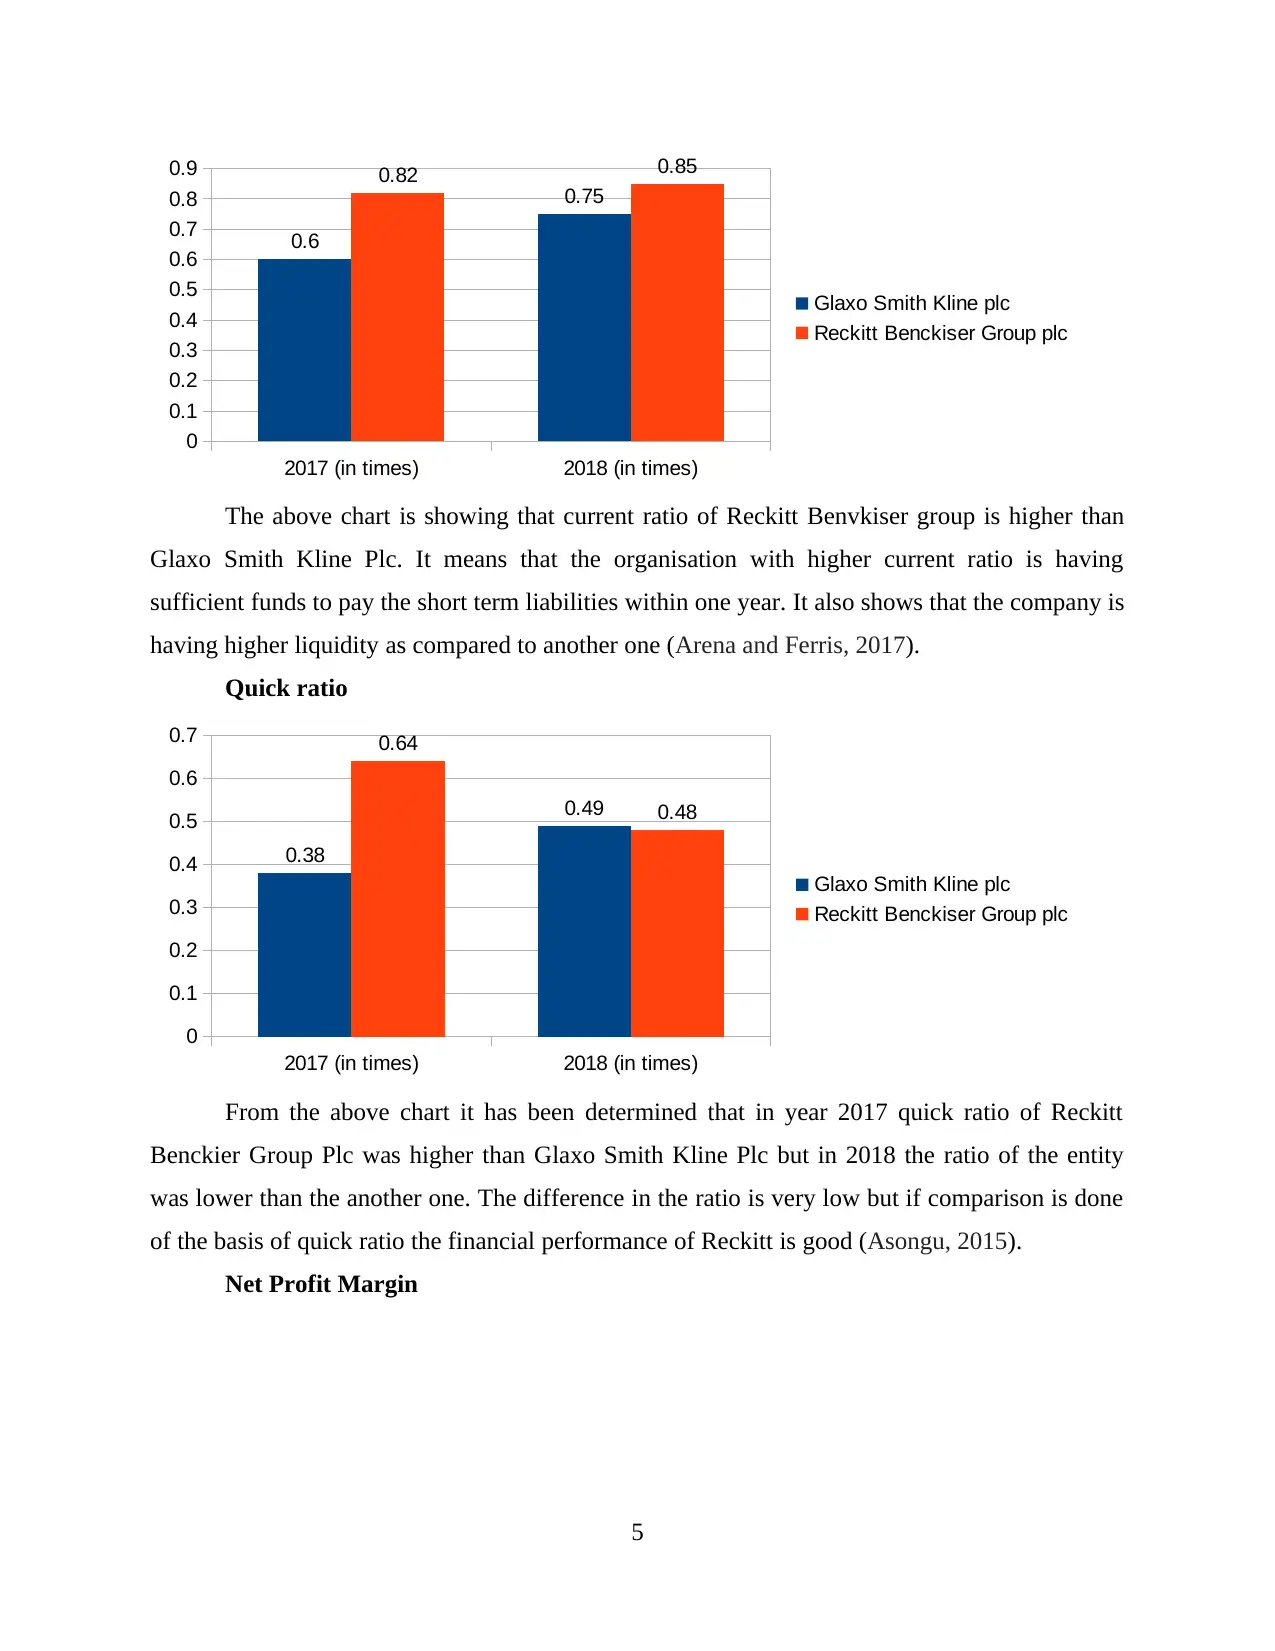
Net Profit Margin
5
0
0.1
0.2
0.3
0.4
0.5
0.6
0.7
0.8
0.9
0.6
0.75
0.82 0.85
Glaxo Smith Kline plc
Reckitt Benckiser Group plc
The above chart is showing that current ratio of Reckitt Benvkiser group is higher than
Glaxo Smith Kline Plc. It means that the organisation with higher current ratio is having
sufficient funds to pay the short term liabilities within one year. It also shows that the company is
having higher liquidity as compared to another one (Arena and Ferris, 2017).
Quick ratio
2017 (in times) 2018 (in times)
0
0.1
0.2
0.3
0.4
0.5
0.6
0.7
0.38
0.49
0.64
0.48
Glaxo Smith Kline plc
Reckitt Benckiser Group plc
From the above chart it has been determined that in year 2017 quick ratio of Reckitt
Benckier Group Plc was higher than Glaxo Smith Kline Plc but in 2018 the ratio of the entity
was lower than the another one. The difference in the ratio is very low but if comparison is done
of the basis of quick ratio the financial performance of Reckitt is good (Asongu, 2015).
Net Profit Margin
5
Paraphrase This Document
Need a fresh take? Get an instant paraphrase of this document with our AI Paraphraser
2017 (in %) 2018 (in %)
0
10
20
30
40
50
60
5.07
11.75
53.61
17.15
Glaxo Smith Kline plc
Reckitt Benckiser Group plc
The above chart shows that net profit margin of Reckitt Benckiser Group Plc is very high
in comparison of Glaxo Smith Kline Plc in year 2017 and 2018. It demonstrates that the
company with high ratio is able to generate higher profits as compared to the another one. It also
reflects the good financial position of the business (Baker and Kapoor, 2015).
Gross Profit margin:
2017 (in %) 2018 (in %)
0
10
20
30
40
50
60
5.07
11.75
53.61
17.15
Glaxo Smith Kline plc
Reckitt Benckiser Group plc
The chart for the gross profit margin is showing that the profitability of Glaxo Smith
Kline Plc is lower in comparison of Reckitt benckiser Group Plc. It is showing that operational
performance of the first company is low as compared to the second entity. By analysing it the
decision of the investors could be formed to investment their finance in an organisation.
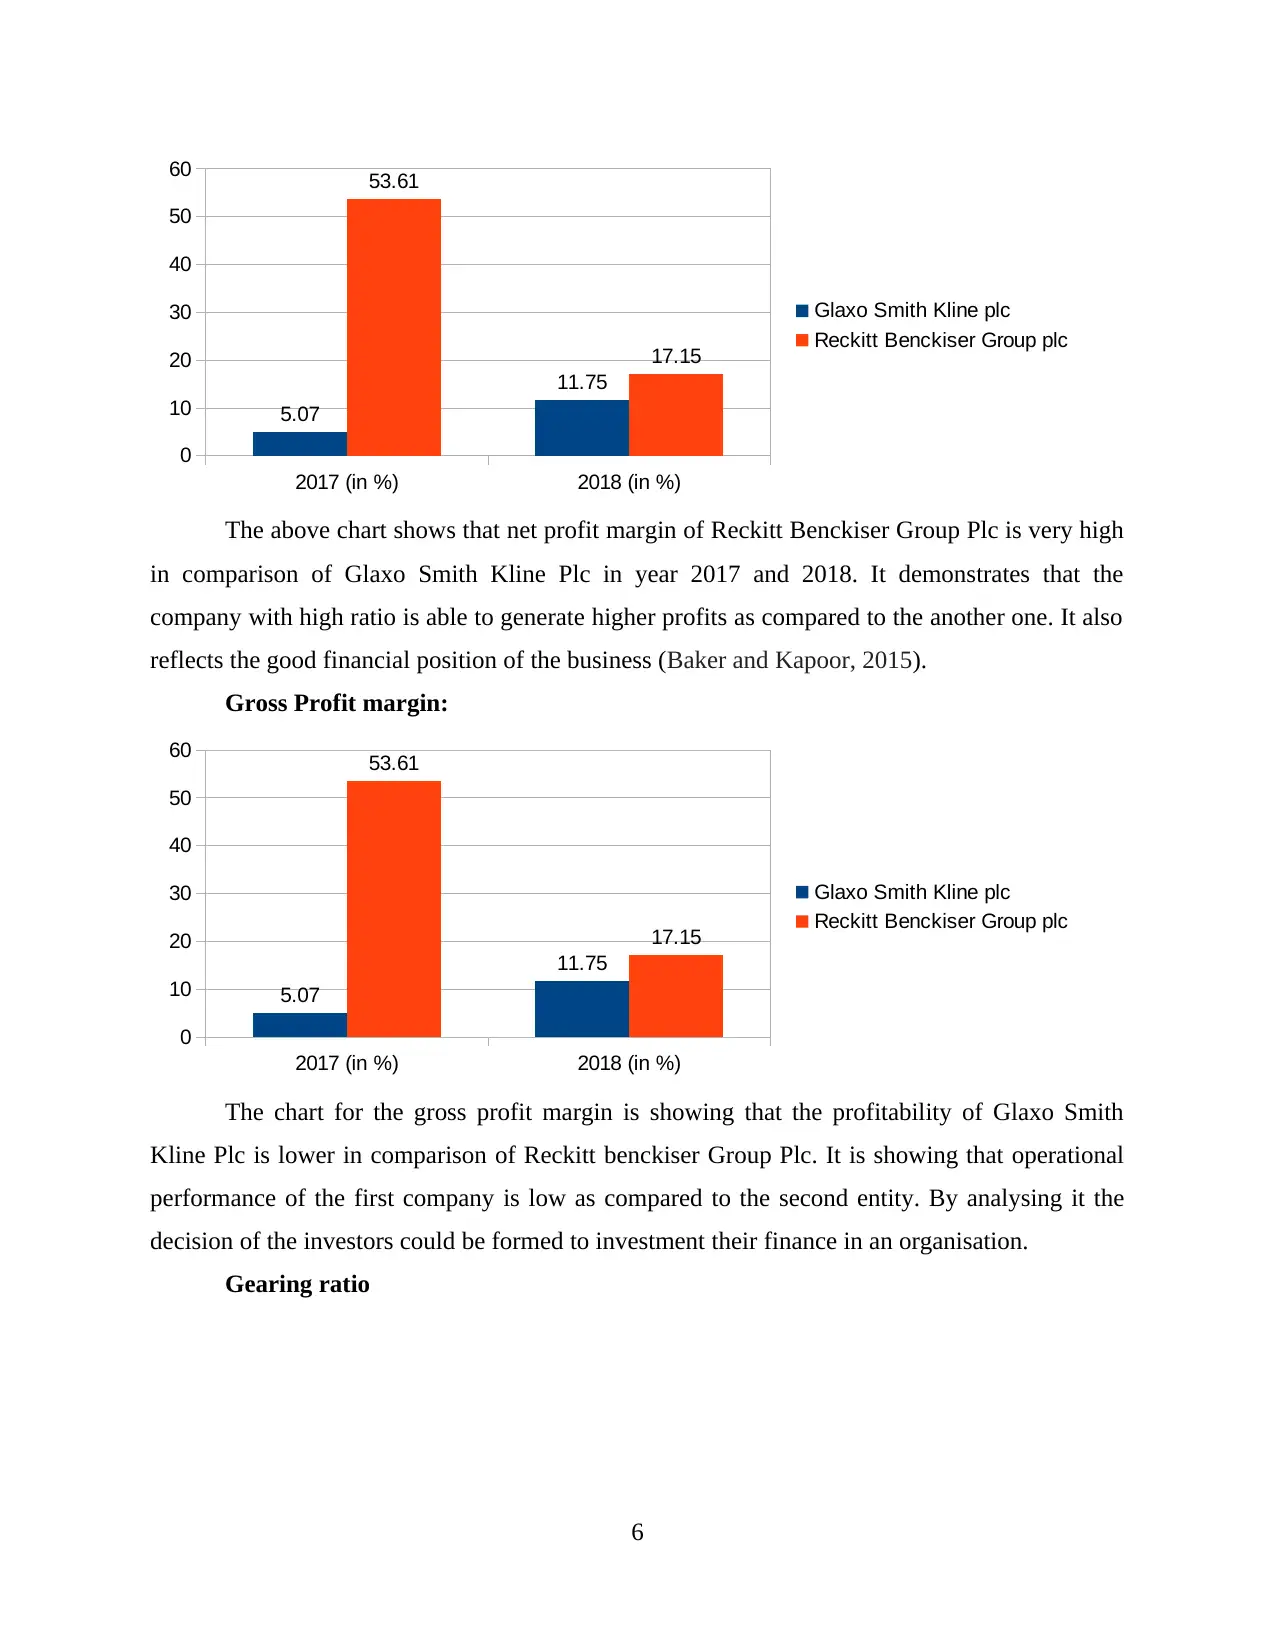
Gearing ratio
6
0
10
20
30
40
50
60
5.07
11.75
53.61
17.15
Glaxo Smith Kline plc
Reckitt Benckiser Group plc
The above chart shows that net profit margin of Reckitt Benckiser Group Plc is very high
in comparison of Glaxo Smith Kline Plc in year 2017 and 2018. It demonstrates that the
company with high ratio is able to generate higher profits as compared to the another one. It also
reflects the good financial position of the business (Baker and Kapoor, 2015).
Gross Profit margin:
2017 (in %) 2018 (in %)
0
10
20
30
40
50
60
5.07
11.75
53.61
17.15
Glaxo Smith Kline plc
Reckitt Benckiser Group plc
The chart for the gross profit margin is showing that the profitability of Glaxo Smith
Kline Plc is lower in comparison of Reckitt benckiser Group Plc. It is showing that operational
performance of the first company is low as compared to the second entity. By analysing it the
decision of the investors could be formed to investment their finance in an organisation.
Gearing ratio
6
2017 2018
0
2
4
6
8
10
12
14
0
12.32
1.74 1.55
Glaxo Smith Kline plc
Reckitt Benckiser Group plc
From the above graph it has been determined that in year 2017 the gearing ratio of Glazo
Plc was showing a very low amount and for 2018 a huge boom is recorded for the same. It shows
that there is no stability in the financial performance of the company therefore if investors invest
their money in this entity then there is a huge possibility of facing losses (Baker and Weigand,
2015). On the other hand, a slight decrement in this ratio for Reckitt Benckiser Group Plc is
recorded which means the position of the company is not bad and it is a good option for
investment.
P/E ratio
2017 2018
0
500
1000
1500
2000
2500
3000
3500
4000
4500
5000
4317.89
2000.27
815.77
2031.36 Glaxo Smith Kline plc
Reckitt Benckiser Group plc
The above chart which is formed on the basis of PE ratio is showing that in 2017 it was
high for Glaxo Smith Kline and for 2018 it was high for Reckitt Benckiser Group Plc (Carbo‐
Valverde, Rodriguez‐Fernandez and Udell, 2016). According to the calculations of ratios second
company is having good position in the market because its ratio is showing increasing trend and
on the other hand decrement trend is recorded in Glaxo.
Earnings per share:
7
0
2
4
6
8
10
12
14
0
12.32
1.74 1.55
Glaxo Smith Kline plc
Reckitt Benckiser Group plc
From the above graph it has been determined that in year 2017 the gearing ratio of Glazo
Plc was showing a very low amount and for 2018 a huge boom is recorded for the same. It shows
that there is no stability in the financial performance of the company therefore if investors invest
their money in this entity then there is a huge possibility of facing losses (Baker and Weigand,
2015). On the other hand, a slight decrement in this ratio for Reckitt Benckiser Group Plc is
recorded which means the position of the company is not bad and it is a good option for
investment.
P/E ratio
2017 2018
0
500
1000
1500
2000
2500
3000
3500
4000
4500
5000
4317.89
2000.27
815.77
2031.36 Glaxo Smith Kline plc
Reckitt Benckiser Group plc
The above chart which is formed on the basis of PE ratio is showing that in 2017 it was
high for Glaxo Smith Kline and for 2018 it was high for Reckitt Benckiser Group Plc (Carbo‐
Valverde, Rodriguez‐Fernandez and Udell, 2016). According to the calculations of ratios second
company is having good position in the market because its ratio is showing increasing trend and
on the other hand decrement trend is recorded in Glaxo.
Earnings per share:
7
⊘ This is a preview!⊘
Do you want full access?
Subscribe today to unlock all pages.
Trusted by 1+ million students worldwide
2017 2018
0
1
2
3
4
5
6
7
8
9
0.31 0.74
8.38
2.93
Glaxo Smith Kline plc
Reckitt Benckiser Group plc
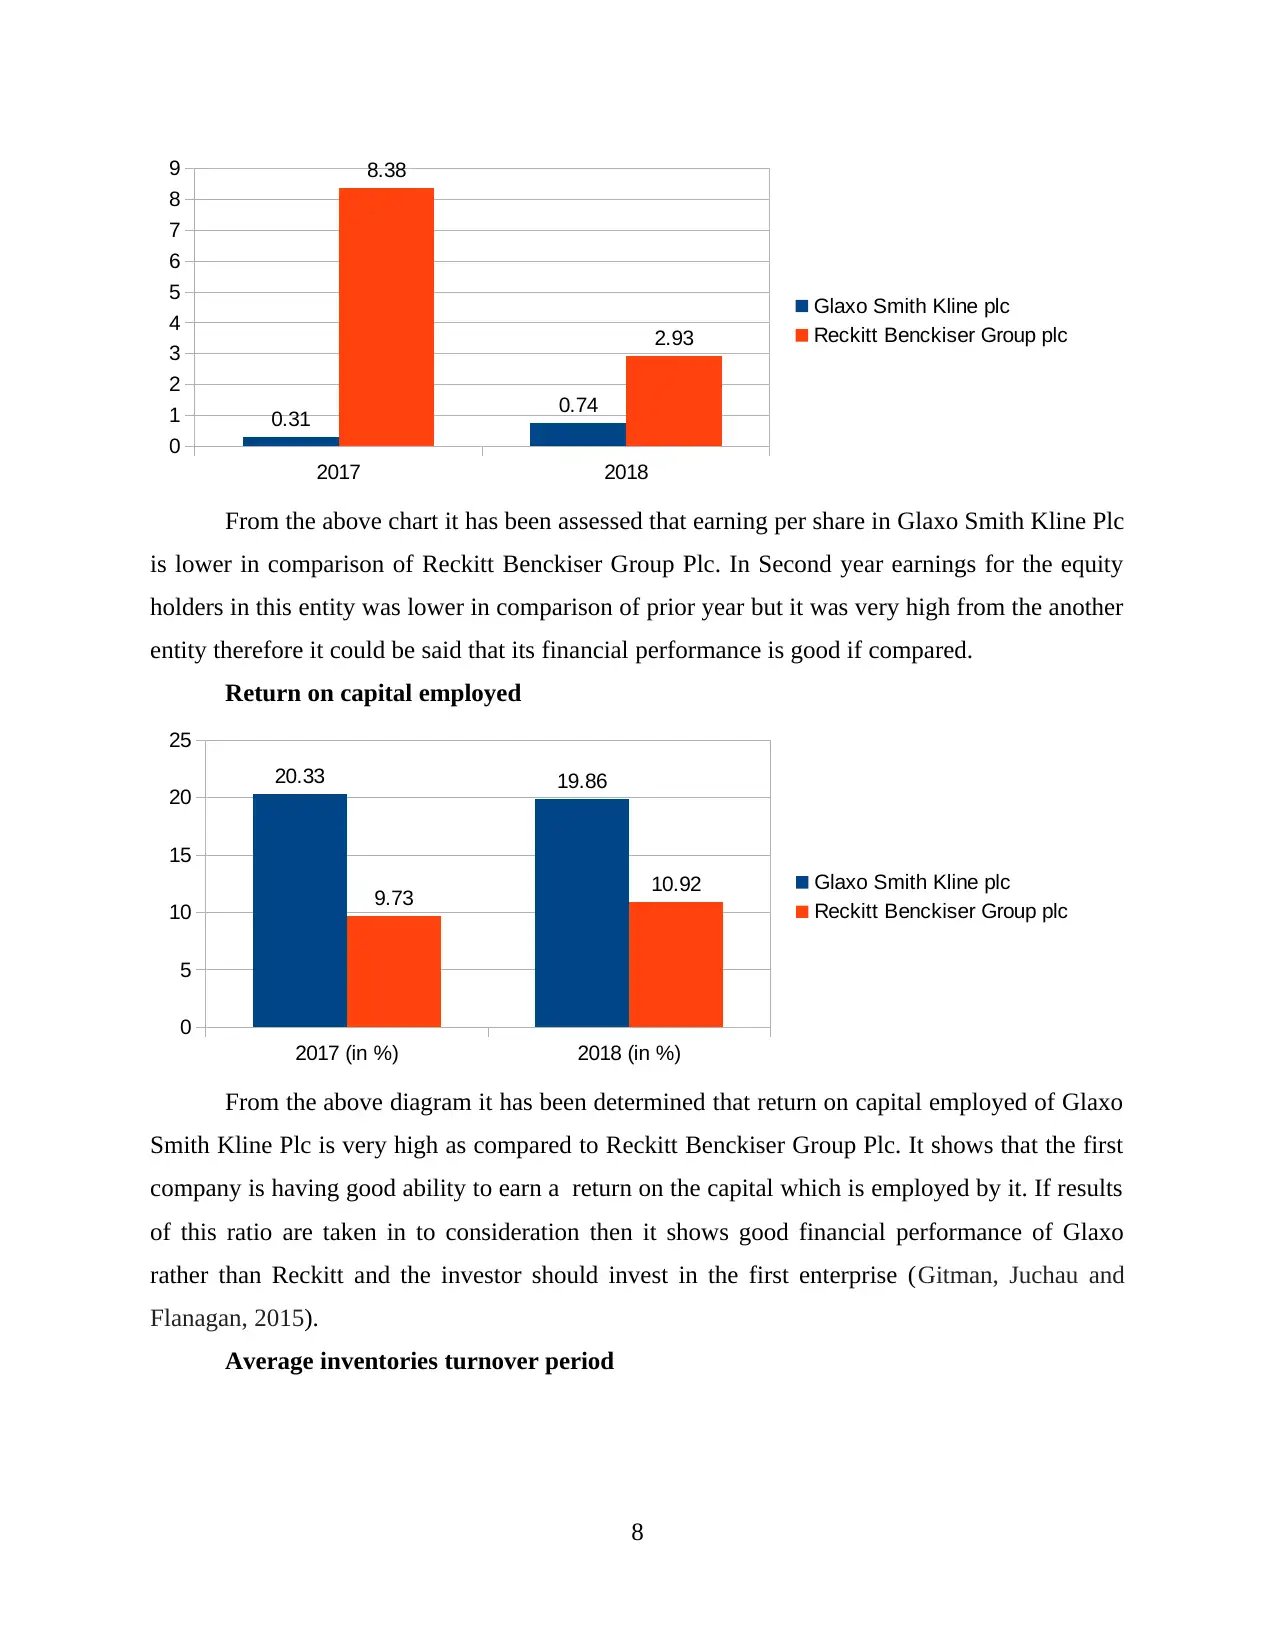
From the above chart it has been assessed that earning per share in Glaxo Smith Kline Plc
is lower in comparison of Reckitt Benckiser Group Plc. In Second year earnings for the equity
holders in this entity was lower in comparison of prior year but it was very high from the another
entity therefore it could be said that its financial performance is good if compared.
Return on capital employed
2017 (in %) 2018 (in %)
0
5
10
15
20
25
20.33 19.86
9.73 10.92 Glaxo Smith Kline plc
Reckitt Benckiser Group plc
From the above diagram it has been determined that return on capital employed of Glaxo
Smith Kline Plc is very high as compared to Reckitt Benckiser Group Plc. It shows that the first
company is having good ability to earn a return on the capital which is employed by it. If results
of this ratio are taken in to consideration then it shows good financial performance of Glaxo
rather than Reckitt and the investor should invest in the first enterprise (Gitman, Juchau and
Flanagan, 2015).
Average inventories turnover period
8
0
1
2
3
4
5
6
7
8
9
0.31 0.74
8.38
2.93
Glaxo Smith Kline plc
Reckitt Benckiser Group plc
From the above chart it has been assessed that earning per share in Glaxo Smith Kline Plc
is lower in comparison of Reckitt Benckiser Group Plc. In Second year earnings for the equity
holders in this entity was lower in comparison of prior year but it was very high from the another
entity therefore it could be said that its financial performance is good if compared.
Return on capital employed
2017 (in %) 2018 (in %)
0
5
10
15
20
25
20.33 19.86
9.73 10.92 Glaxo Smith Kline plc
Reckitt Benckiser Group plc
From the above diagram it has been determined that return on capital employed of Glaxo
Smith Kline Plc is very high as compared to Reckitt Benckiser Group Plc. It shows that the first
company is having good ability to earn a return on the capital which is employed by it. If results
of this ratio are taken in to consideration then it shows good financial performance of Glaxo
rather than Reckitt and the investor should invest in the first enterprise (Gitman, Juchau and
Flanagan, 2015).
Average inventories turnover period
8
Paraphrase This Document
Need a fresh take? Get an instant paraphrase of this document with our AI Paraphraser
2017 (in days) 2018 (in days)
0
50
100
150
200
250
196 195
94 93.86 Glaxo Smith Kline plc
Reckitt Benckiser Group plc
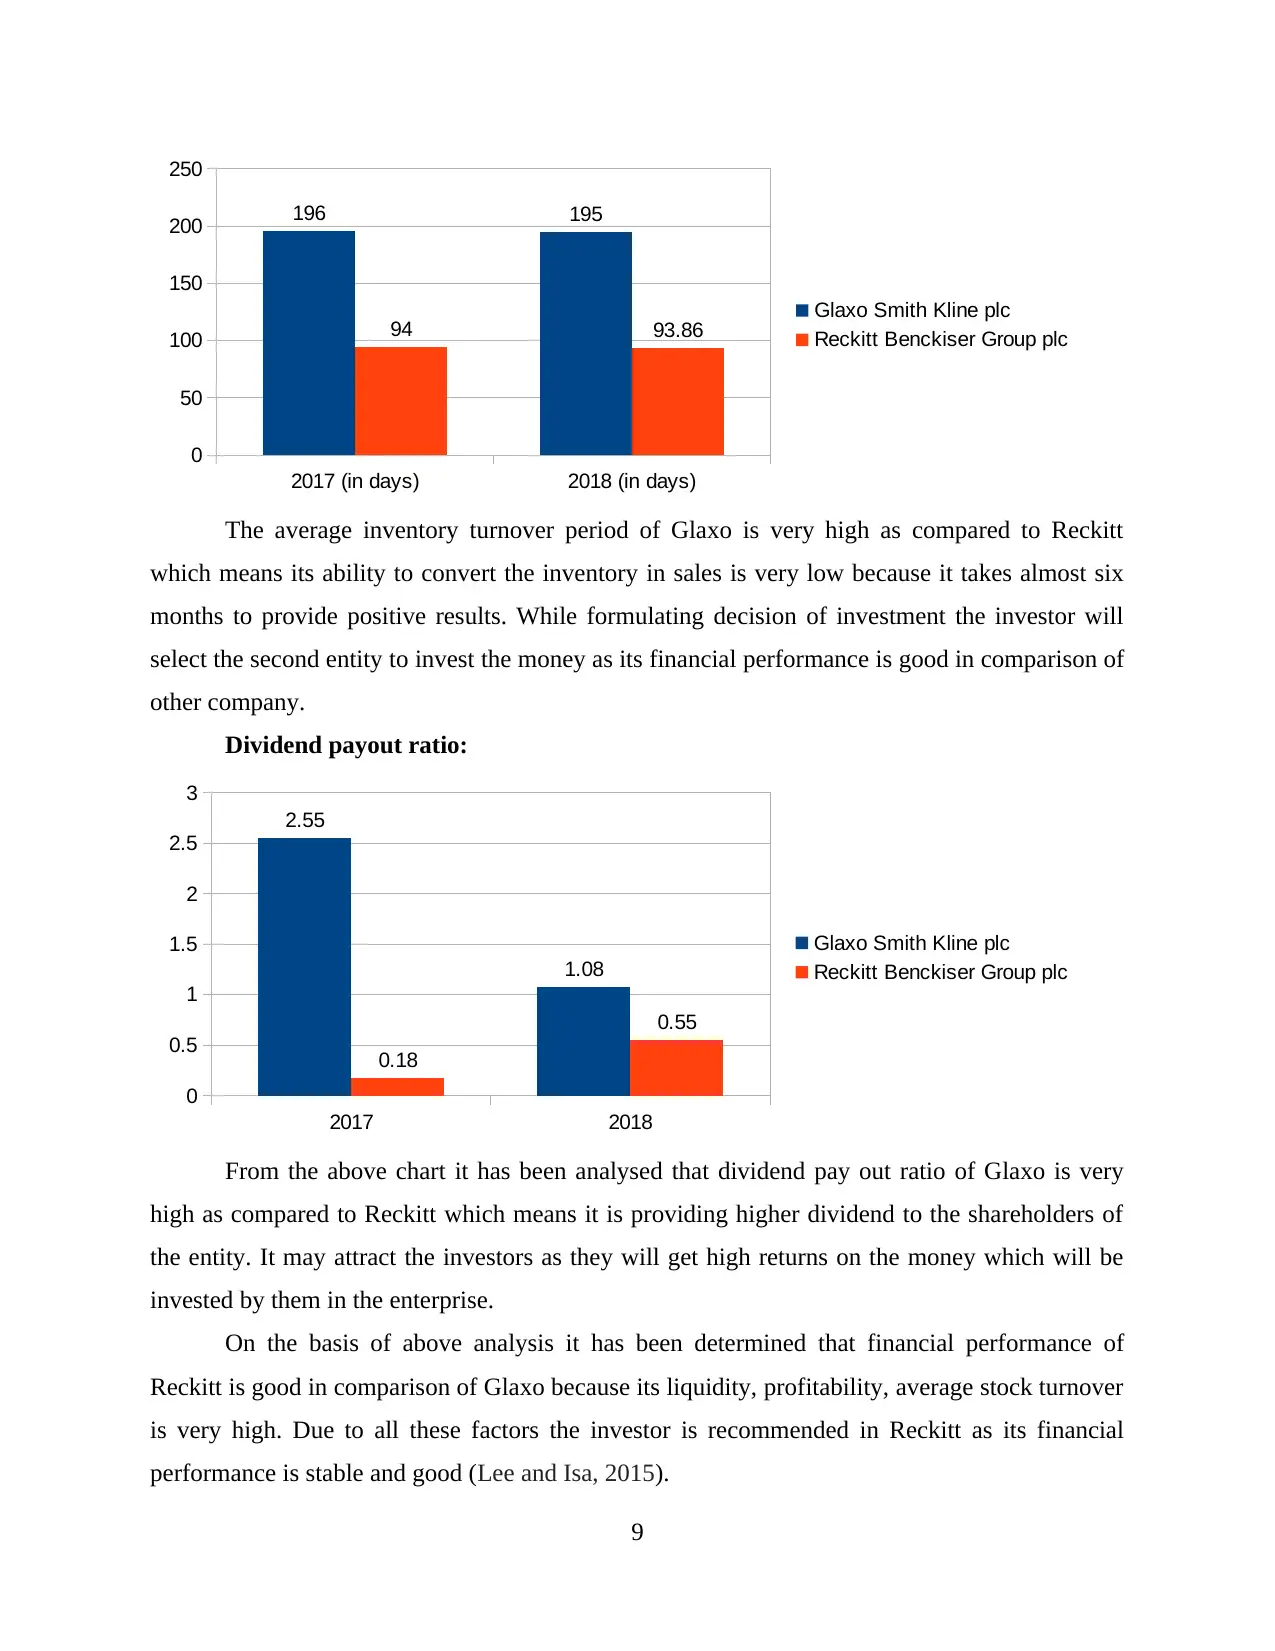
The average inventory turnover period of Glaxo is very high as compared to Reckitt
which means its ability to convert the inventory in sales is very low because it takes almost six
months to provide positive results. While formulating decision of investment the investor will
select the second entity to invest the money as its financial performance is good in comparison of
other company.
Dividend payout ratio:
2017 2018
0
0.5
1
1.5
2
2.5
3
2.55
1.08
0.18
0.55
Glaxo Smith Kline plc
Reckitt Benckiser Group plc
From the above chart it has been analysed that dividend pay out ratio of Glaxo is very
high as compared to Reckitt which means it is providing higher dividend to the shareholders of
the entity. It may attract the investors as they will get high returns on the money which will be
invested by them in the enterprise.
On the basis of above analysis it has been determined that financial performance of
Reckitt is good in comparison of Glaxo because its liquidity, profitability, average stock turnover
is very high. Due to all these factors the investor is recommended in Reckitt as its financial
performance is stable and good (Lee and Isa, 2015).
9
0
50
100
150
200
250
196 195
94 93.86 Glaxo Smith Kline plc
Reckitt Benckiser Group plc
The average inventory turnover period of Glaxo is very high as compared to Reckitt
which means its ability to convert the inventory in sales is very low because it takes almost six
months to provide positive results. While formulating decision of investment the investor will
select the second entity to invest the money as its financial performance is good in comparison of
other company.
Dividend payout ratio:
2017 2018
0
0.5
1
1.5
2
2.5
3
2.55
1.08
0.18
0.55
Glaxo Smith Kline plc
Reckitt Benckiser Group plc
From the above chart it has been analysed that dividend pay out ratio of Glaxo is very
high as compared to Reckitt which means it is providing higher dividend to the shareholders of
the entity. It may attract the investors as they will get high returns on the money which will be
invested by them in the enterprise.
On the basis of above analysis it has been determined that financial performance of
Reckitt is good in comparison of Glaxo because its liquidity, profitability, average stock turnover
is very high. Due to all these factors the investor is recommended in Reckitt as its financial
performance is stable and good (Lee and Isa, 2015).
9
c. Recommendation of the way in which financial performance of the poorly performing
business can be improved
On the basis of ratio analysis it has been determined that Glaxo Smith Kline Plc's
performance is very poor in the market and the top level executives of the organisation are
required to take proper actions to enhance the performance. There are various recommendations
are provided to the which could be adopted by them to enhance financial status in the market. All
of them are as follows:
Managers of Glaxo should pay attention towards increment of liquid assets so that level
of liquidity could be increased. It will help to meet the short term obligations properly
and in less time.
The management should formulate effective strategies so that they can make efforts to
increase the earning per share (Osterhoff and Kaserer, 2016).
Gross profit margin of the entity is very low therefore it is very important for the
managers to form new policies which may result in increased profitability so that it can
result in good financial performance of the company.
Average inventory period of the company is very high so it is essential for management
to find ways in which the period could be decreased. They can form new strategies to
improve it as it will be beneficial for improvement of financial position of the company.
d. Discussion of the limitation of relaying on financial ratios to interpret a company's
performance
Ratio analysis is an effective technique which could be used by organisations for the
purpose of determining financial position. It is very important for the managers not to relay upon
them wholly as there are some limitations of it to interpret performance of a company. In order to
reach to the best suitable conclusion it is vital for them to be aware of all the weaknesses of it.
Some of them are discussed below:
Ratio analysis does not focus upon inflationary effects which means it is not possible that
it provides exact results to the researchers.
If an investor is having two different options for investment of two companies of
different sectors then in this case it will not be beneficial for them to get exact and
appropriate results to reach a conclusion (Limitations of Ratio analysis for decision
making, 2019).
10
⊘ This is a preview!⊘
Do you want full access?
Subscribe today to unlock all pages.
Trusted by 1+ million students worldwide
1 out of 17
Related Documents


Your All-in-One AI-Powered Toolkit for Academic Success.
+13062052269
info@desklib.com
Available 24*7 on WhatsApp / Email
![[object Object]](/_next/static/media/star-bottom.7253800d.svg)
Unlock your academic potential
Copyright © 2020–2026 A2Z Services. All Rights Reserved. Developed and managed by ZUCOL.