Financial Analysis and Investment Appraisal Report for BA 4008

Verified

Added on  2023/01/09

|16
|2344
|1
Report
AI Summary
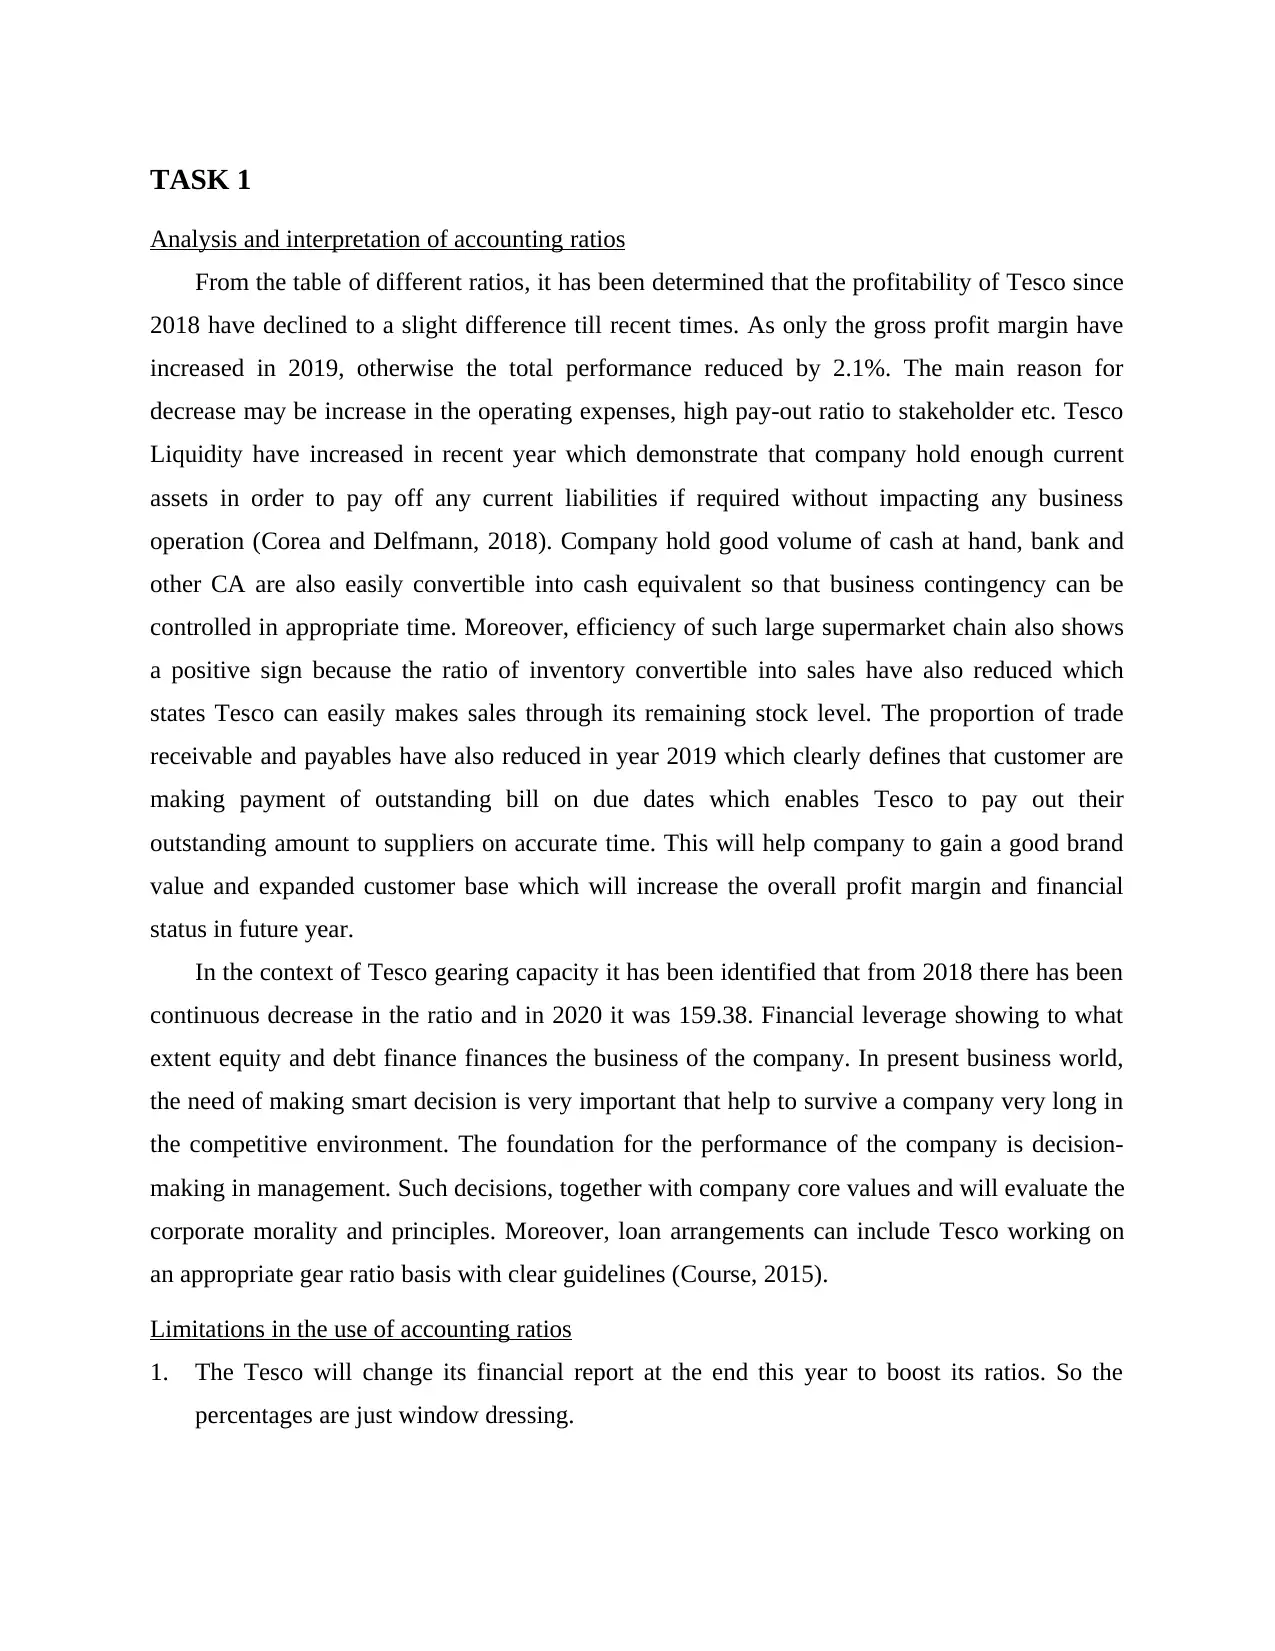
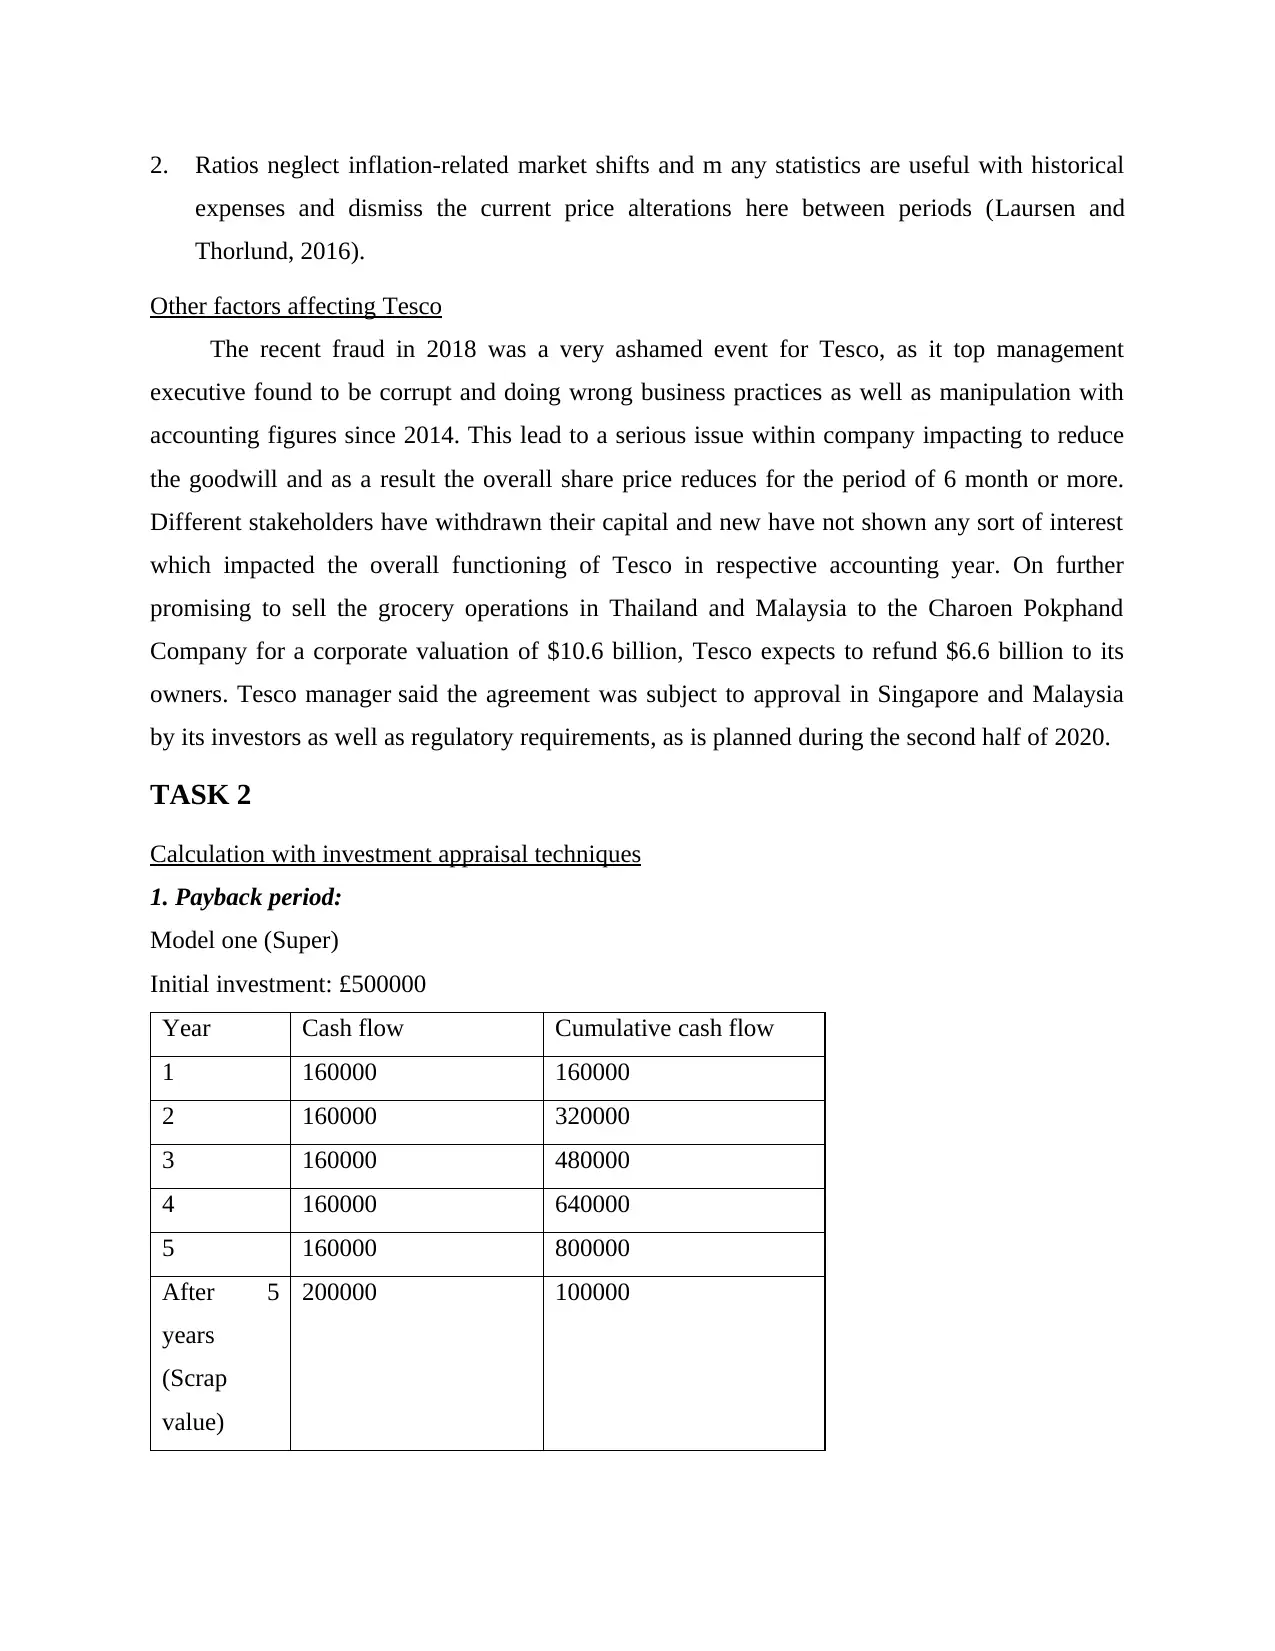
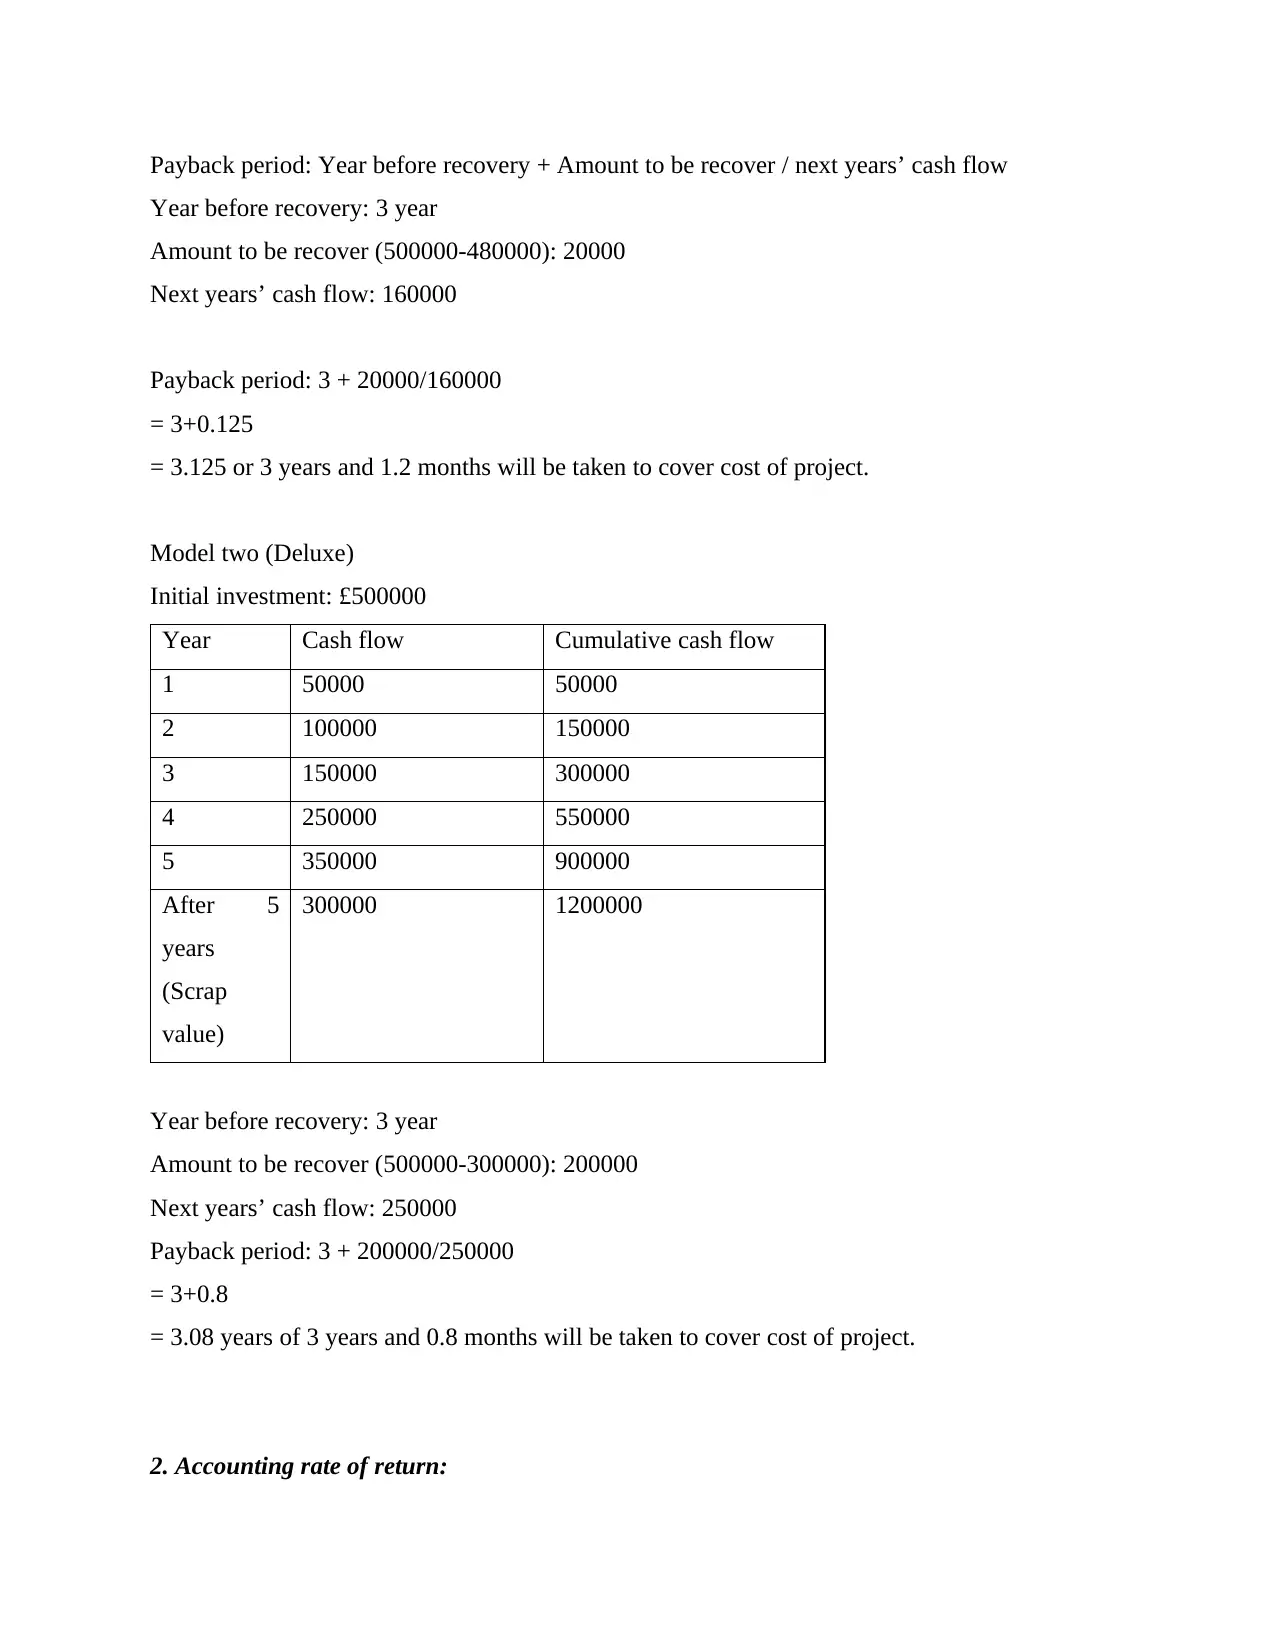
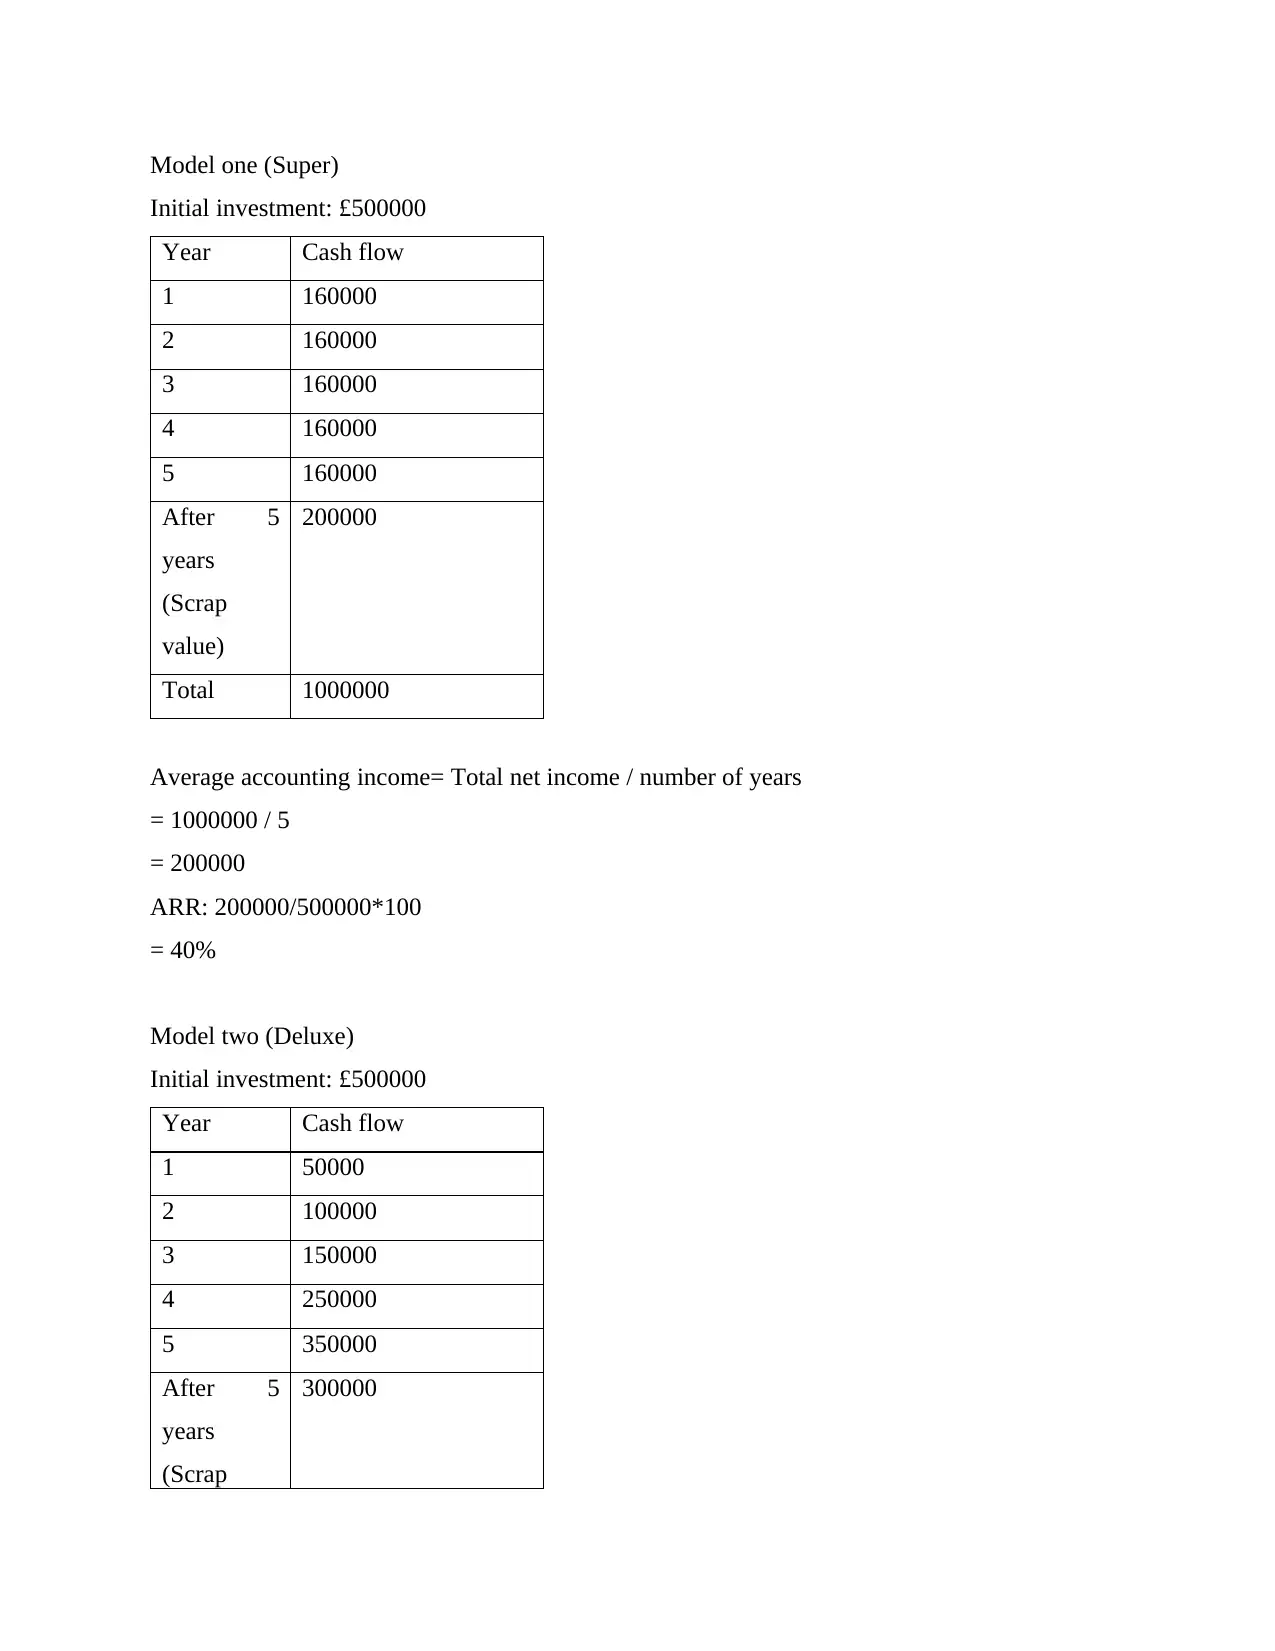
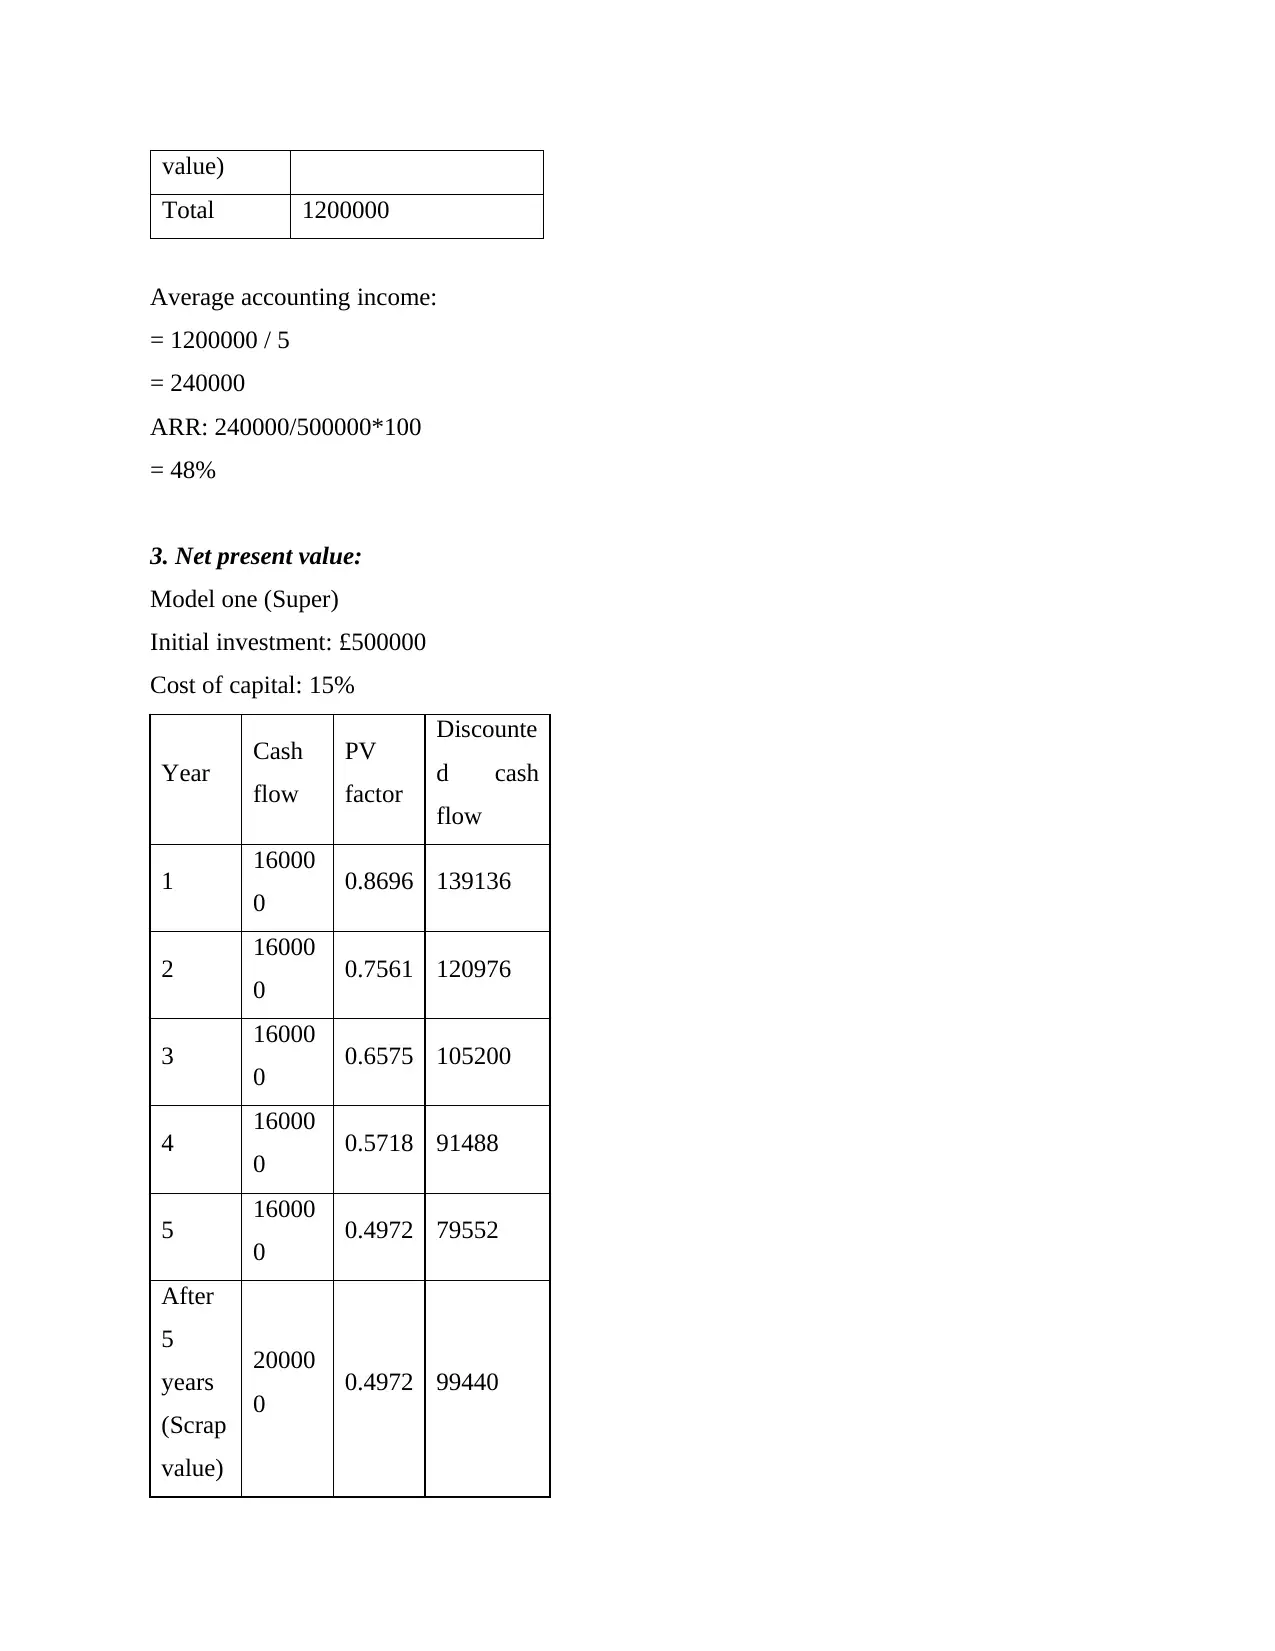
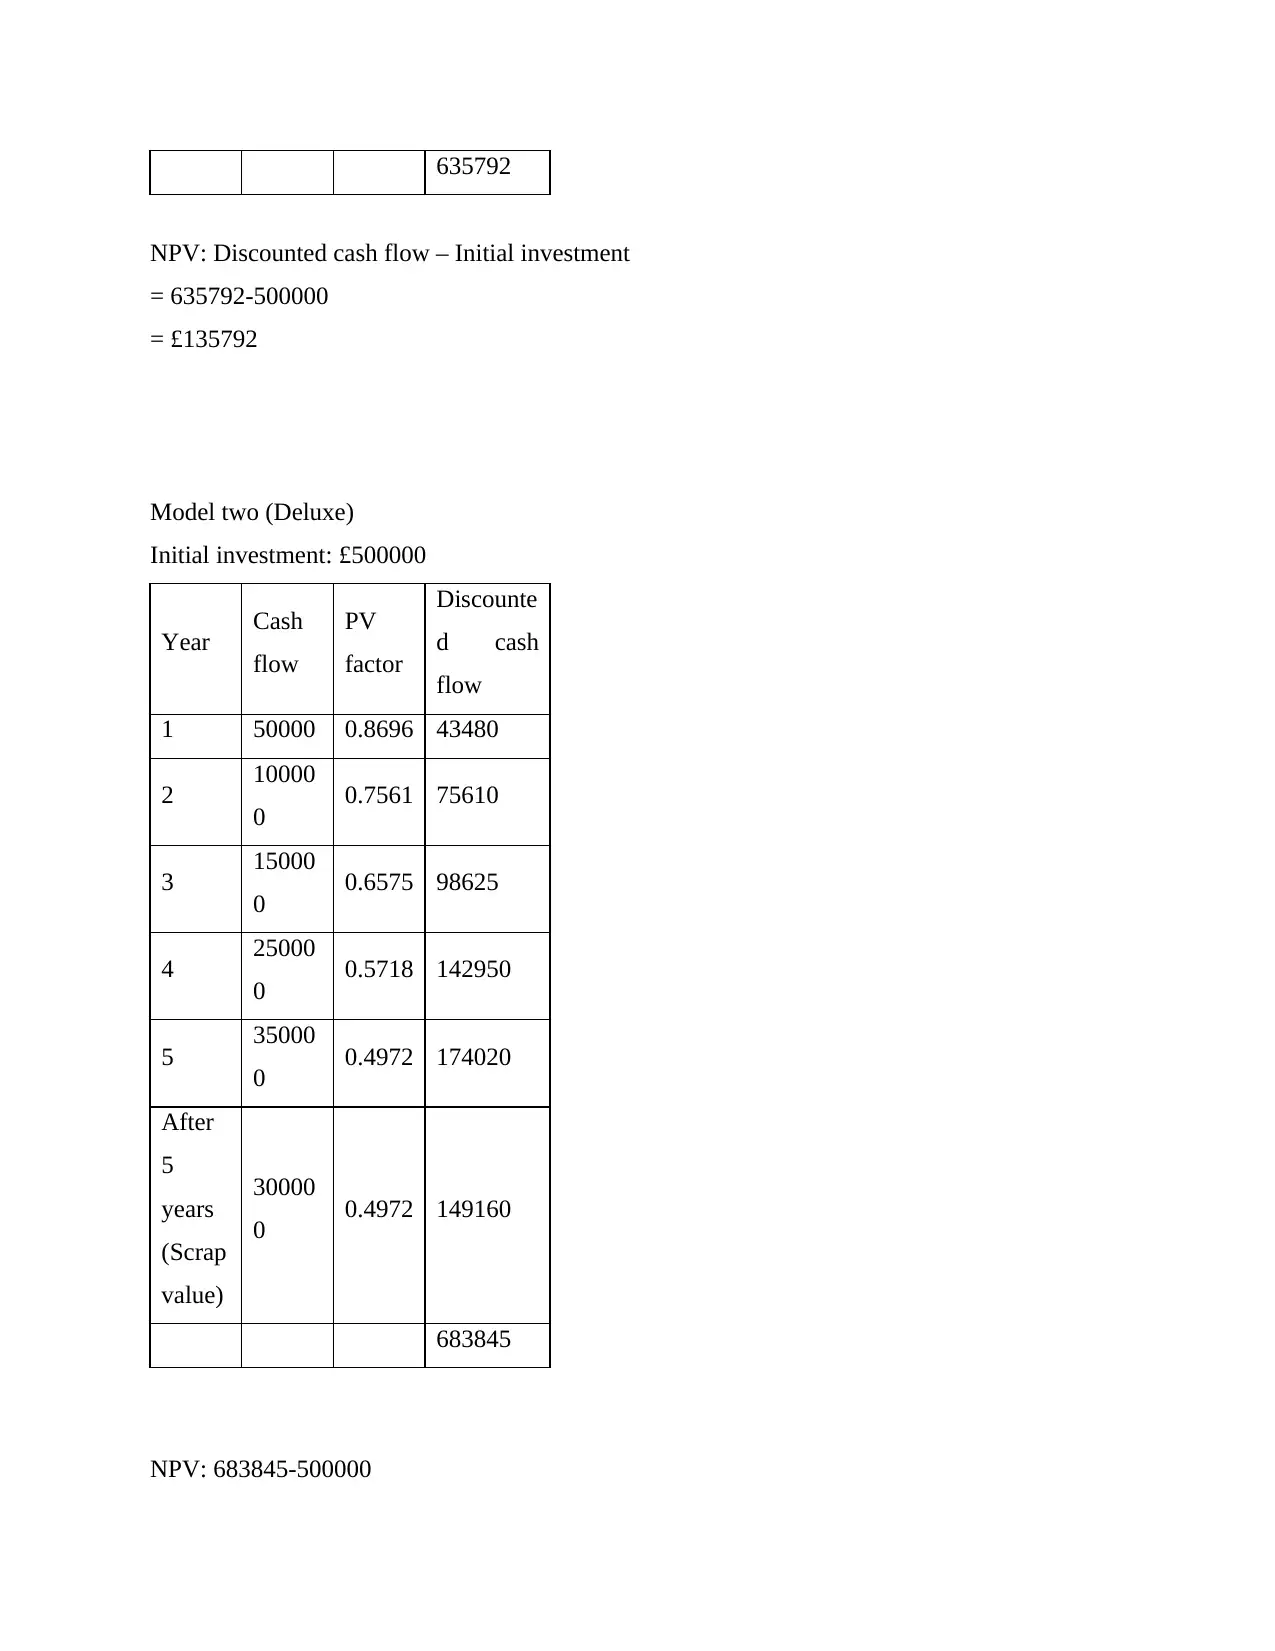
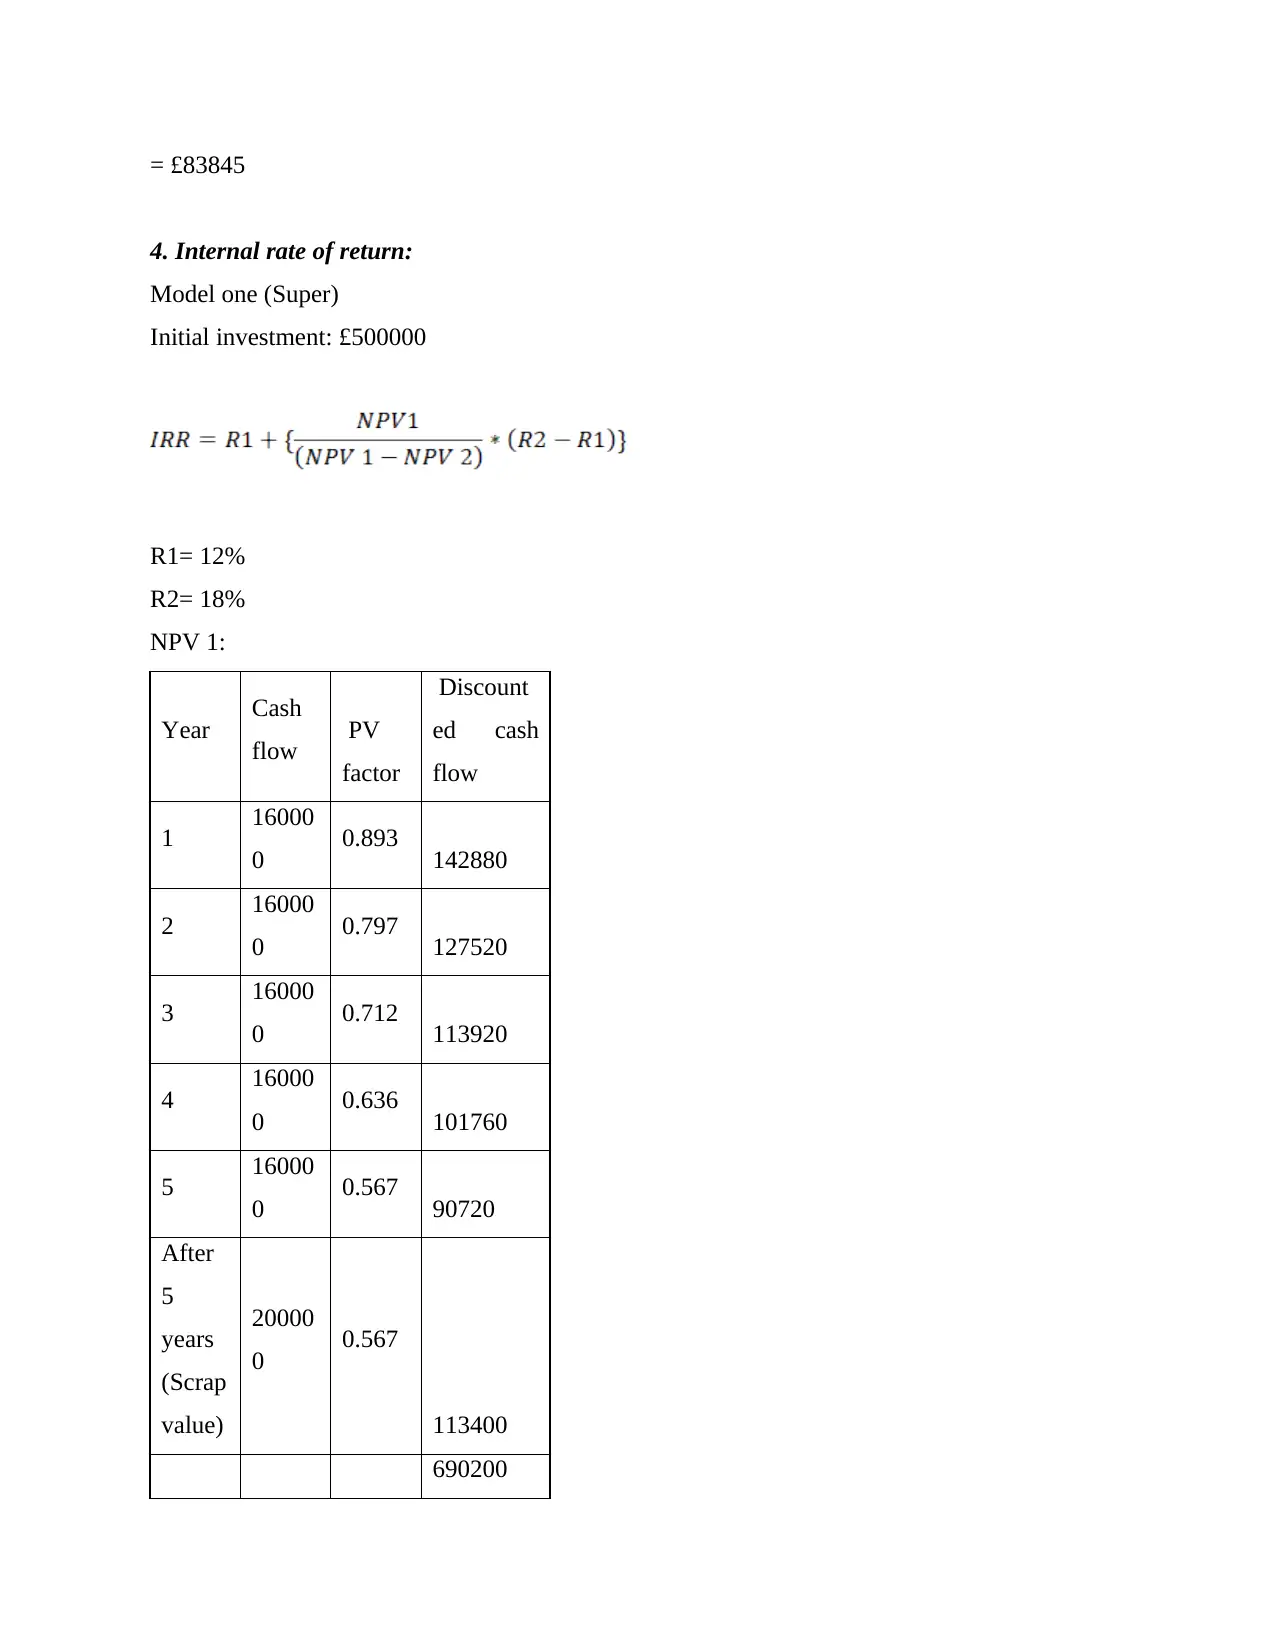
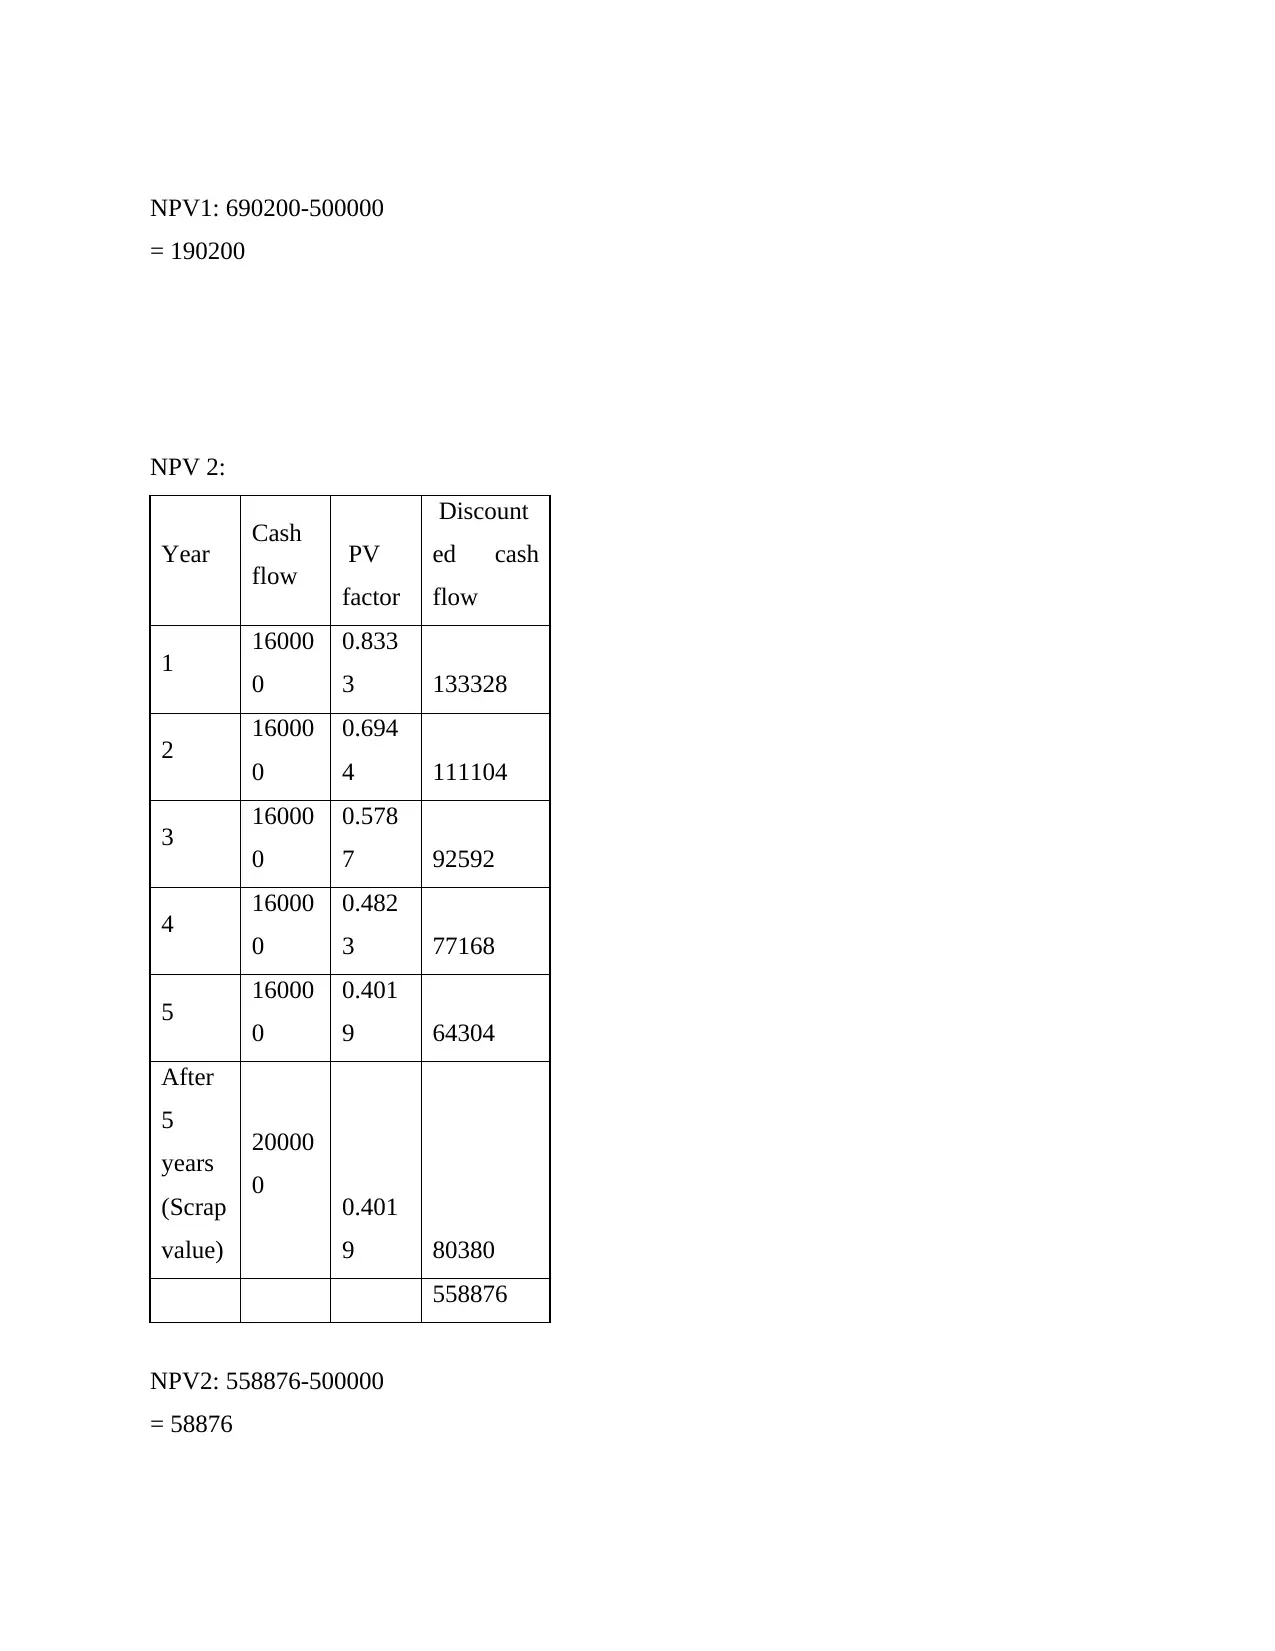
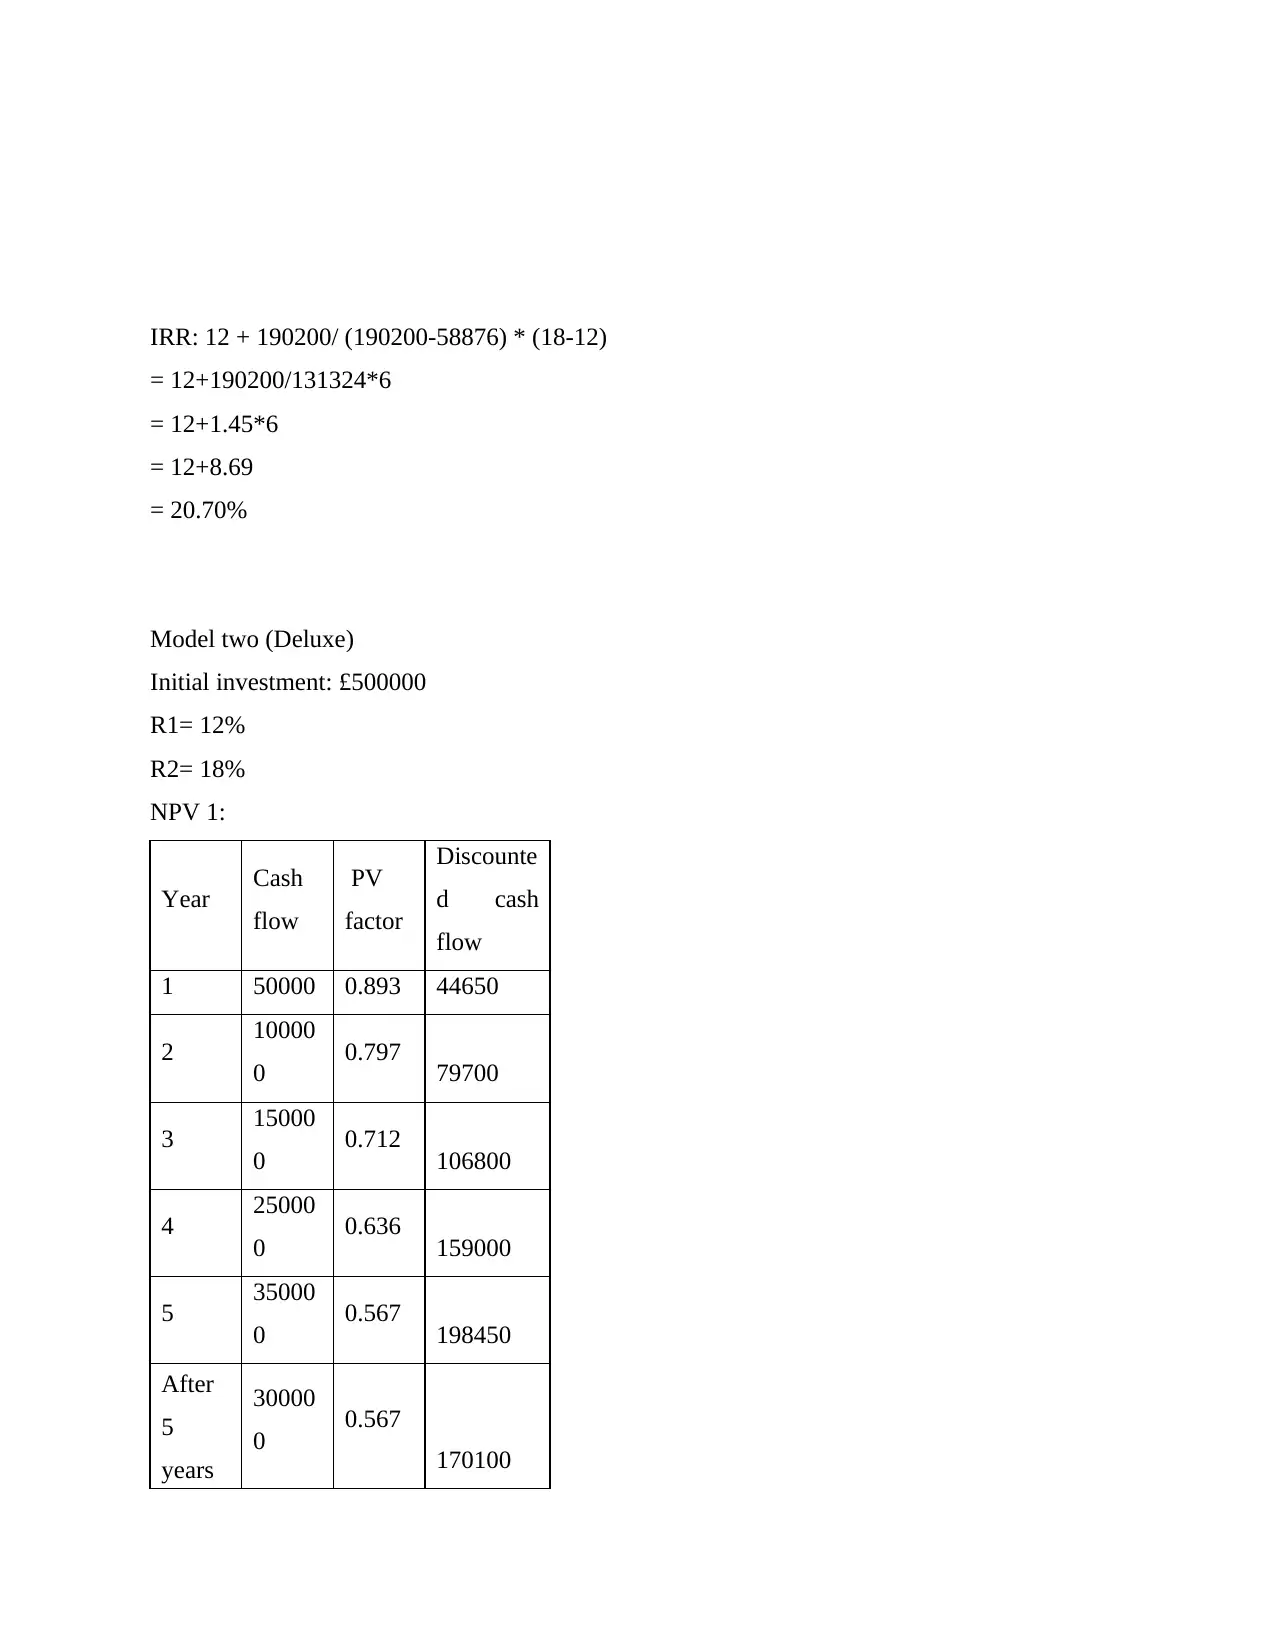
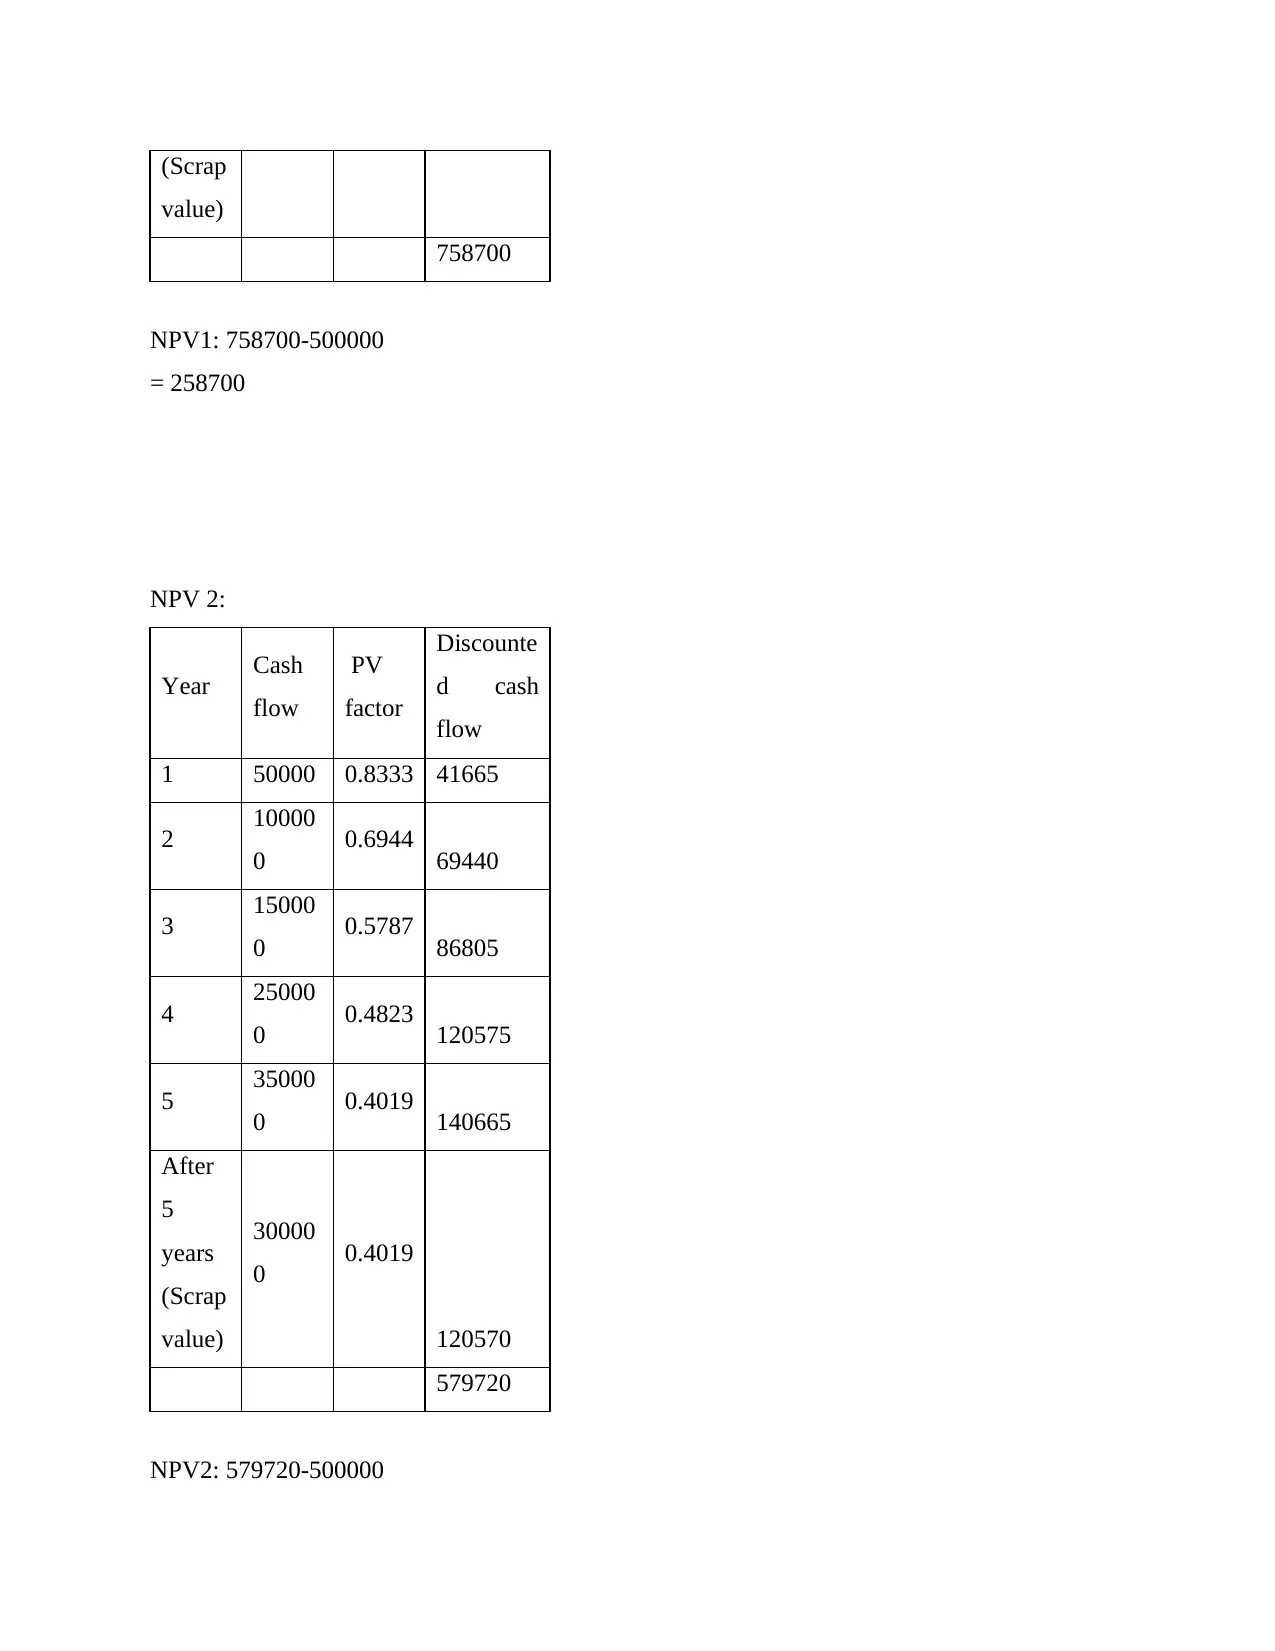
This report provides a detailed analysis of business decision-making, focusing on financial analysis and investment appraisal. The report begins with an examination of accounting ratios, including profitability, liquidity, and gearing, and their implications for a company like Tesco. It also addresses the limitations of using accounting ratios and discusses other factors that can affect a business. The core of the report centers on investment appraisal techniques such as payback period, accounting rate of return (ARR), net present value (NPV), and internal rate of return (IRR). Each technique is explained, applied to two investment models (Super and Deluxe), and evaluated based on its advantages and disadvantages. The report concludes with a recommendation for Sunderland Plc, based on the investment appraisal results, suggesting which investment model would be more beneficial. The report utilizes financial data and calculations to support its findings and recommendations.
Document Page
BA 4008 Business
Decision Making
tabler-icon-diamond-filled.svg

Paraphrase This Document

Need a fresh take? Get an instant paraphrase of this document with our AI Paraphraser
Document Page
Contents
TASK 1............................................................................................................................................3
Analysis and interpretation of accounting ratios....................................................................3
Limitations in the use of accounting ratios.............................................................................3
Other factors affecting Tesco.................................................................................................3
TASK 2............................................................................................................................................4
Calculation with investment appraisal techniques.................................................................4
Advantages and disadvantages of each technique..................................................................4
Recommendation....................................................................................................................5
REFERENCES................................................................................................................................6
Document Page
TASK 1
Analysis and interpretation of accounting ratios
From the table of different ratios, it has been determined that the profitability of Tesco since
2018 have declined to a slight difference till recent times. As only the gross profit margin have
increased in 2019, otherwise the total performance reduced by 2.1%. The main reason for
decrease may be increase in the operating expenses, high pay-out ratio to stakeholder etc. Tesco
Liquidity have increased in recent year which demonstrate that company hold enough current
assets in order to pay off any current liabilities if required without impacting any business
operation (Corea and Delfmann, 2018). Company hold good volume of cash at hand, bank and
other CA are also easily convertible into cash equivalent so that business contingency can be
controlled in appropriate time. Moreover, efficiency of such large supermarket chain also shows
a positive sign because the ratio of inventory convertible into sales have also reduced which
states Tesco can easily makes sales through its remaining stock level. The proportion of trade
receivable and payables have also reduced in year 2019 which clearly defines that customer are
making payment of outstanding bill on due dates which enables Tesco to pay out their
outstanding amount to suppliers on accurate time. This will help company to gain a good brand
value and expanded customer base which will increase the overall profit margin and financial
status in future year.
In the context of Tesco gearing capacity it has been identified that from 2018 there has been
continuous decrease in the ratio and in 2020 it was 159.38. Financial leverage showing to what
extent equity and debt finance finances the business of the company. In present business world,
the need of making smart decision is very important that help to survive a company very long in
the competitive environment. The foundation for the performance of the company is decision-
making in management. Such decisions, together with company core values and will evaluate the
corporate morality and principles. Moreover, loan arrangements can include Tesco working on
an appropriate gear ratio basis with clear guidelines (Course, 2015).
Limitations in the use of accounting ratios
1. The Tesco will change its financial report at the end this year to boost its ratios. So the
percentages are just window dressing.
Document Page
2. Ratios neglect inflation-related market shifts and m any statistics are useful with historical
expenses and dismiss the current price alterations here between periods (Laursen and
Thorlund, 2016).
Other factors affecting Tesco
The recent fraud in 2018 was a very ashamed event for Tesco, as it top management
executive found to be corrupt and doing wrong business practices as well as manipulation with
accounting figures since 2014. This lead to a serious issue within company impacting to reduce
the goodwill and as a result the overall share price reduces for the period of 6 month or more.
Different stakeholders have withdrawn their capital and new have not shown any sort of interest
which impacted the overall functioning of Tesco in respective accounting year. On further
promising to sell the grocery operations in Thailand and Malaysia to the Charoen Pokphand
Company for a corporate valuation of $10.6 billion, Tesco expects to refund $6.6 billion to its
owners. Tesco manager said the agreement was subject to approval in Singapore and Malaysia
by its investors as well as regulatory requirements, as is planned during the second half of 2020.
TASK 2
Calculation with investment appraisal techniques
1. Payback period:
Model one (Super)
Initial investment: £500000
Year Cash flow Cumulative cash flow
1 160000 160000
2 160000 320000
3 160000 480000
4 160000 640000
5 160000 800000
After 5
years
(Scrap
value)
200000 100000
tabler-icon-diamond-filled.svg

Paraphrase This Document

Need a fresh take? Get an instant paraphrase of this document with our AI Paraphraser
Document Page
Payback period: Year before recovery + Amount to be recover / next years’ cash flow
Year before recovery: 3 year
Amount to be recover (500000-480000): 20000
Next years’ cash flow: 160000
Payback period: 3 + 20000/160000
= 3+0.125
= 3.125 or 3 years and 1.2 months will be taken to cover cost of project.
Model two (Deluxe)
Initial investment: £500000
Year Cash flow Cumulative cash flow
1 50000 50000
2 100000 150000
3 150000 300000
4 250000 550000
5 350000 900000
After 5
years
(Scrap
value)
300000 1200000
Year before recovery: 3 year
Amount to be recover (500000-300000): 200000
Next years’ cash flow: 250000
Payback period: 3 + 200000/250000
= 3+0.8
= 3.08 years of 3 years and 0.8 months will be taken to cover cost of project.
2. Accounting rate of return:
Document Page
Model one (Super)
Initial investment: £500000
Year Cash flow
1 160000
2 160000
3 160000
4 160000
5 160000
After 5
years
(Scrap
value)
200000
Total 1000000
Average accounting income= Total net income / number of years
= 1000000 / 5
= 200000
ARR: 200000/500000*100
= 40%
Model two (Deluxe)
Initial investment: £500000
Year Cash flow
1 50000
2 100000
3 150000
4 250000
5 350000
After 5
years
(Scrap
300000
Document Page
value)
Total 1200000
Average accounting income:
= 1200000 / 5
= 240000
ARR: 240000/500000*100
= 48%
3. Net present value:
Model one (Super)
Initial investment: £500000
Cost of capital: 15%
Year Cash
flow
PV
factor
Discounte
d cash
flow
1 16000
0 0.8696 139136
2 16000
0 0.7561 120976
3 16000
0 0.6575 105200
4 16000
0 0.5718 91488
5 16000
0 0.4972 79552
After
5
years
(Scrap
value)
20000
0 0.4972 99440
tabler-icon-diamond-filled.svg

Paraphrase This Document

Need a fresh take? Get an instant paraphrase of this document with our AI Paraphraser
Document Page
635792
NPV: Discounted cash flow – Initial investment
= 635792-500000
= £135792
Model two (Deluxe)
Initial investment: £500000
Year Cash
flow
PV
factor
Discounte
d cash
flow
1 50000 0.8696 43480
2 10000
0 0.7561 75610
3 15000
0 0.6575 98625
4 25000
0 0.5718 142950
5 35000
0 0.4972 174020
After
5
years
(Scrap
value)
30000
0 0.4972 149160
683845
NPV: 683845-500000
Document Page
= £83845
4. Internal rate of return:
Model one (Super)
Initial investment: £500000
R1= 12%
R2= 18%
NPV 1:
Year Cash
flow PV
factor
Discount
ed cash
flow
1 16000
0 0.893 142880
2 16000
0 0.797 127520
3 16000
0 0.712 113920
4 16000
0 0.636 101760
5 16000
0 0.567 90720
After
5
years
(Scrap
value)
20000
0 0.567
113400
690200
Document Page
NPV1: 690200-500000
= 190200
NPV 2:
Year Cash
flow PV
factor
Discount
ed cash
flow
1 16000
0
0.833
3 133328
2 16000
0
0.694
4 111104
3 16000
0
0.578
7 92592
4 16000
0
0.482
3 77168
5 16000
0
0.401
9 64304
After
5
years
(Scrap
value)
20000
0 0.401
9 80380
558876
NPV2: 558876-500000
= 58876
tabler-icon-diamond-filled.svg

Paraphrase This Document

Need a fresh take? Get an instant paraphrase of this document with our AI Paraphraser
Document Page
IRR: 12 + 190200/ (190200-58876) * (18-12)
= 12+190200/131324*6
= 12+1.45*6
= 12+8.69
= 20.70%
Model two (Deluxe)
Initial investment: £500000
R1= 12%
R2= 18%
NPV 1:
Year Cash
flow
PV
factor
Discounte
d cash
flow
1 50000 0.893 44650
2 10000
0 0.797 79700
3 15000
0 0.712 106800
4 25000
0 0.636 159000
5 35000
0 0.567 198450
After
5
years
30000
0 0.567
170100
Document Page
(Scrap
value)
758700
NPV1: 758700-500000
= 258700
NPV 2:
Year Cash
flow
PV
factor
Discounte
d cash
flow
1 50000 0.8333 41665
2 10000
0 0.6944 69440
3 15000
0 0.5787 86805
4 25000
0 0.4823 120575
5 35000
0 0.4019 140665
After
5
years
(Scrap
value)
30000
0 0.4019
120570
579720
NPV2: 579720-500000
chevron_up_icon
1 out of 16
circle_padding
hide_on_mobile
zoom_out_icon
[object Object]