Financial Management Report: McDonald's and Burger King Analysis
VerifiedAdded on 2023/01/12
|13
|3086
|52
Report
AI Summary
This financial management report presents a comparative analysis of McDonald's and Burger King, focusing on key financial metrics and ratio analysis. The report begins with an introduction to financial management, emphasizing its importance in business decision-making, particularly in investment, funding, and resource management. The main body of the report highlights the significance of financial analysis, including its role in assessing organizational performance, profitability, and liquidity. The study employs ratio analysis to evaluate the companies' profitability (gross profit margin, net profit margin), liquidity (current ratio, quick ratio), efficiency (inventory turnover ratio, asset turnover ratio), and leverage. Through this analysis, the report aims to assess the financial health of both companies, providing insights into their ability to generate returns, manage resources efficiently, and meet short-term obligations. The report concludes by synthesizing the findings to determine which company presents a more favorable investment opportunity, considering factors like profitability, liquidity, and financial risk, and it provides a recommendation for investors.

Financial Management
Paraphrase This Document
Need a fresh take? Get an instant paraphrase of this document with our AI Paraphraser
INTRODUCTION...........................................................................................................................3
MAIN BODY..................................................................................................................................3
Importance of the study...............................................................................................................3
Objective of the study..................................................................................................................4
Analysis and comparative assessment between two firms..........................................................4
CONCLUSION..............................................................................................................................12
INTRODUCTION
Financial management refers to planning, organising, directing and controlling financial
activities like the procurement and utilisation of the financial resources of the company. This
refers to application of principles of the general management for financial management in the
company. It helps the business in taking various business decisions such as investments,
procurement of funds and the management of existing financial resources of the company
(Madura, 2020). Report is based on the comparison and analysis of the financial statements of
Macdonald and the Burger King in the report. It is very important for the investors to carry out
proper analysis of the financial health and position of the company. it will also cover the
importance and objectives of the study.
MAIN BODY
Importance of the study
Financial analysis management plays an important part in analysing the efficient
management of the resources of the organisations. The study will analyse the financial statement
of both the enterprise. Financial analysis is important for understanding the internal working and
functioning of the organisation. It shows the performance of the companies during the given
period. In the financial analysis investors will be able to make judgements about the firm that it
is performing well and also whether investing in such firms will be a right choice or not.
The study is important as it will analyse the profitability of the companies in during the
given period. It identifies the return over capital employees that shows the efficiency of the
company in using its available resources for generating returns. It will also enable the investors
to assess the return over equity (Jones And et.al., 2018). If the return provided by the companies
over its equity are not adequate by the companies investors are required to assess other
information related with performance of company. This requires the business to have adequate
returns over the investments of members. Investors mainly makes investments with the intent of
earning adequate returns. It also enables the company to assess the growth of the company for
ensuring whether the wealth of the shareholders are maximised if the returns are adequate or not.
The study is essential as it will also analyse the liquidity position of the company whether
it sis strong or weak. A company with weak liquidity position may not be beneficial in the long
⊘ This is a preview!⊘
Do you want full access?
Subscribe today to unlock all pages.
Trusted by 1+ million students worldwide
run. Company should have enough assets for meeting the short term obligation of the entity
(Shapiro and Hanouna, 2019). As per the standards company should have current assets around
twice of the current liabilities. Companies having ratio below this are weak in liquidity position.
It requires such businesses to take steps for enhancing the liquidity position of company.
Efficiency of the companies will be assessed using the ratio analysis. Company who is not
having efficient management of the resources face issues in the long run. This affects the long
term sustainability of the company. it assess the ability of company in generating sales over its
available assets, frequency of inventory movement and receivable’s turnover. It assess whether
company is having adequate working capital cash cycle. Company with inefficient in managing
its cash cycle incurs more of the short term liabilities reducing the profit levels.
It will also help the investors in assessing the financial risks of the company. It is essential
as company with high financial risks have reduced profits and may have adverse effect over the
long term sustainability of the company.
Objective of the study
Objective of study is to assess the performance of both the companies. To assess the
profitability of the company in carrying out the business and cost operations. investors will be
choosing the company with higher profit margins and also maximise the shareholder’s wealth.
Objective is to analyse the liquidity position of the companies, company with low liquidity are
considered less profitable in long run as they are not able to meet their short term obligation of
the company in the long run. Study will also asses the efficiency and capital structure of the
company as the management of the company should be able to use its resources efficiently for
generating returns over the available resources. It will also assess the debt and equity ratio of the
company for identifying the financial risks associated with the business. overall objective of the
study is of making the investment decision in two of the given companies after assessing their
financial statements.
Analysis and comparative assessment between two firms
Profitability ratios- It is the class of the financial metrics which are been used for
assessing an ability of the business in generating earning towards its revenues, balance sheet,
operating costs and shareholder equity over the time by making use of the data from particular
point of the time.
Paraphrase This Document
Need a fresh take? Get an instant paraphrase of this document with our AI Paraphraser
Mc
Donald'
s
Burger
king
Profitability ratios
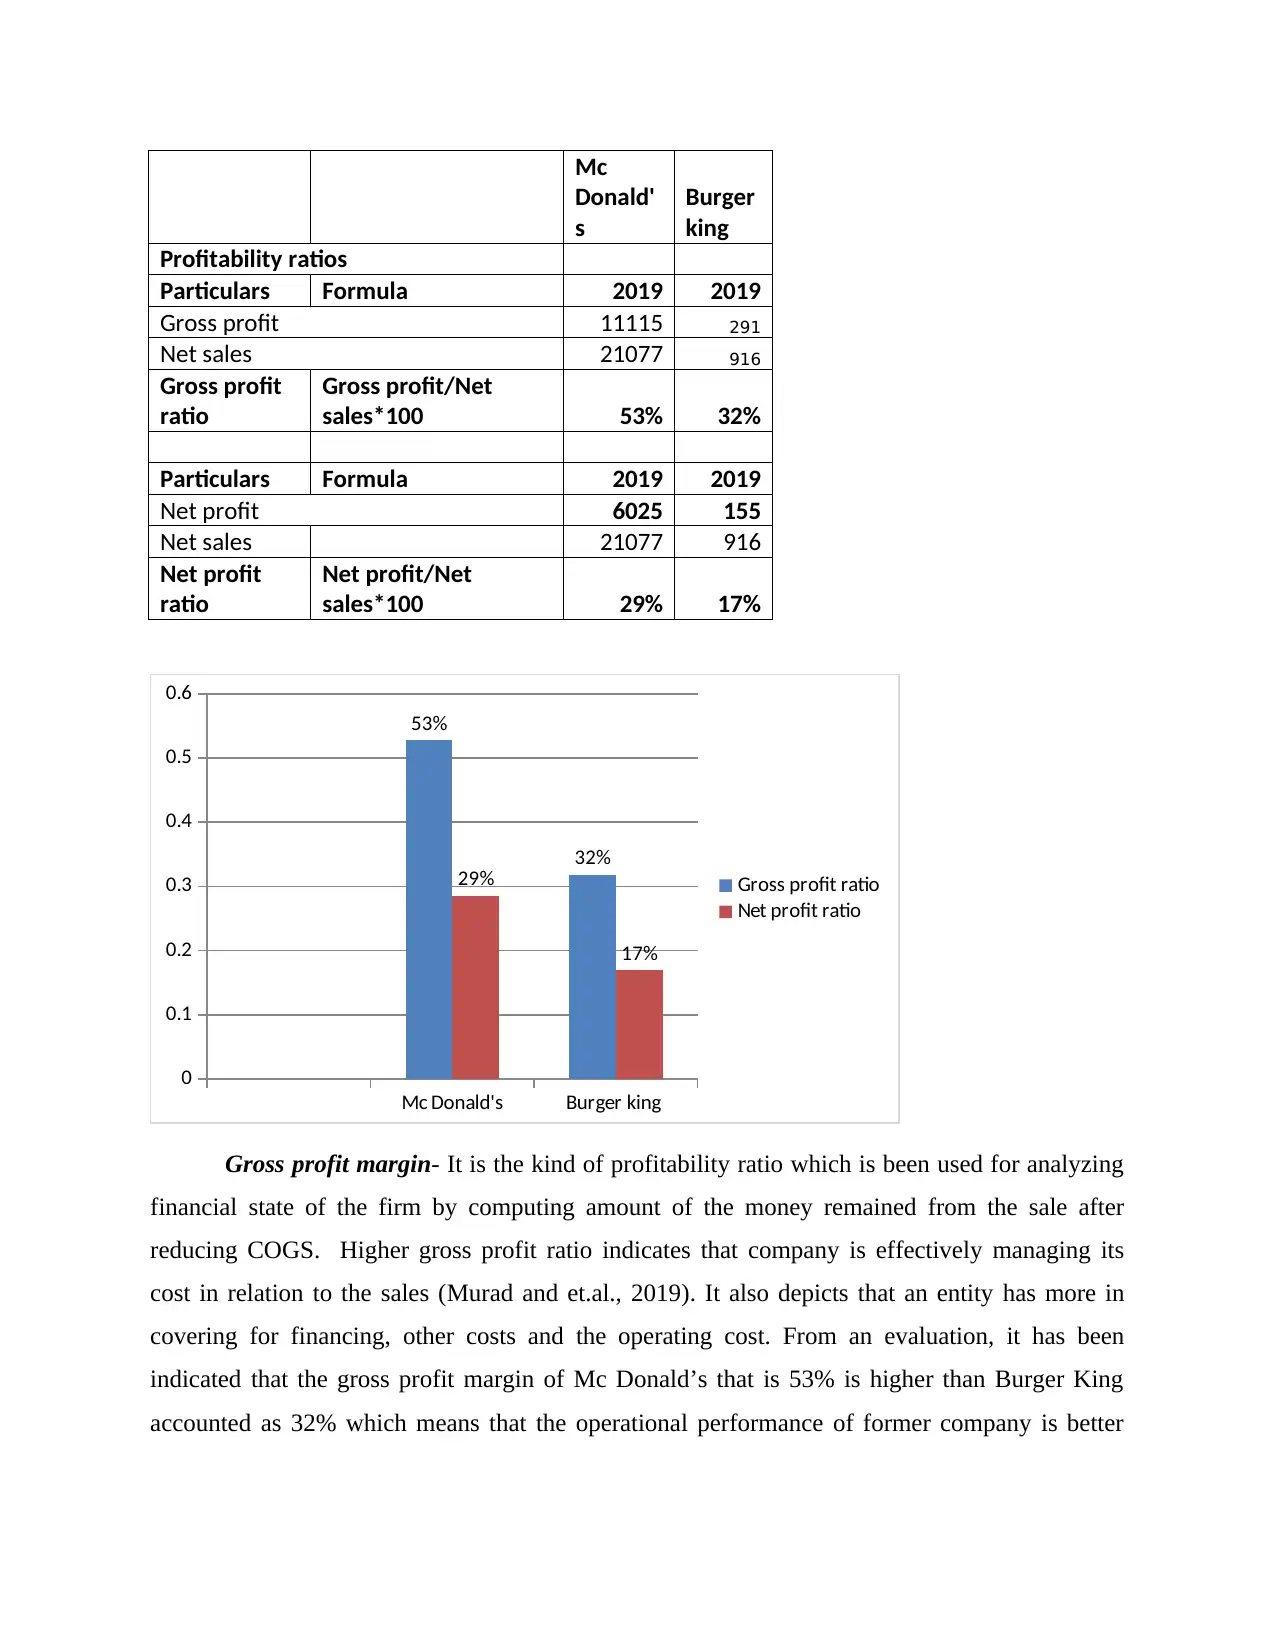
Particulars Formula 2019 2019
Gross profit 11115 291
Net sales 21077 916
Gross profit
ratio
Gross profit/Net
sales*100 53% 32%
Particulars Formula 2019 2019
Net profit 6025 155
Net sales 21077 916
Net profit
ratio
Net profit/Net
sales*100 29% 17%
Mc Donald's Burger king
0
0.1
0.2
0.3
0.4
0.5
0.6
53%
32%
29%
17%
Gross profit ratio
Net profit ratio
Gross profit margin- It is the kind of profitability ratio which is been used for analyzing
financial state of the firm by computing amount of the money remained from the sale after
reducing COGS. Higher gross profit ratio indicates that company is effectively managing its
cost in relation to the sales (Murad and et.al., 2019). It also depicts that an entity has more in
covering for financing, other costs and the operating cost. From an evaluation, it has been
indicated that the gross profit margin of Mc Donald’s that is 53% is higher than Burger King
accounted as 32% which means that the operational performance of former company is better
Donald'
s
Burger
king
Profitability ratios
Particulars Formula 2019 2019
Gross profit 11115 291
Net sales 21077 916
Gross profit
ratio
Gross profit/Net
sales*100 53% 32%
Particulars Formula 2019 2019
Net profit 6025 155
Net sales 21077 916
Net profit
ratio
Net profit/Net
sales*100 29% 17%
Mc Donald's Burger king
0
0.1
0.2
0.3
0.4
0.5
0.6
53%
32%
29%
17%
Gross profit ratio
Net profit ratio
Gross profit margin- It is the kind of profitability ratio which is been used for analyzing
financial state of the firm by computing amount of the money remained from the sale after
reducing COGS. Higher gross profit ratio indicates that company is effectively managing its
cost in relation to the sales (Murad and et.al., 2019). It also depicts that an entity has more in
covering for financing, other costs and the operating cost. From an evaluation, it has been
indicated that the gross profit margin of Mc Donald’s that is 53% is higher than Burger King
accounted as 32% which means that the operational performance of former company is better
than the latter company. It also reflects that the gross profit and net sales of Mc Donald is very
high as compared to Burger King.
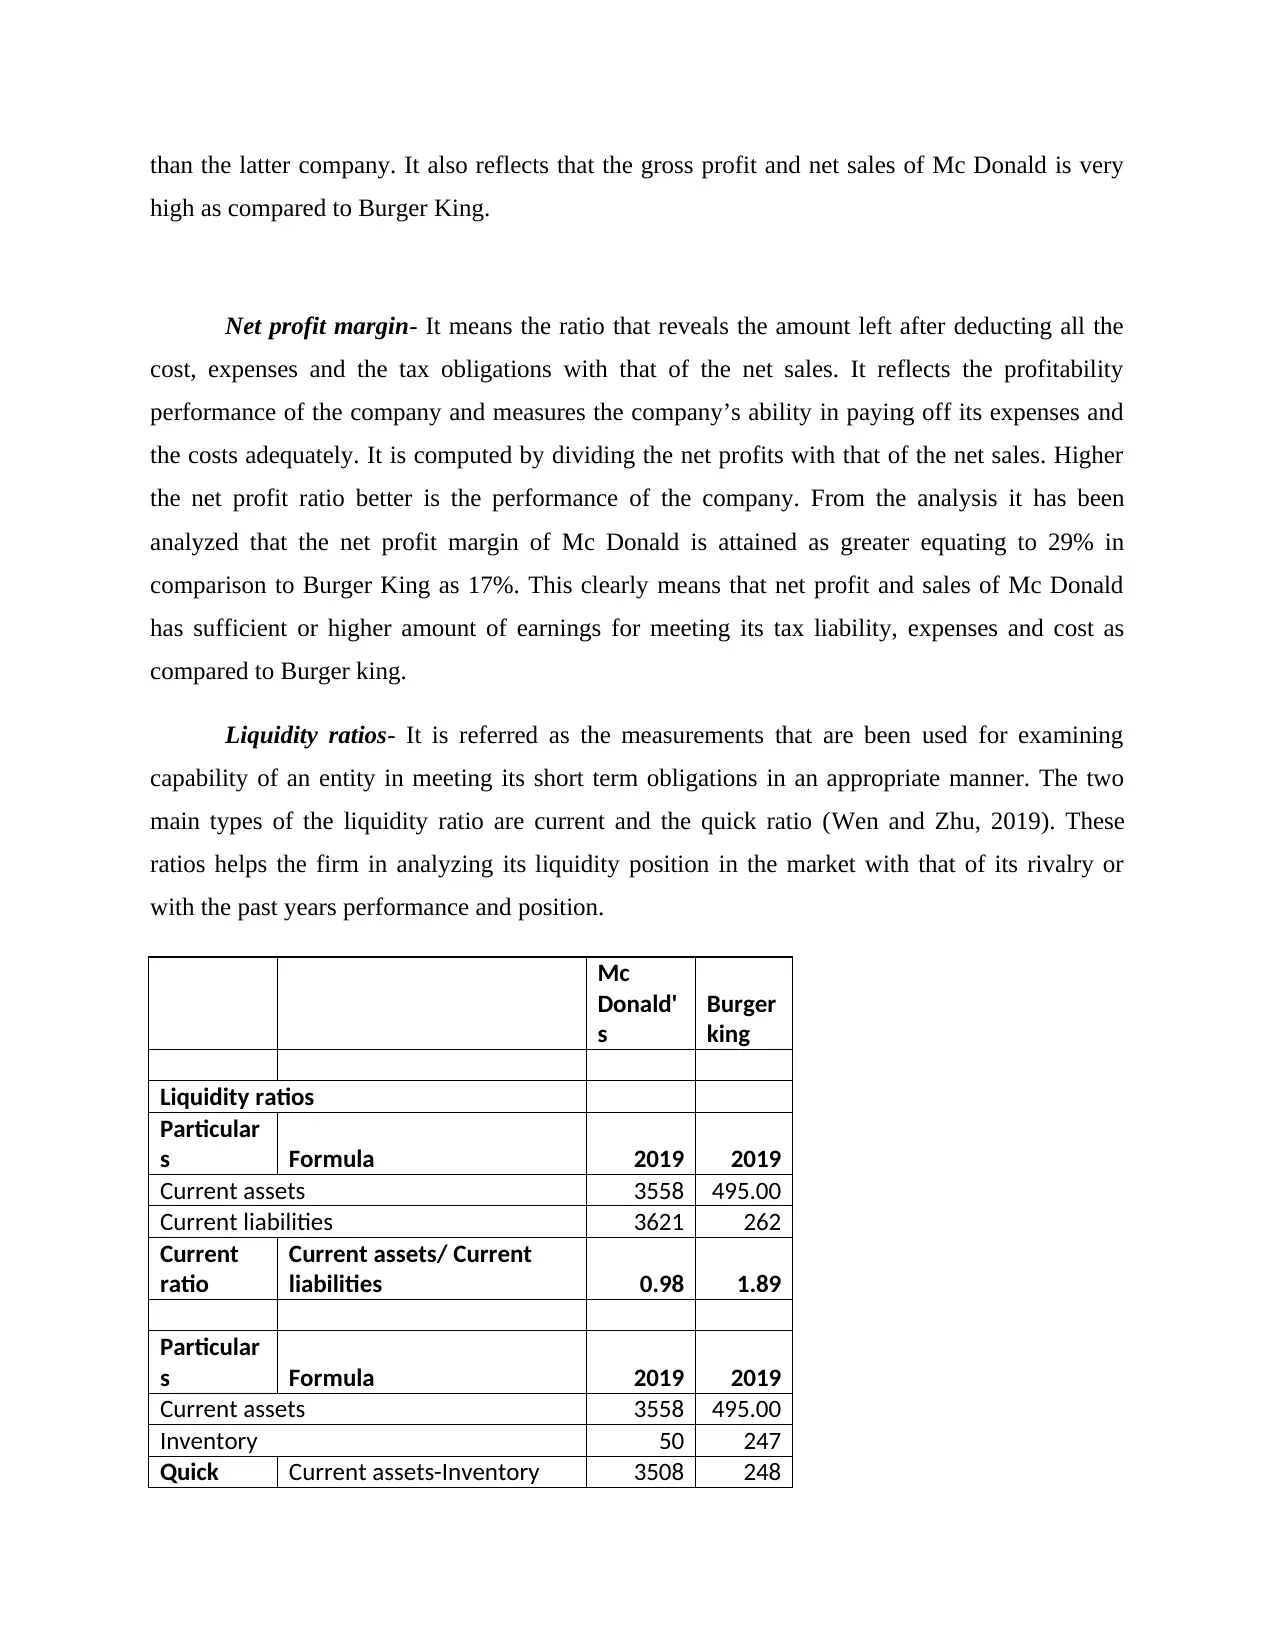
Net profit margin- It means the ratio that reveals the amount left after deducting all the
cost, expenses and the tax obligations with that of the net sales. It reflects the profitability
performance of the company and measures the company’s ability in paying off its expenses and
the costs adequately. It is computed by dividing the net profits with that of the net sales. Higher
the net profit ratio better is the performance of the company. From the analysis it has been
analyzed that the net profit margin of Mc Donald is attained as greater equating to 29% in
comparison to Burger King as 17%. This clearly means that net profit and sales of Mc Donald
has sufficient or higher amount of earnings for meeting its tax liability, expenses and cost as
compared to Burger king.
Liquidity ratios- It is referred as the measurements that are been used for examining
capability of an entity in meeting its short term obligations in an appropriate manner. The two
main types of the liquidity ratio are current and the quick ratio (Wen and Zhu, 2019). These
ratios helps the firm in analyzing its liquidity position in the market with that of its rivalry or
with the past years performance and position.
Mc
Donald'
s
Burger
king
Liquidity ratios
Particular
s Formula 2019 2019
Current assets 3558 495.00
Current liabilities 3621 262
Current
ratio
Current assets/ Current
liabilities 0.98 1.89
Particular
s Formula 2019 2019
Current assets 3558 495.00
Inventory 50 247
Quick Current assets-Inventory 3508 248
high as compared to Burger King.
Net profit margin- It means the ratio that reveals the amount left after deducting all the
cost, expenses and the tax obligations with that of the net sales. It reflects the profitability
performance of the company and measures the company’s ability in paying off its expenses and
the costs adequately. It is computed by dividing the net profits with that of the net sales. Higher
the net profit ratio better is the performance of the company. From the analysis it has been
analyzed that the net profit margin of Mc Donald is attained as greater equating to 29% in
comparison to Burger King as 17%. This clearly means that net profit and sales of Mc Donald
has sufficient or higher amount of earnings for meeting its tax liability, expenses and cost as
compared to Burger king.
Liquidity ratios- It is referred as the measurements that are been used for examining
capability of an entity in meeting its short term obligations in an appropriate manner. The two
main types of the liquidity ratio are current and the quick ratio (Wen and Zhu, 2019). These
ratios helps the firm in analyzing its liquidity position in the market with that of its rivalry or
with the past years performance and position.
Mc
Donald'
s
Burger
king
Liquidity ratios
Particular
s Formula 2019 2019
Current assets 3558 495.00
Current liabilities 3621 262
Current
ratio
Current assets/ Current
liabilities 0.98 1.89
Particular
s Formula 2019 2019
Current assets 3558 495.00
Inventory 50 247
Quick Current assets-Inventory 3508 248
⊘ This is a preview!⊘
Do you want full access?
Subscribe today to unlock all pages.
Trusted by 1+ million students worldwide
assets
Current liabilities 3621 262
Quick
ratio
Quick assets/Current
liabilities 0.97 0.95
Mc Donald's Burger king
0
0.2
0.4
0.6
0.8
1
1.2
1.4
1.6
1.8
2
0.98
1.89
0.97 0.95 Current ratio
Quick ratio
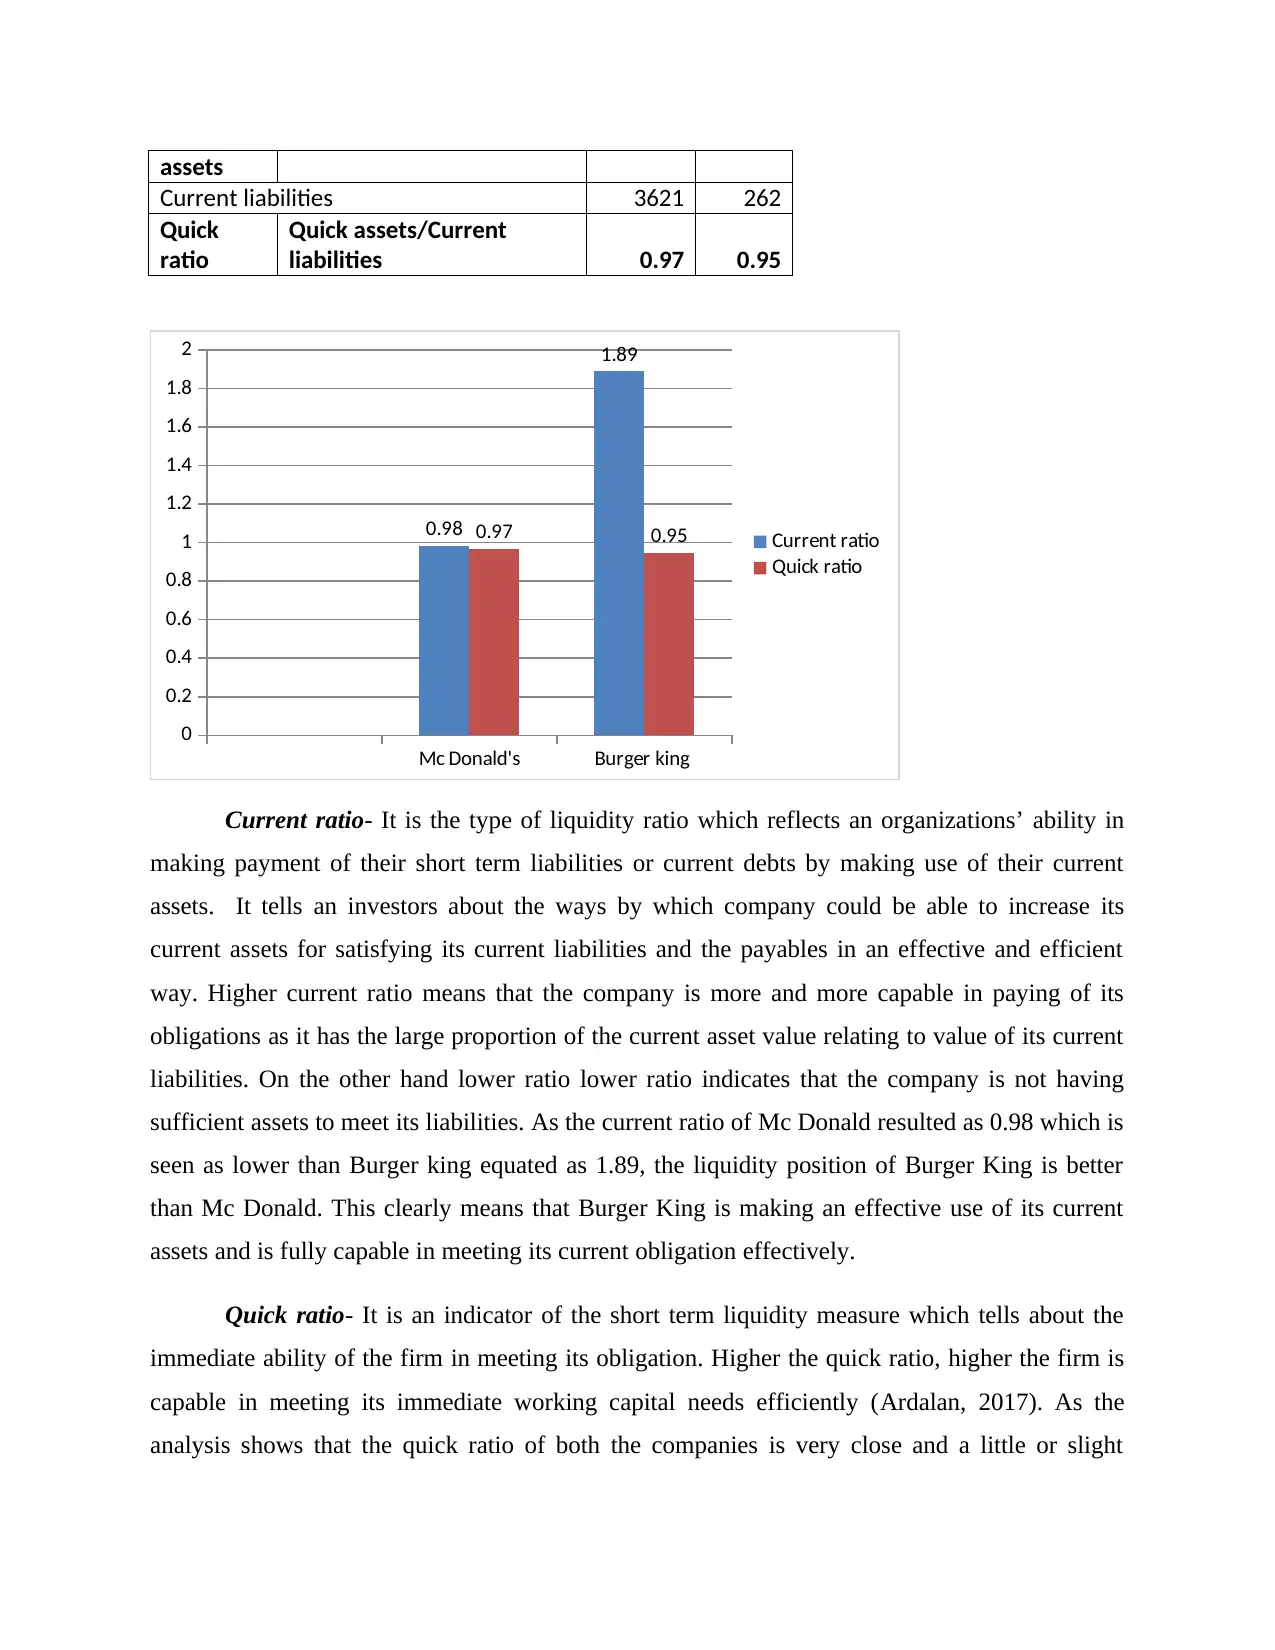
Current ratio- It is the type of liquidity ratio which reflects an organizations’ ability in
making payment of their short term liabilities or current debts by making use of their current
assets. It tells an investors about the ways by which company could be able to increase its
current assets for satisfying its current liabilities and the payables in an effective and efficient
way. Higher current ratio means that the company is more and more capable in paying of its
obligations as it has the large proportion of the current asset value relating to value of its current
liabilities. On the other hand lower ratio lower ratio indicates that the company is not having
sufficient assets to meet its liabilities. As the current ratio of Mc Donald resulted as 0.98 which is
seen as lower than Burger king equated as 1.89, the liquidity position of Burger King is better
than Mc Donald. This clearly means that Burger King is making an effective use of its current
assets and is fully capable in meeting its current obligation effectively.
Quick ratio- It is an indicator of the short term liquidity measure which tells about the
immediate ability of the firm in meeting its obligation. Higher the quick ratio, higher the firm is
capable in meeting its immediate working capital needs efficiently (Ardalan, 2017). As the
analysis shows that the quick ratio of both the companies is very close and a little or slight
Current liabilities 3621 262
Quick
ratio
Quick assets/Current
liabilities 0.97 0.95
Mc Donald's Burger king
0
0.2
0.4
0.6
0.8
1
1.2
1.4
1.6
1.8
2
0.98
1.89
0.97 0.95 Current ratio
Quick ratio
Current ratio- It is the type of liquidity ratio which reflects an organizations’ ability in
making payment of their short term liabilities or current debts by making use of their current
assets. It tells an investors about the ways by which company could be able to increase its
current assets for satisfying its current liabilities and the payables in an effective and efficient
way. Higher current ratio means that the company is more and more capable in paying of its
obligations as it has the large proportion of the current asset value relating to value of its current
liabilities. On the other hand lower ratio lower ratio indicates that the company is not having
sufficient assets to meet its liabilities. As the current ratio of Mc Donald resulted as 0.98 which is
seen as lower than Burger king equated as 1.89, the liquidity position of Burger King is better
than Mc Donald. This clearly means that Burger King is making an effective use of its current
assets and is fully capable in meeting its current obligation effectively.
Quick ratio- It is an indicator of the short term liquidity measure which tells about the
immediate ability of the firm in meeting its obligation. Higher the quick ratio, higher the firm is
capable in meeting its immediate working capital needs efficiently (Ardalan, 2017). As the
analysis shows that the quick ratio of both the companies is very close and a little or slight
Paraphrase This Document
Need a fresh take? Get an instant paraphrase of this document with our AI Paraphraser
difference of points is present between the two. This means that both the corporations have
adequate short term funds to meet their liabilities within a time frame.
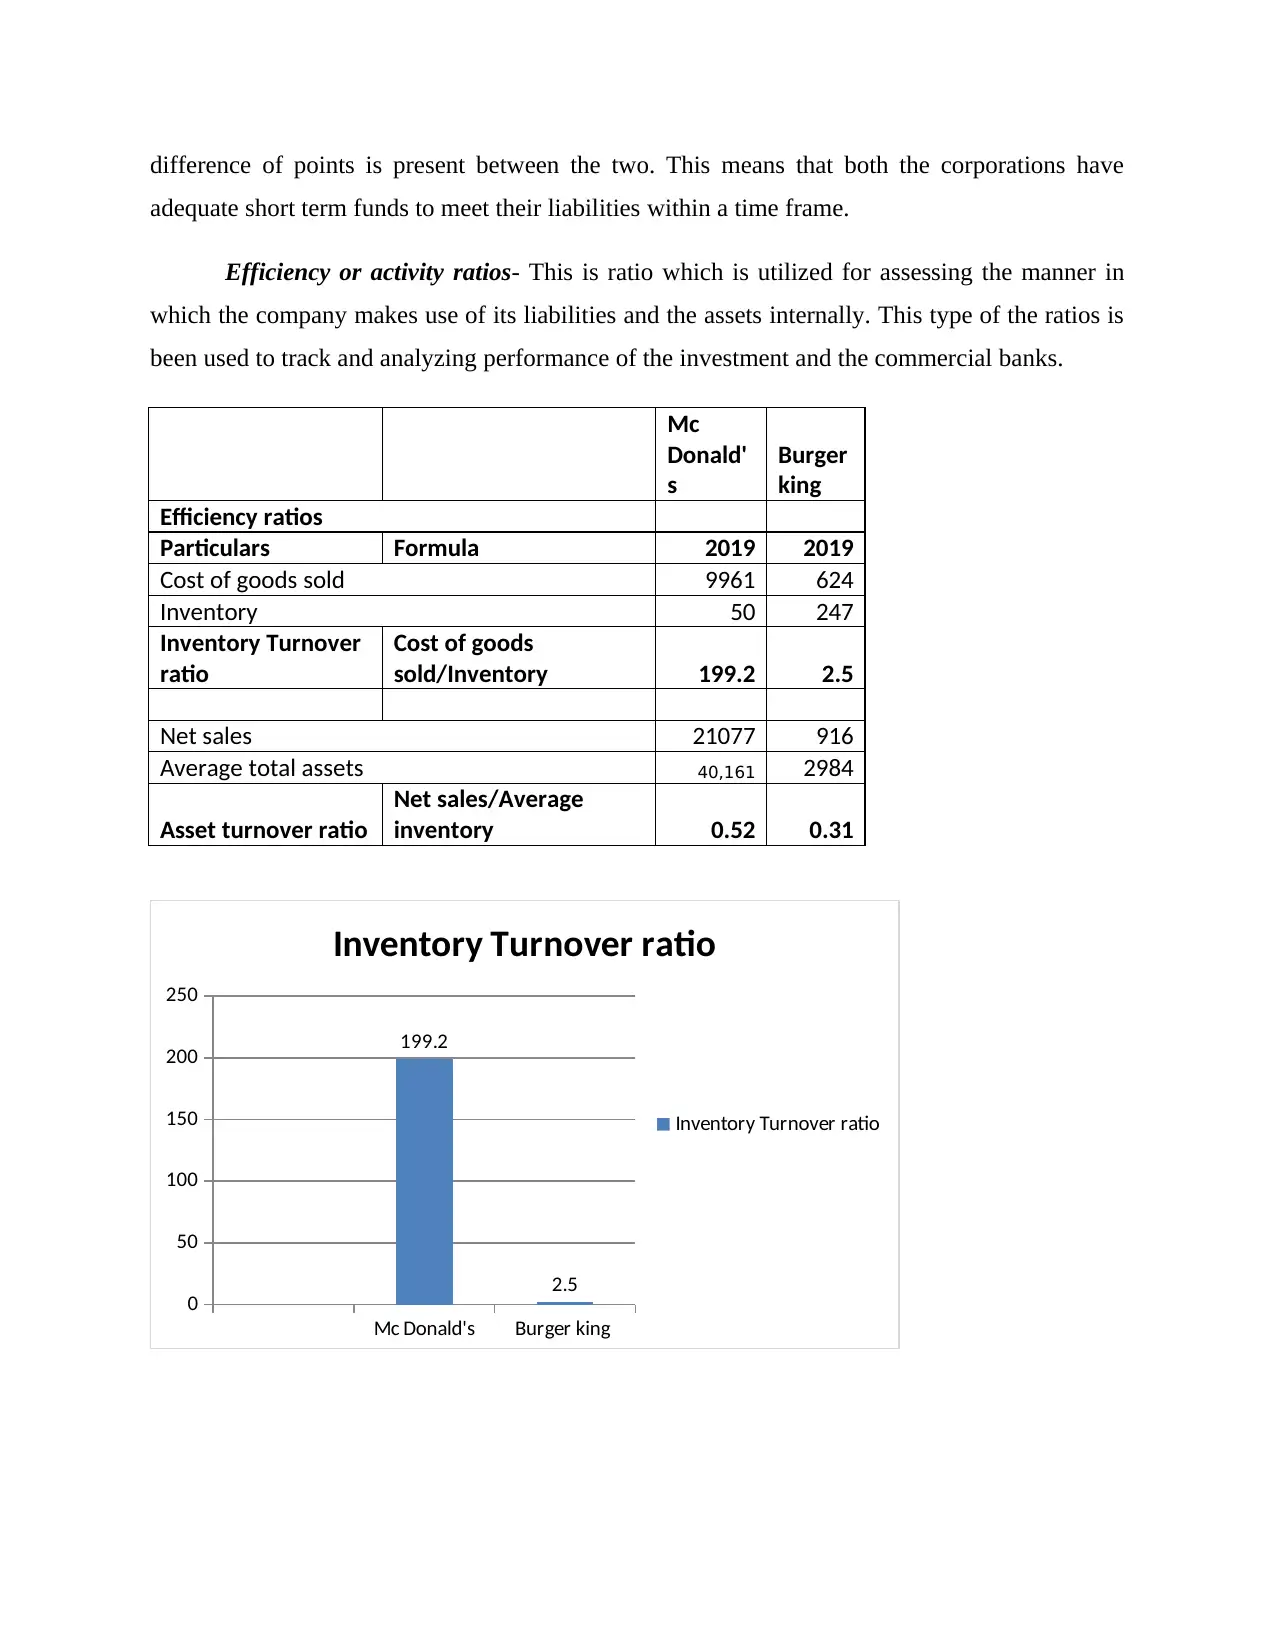
Efficiency or activity ratios- This is ratio which is utilized for assessing the manner in
which the company makes use of its liabilities and the assets internally. This type of the ratios is
been used to track and analyzing performance of the investment and the commercial banks.
Mc
Donald'
s
Burger
king
Efficiency ratios
Particulars Formula 2019 2019
Cost of goods sold 9961 624
Inventory 50 247
Inventory Turnover
ratio
Cost of goods
sold/Inventory 199.2 2.5
Net sales 21077 916
Average total assets 40,161 2984
Asset turnover ratio
Net sales/Average
inventory 0.52 0.31
Mc Donald's Burger king
0
50
100
150
200
250
199.2
2.5
Inventory Turnover ratio
Inventory Turnover ratio
adequate short term funds to meet their liabilities within a time frame.
Efficiency or activity ratios- This is ratio which is utilized for assessing the manner in
which the company makes use of its liabilities and the assets internally. This type of the ratios is
been used to track and analyzing performance of the investment and the commercial banks.
Mc
Donald'
s
Burger
king
Efficiency ratios
Particulars Formula 2019 2019
Cost of goods sold 9961 624
Inventory 50 247
Inventory Turnover
ratio
Cost of goods
sold/Inventory 199.2 2.5
Net sales 21077 916
Average total assets 40,161 2984
Asset turnover ratio
Net sales/Average
inventory 0.52 0.31
Mc Donald's Burger king
0
50
100
150
200
250
199.2
2.5
Inventory Turnover ratio
Inventory Turnover ratio
Mc Donald's Burger king
0
0.1
0.2
0.3
0.4
0.5
0.6
0.52
0.31
Asset turnover ratio
Asset turnover ratio
Inventory turnover ratio- It is the ratio that shows the number of time the company sold
or replaced its inventory during the given period. It is computed by dividing the cost of sales
with that of an inventory (Griffin and et.al., 2016). Higher ratio indicates stronger sales or an
insufficient inventory, however, lower ratio implies as the weak sales or excess inventory. From
the assessment, it has been identified that the inventory turnover ratio of Mc Donald is very high
in comparison to Burger King which means that it does not have sufficient inventory against its
sales. On the other hand the ratio of Burger King is seen as adequate which indicates that it
makes optimum use if its inventory for generating higher sales.
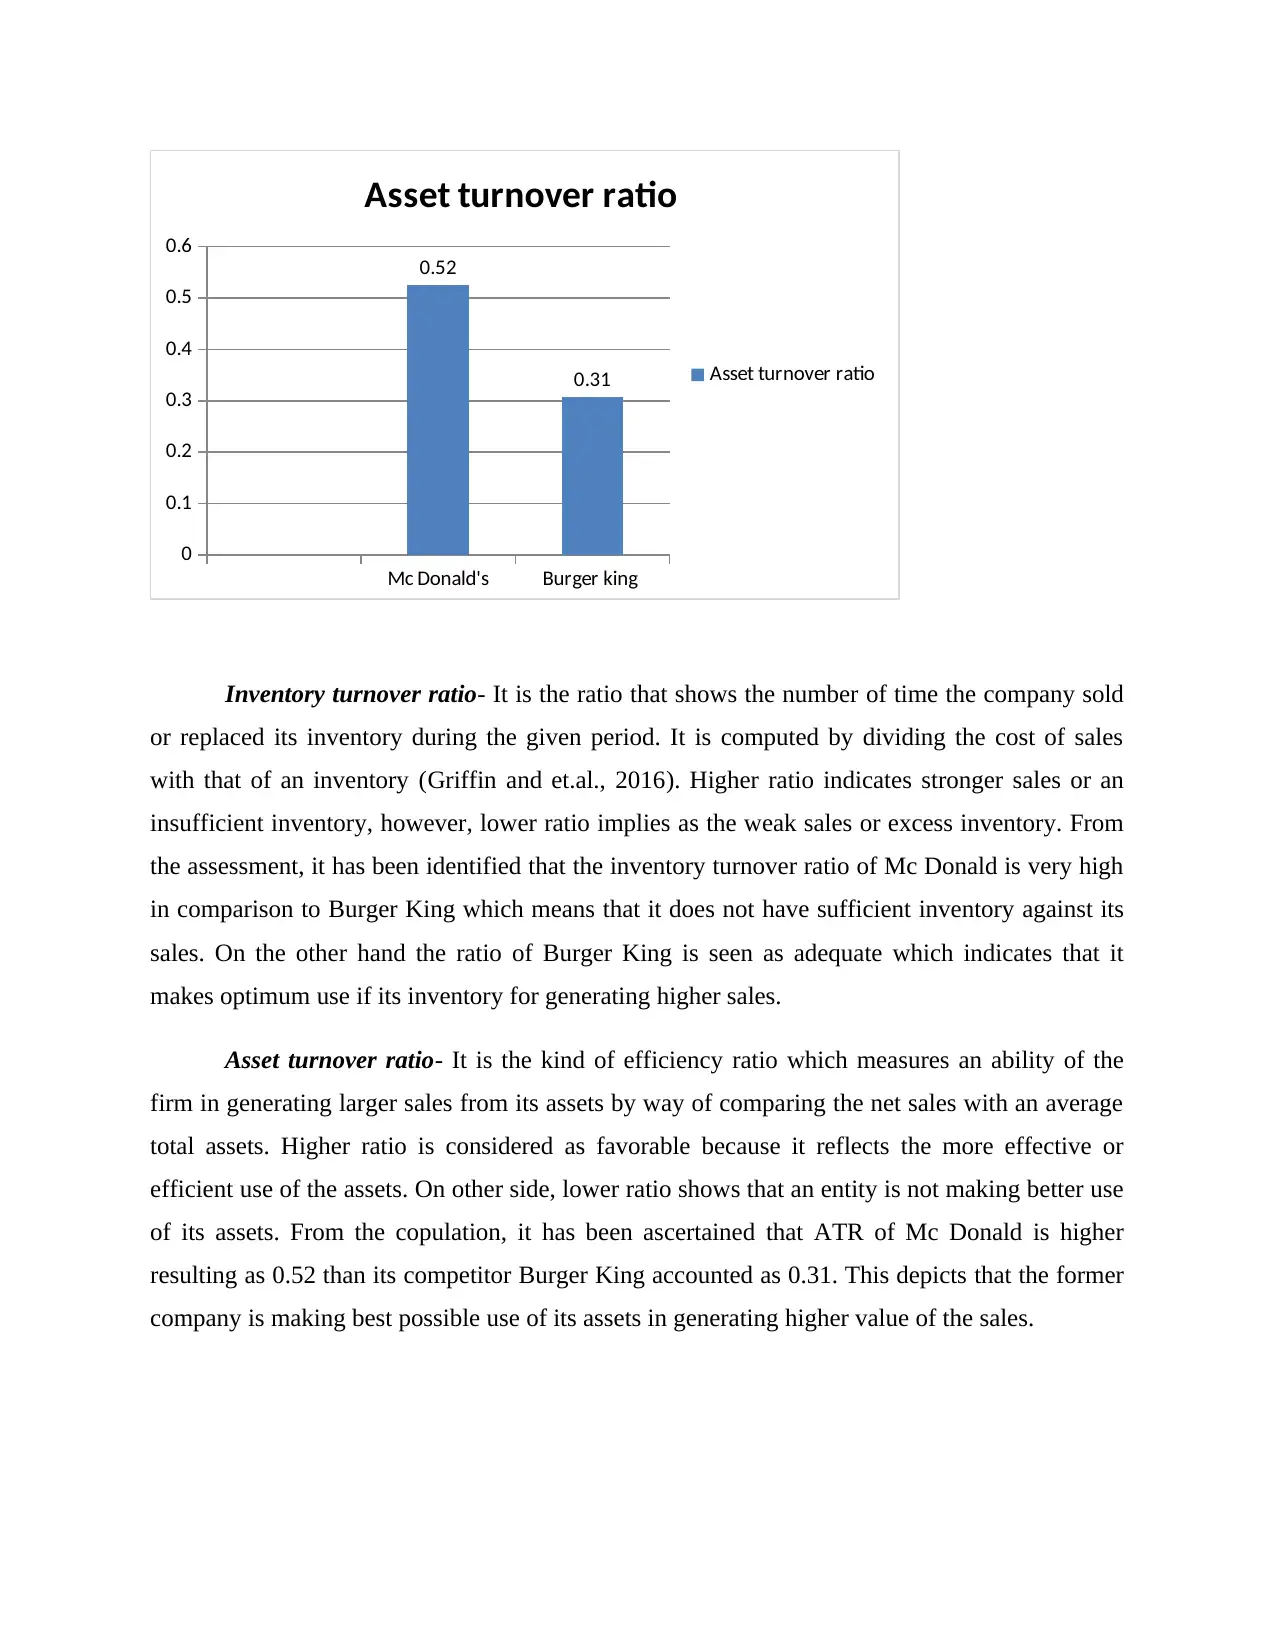
Asset turnover ratio- It is the kind of efficiency ratio which measures an ability of the
firm in generating larger sales from its assets by way of comparing the net sales with an average
total assets. Higher ratio is considered as favorable because it reflects the more effective or
efficient use of the assets. On other side, lower ratio shows that an entity is not making better use
of its assets. From the copulation, it has been ascertained that ATR of Mc Donald is higher
resulting as 0.52 than its competitor Burger King accounted as 0.31. This depicts that the former
company is making best possible use of its assets in generating higher value of the sales.
0
0.1
0.2
0.3
0.4
0.5
0.6
0.52
0.31
Asset turnover ratio
Asset turnover ratio
Inventory turnover ratio- It is the ratio that shows the number of time the company sold
or replaced its inventory during the given period. It is computed by dividing the cost of sales
with that of an inventory (Griffin and et.al., 2016). Higher ratio indicates stronger sales or an
insufficient inventory, however, lower ratio implies as the weak sales or excess inventory. From
the assessment, it has been identified that the inventory turnover ratio of Mc Donald is very high
in comparison to Burger King which means that it does not have sufficient inventory against its
sales. On the other hand the ratio of Burger King is seen as adequate which indicates that it
makes optimum use if its inventory for generating higher sales.
Asset turnover ratio- It is the kind of efficiency ratio which measures an ability of the
firm in generating larger sales from its assets by way of comparing the net sales with an average
total assets. Higher ratio is considered as favorable because it reflects the more effective or
efficient use of the assets. On other side, lower ratio shows that an entity is not making better use
of its assets. From the copulation, it has been ascertained that ATR of Mc Donald is higher
resulting as 0.52 than its competitor Burger King accounted as 0.31. This depicts that the former
company is making best possible use of its assets in generating higher value of the sales.
⊘ This is a preview!⊘
Do you want full access?
Subscribe today to unlock all pages.
Trusted by 1+ million students worldwide
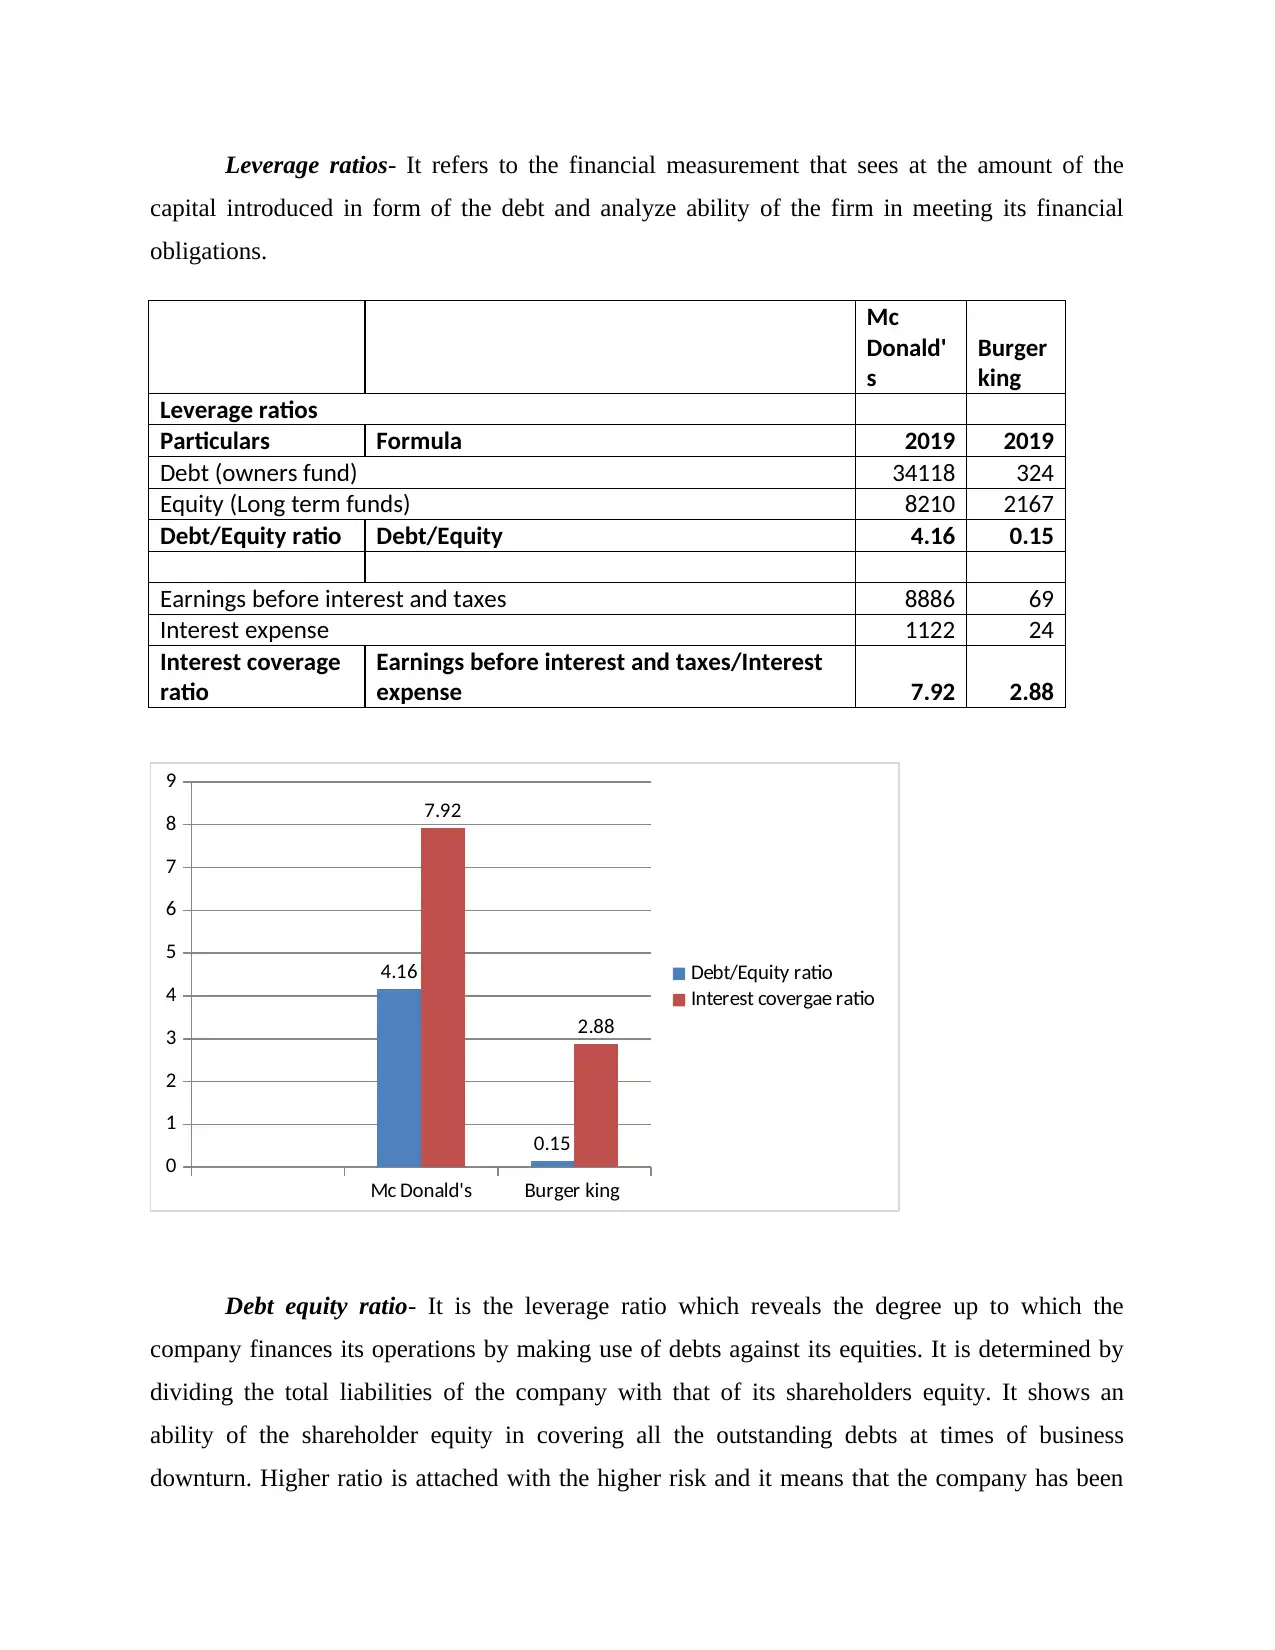
Leverage ratios- It refers to the financial measurement that sees at the amount of the
capital introduced in form of the debt and analyze ability of the firm in meeting its financial
obligations.
Mc
Donald'
s
Burger
king
Leverage ratios
Particulars Formula 2019 2019
Debt (owners fund) 34118 324
Equity (Long term funds) 8210 2167
Debt/Equity ratio Debt/Equity 4.16 0.15
Earnings before interest and taxes 8886 69
Interest expense 1122 24
Interest coverage
ratio
Earnings before interest and taxes/Interest
expense 7.92 2.88
Mc Donald's Burger king
0
1
2
3
4
5
6
7
8
9
4.16
0.15
7.92
2.88
Debt/Equity ratio
Interest covergae ratio
Debt equity ratio- It is the leverage ratio which reveals the degree up to which the
company finances its operations by making use of debts against its equities. It is determined by
dividing the total liabilities of the company with that of its shareholders equity. It shows an
ability of the shareholder equity in covering all the outstanding debts at times of business
downturn. Higher ratio is attached with the higher risk and it means that the company has been
Paraphrase This Document
Need a fresh take? Get an instant paraphrase of this document with our AI Paraphraser
seen as aggressive towards financing its debt with that of the growth. However, lower ratio is
found as better for an enterprise because it reflects that less borrowed funds are used for funding
that in turn reduces the financial risk. As Burger King is having lower debt equity ratio, it means
that its leverage position is better than Mc Donald and its long term borrowings against equities
are lower.
Interest coverage ratio- It is referred as measurement of an entity’s ability in meeting its
interest related obligations. It is expressed as dividing earnings before interest and the taxes with
that of interest expenses (Annual report of Burger King, 2018). Higher ICR seems as better because
it shows that the firm is earning enough profits to meet its interest expenses. On other state,
lower ratio indicates that the company is not generating sufficient profits in order to pay off its
interest relating liabilities. The assessment depicts that the ICR of Mc Donald is greater than
Burger King which in turn indicates that company is earning higher profits than its competitors
so that it could pay off its interest obligation effectively.
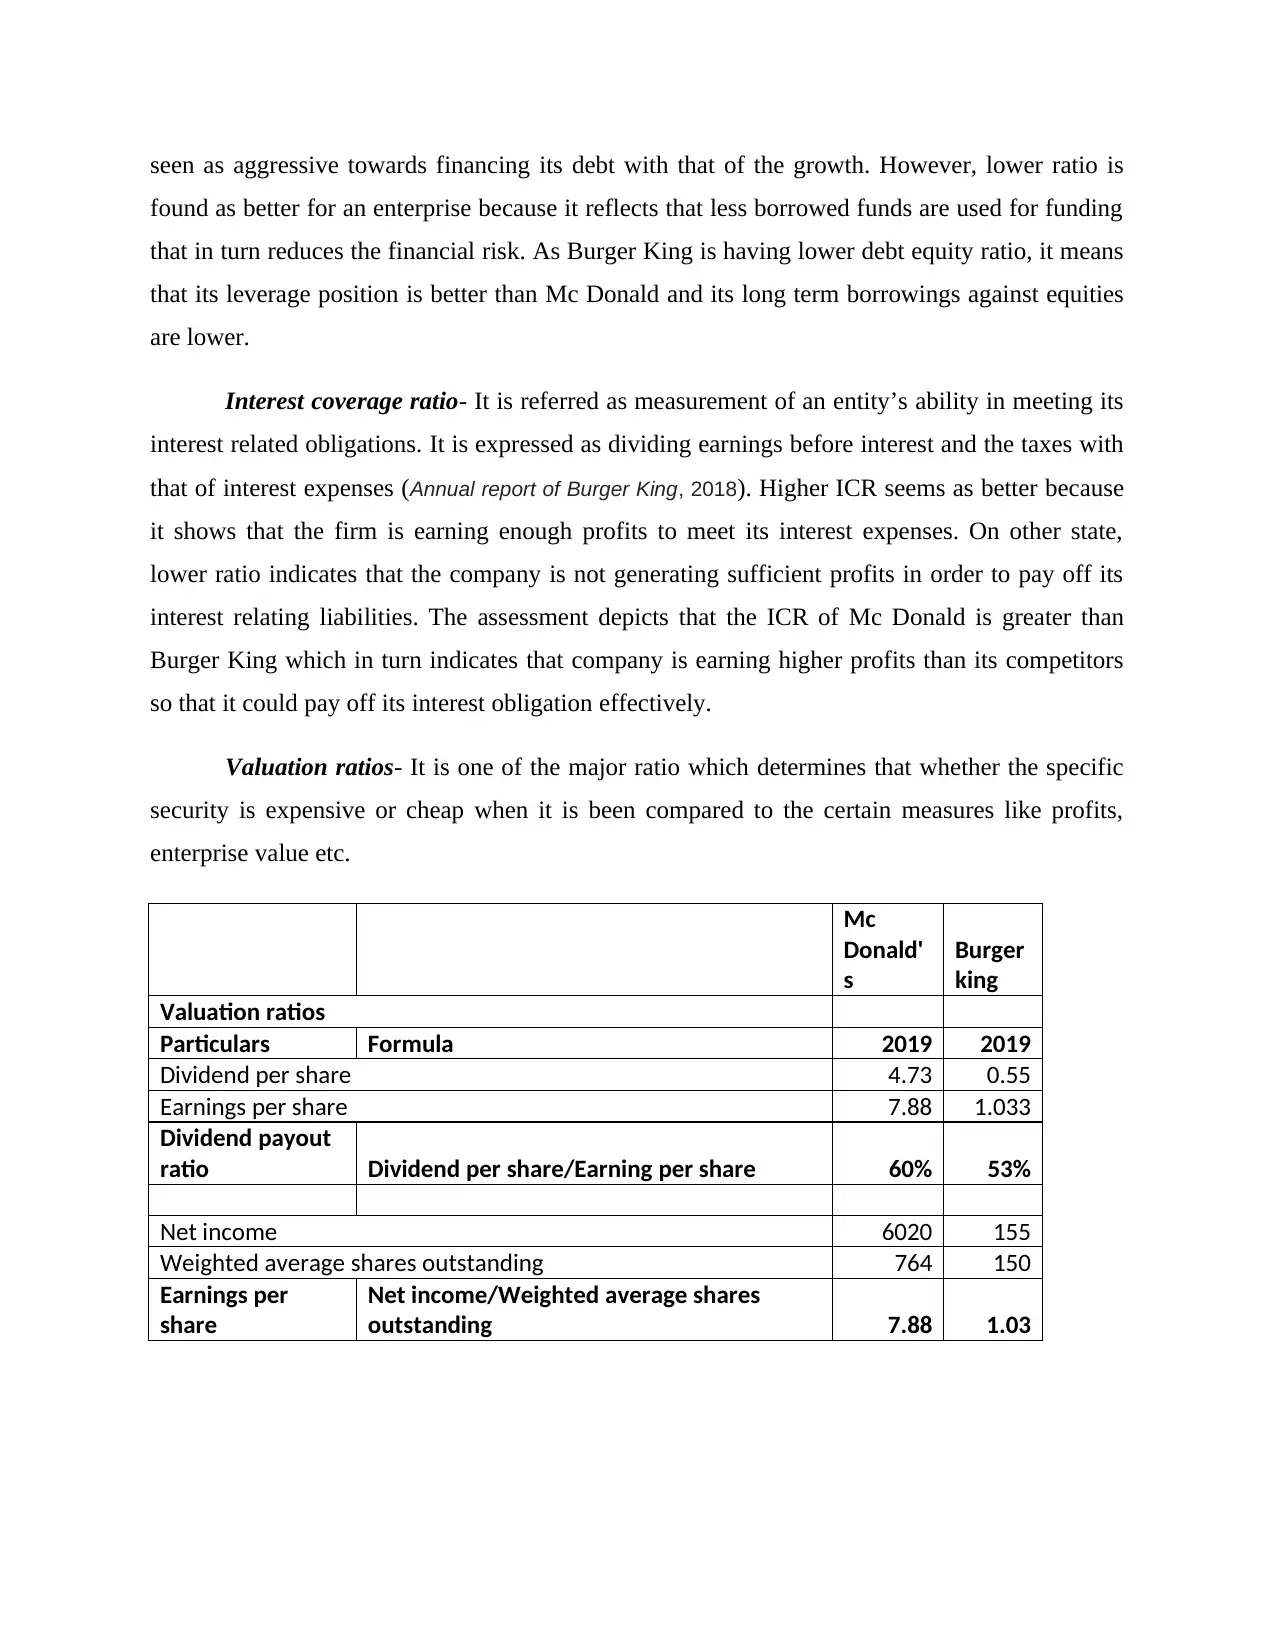
Valuation ratios- It is one of the major ratio which determines that whether the specific
security is expensive or cheap when it is been compared to the certain measures like profits,
enterprise value etc.
Mc
Donald'
s
Burger
king
Valuation ratios
Particulars Formula 2019 2019
Dividend per share 4.73 0.55
Earnings per share 7.88 1.033
Dividend payout
ratio Dividend per share/Earning per share 60% 53%
Net income 6020 155
Weighted average shares outstanding 764 150
Earnings per
share
Net income/Weighted average shares
outstanding 7.88 1.03
found as better for an enterprise because it reflects that less borrowed funds are used for funding
that in turn reduces the financial risk. As Burger King is having lower debt equity ratio, it means
that its leverage position is better than Mc Donald and its long term borrowings against equities
are lower.
Interest coverage ratio- It is referred as measurement of an entity’s ability in meeting its
interest related obligations. It is expressed as dividing earnings before interest and the taxes with
that of interest expenses (Annual report of Burger King, 2018). Higher ICR seems as better because
it shows that the firm is earning enough profits to meet its interest expenses. On other state,
lower ratio indicates that the company is not generating sufficient profits in order to pay off its
interest relating liabilities. The assessment depicts that the ICR of Mc Donald is greater than
Burger King which in turn indicates that company is earning higher profits than its competitors
so that it could pay off its interest obligation effectively.
Valuation ratios- It is one of the major ratio which determines that whether the specific
security is expensive or cheap when it is been compared to the certain measures like profits,
enterprise value etc.
Mc
Donald'
s
Burger
king
Valuation ratios
Particulars Formula 2019 2019
Dividend per share 4.73 0.55
Earnings per share 7.88 1.033
Dividend payout
ratio Dividend per share/Earning per share 60% 53%
Net income 6020 155
Weighted average shares outstanding 764 150
Earnings per
share
Net income/Weighted average shares
outstanding 7.88 1.03
Mc Donald's Burger king
0
1
2
3
4
5
6
7
8
9
60% 53%
7.88
1.03
Dividend payout ratio
Earning per share
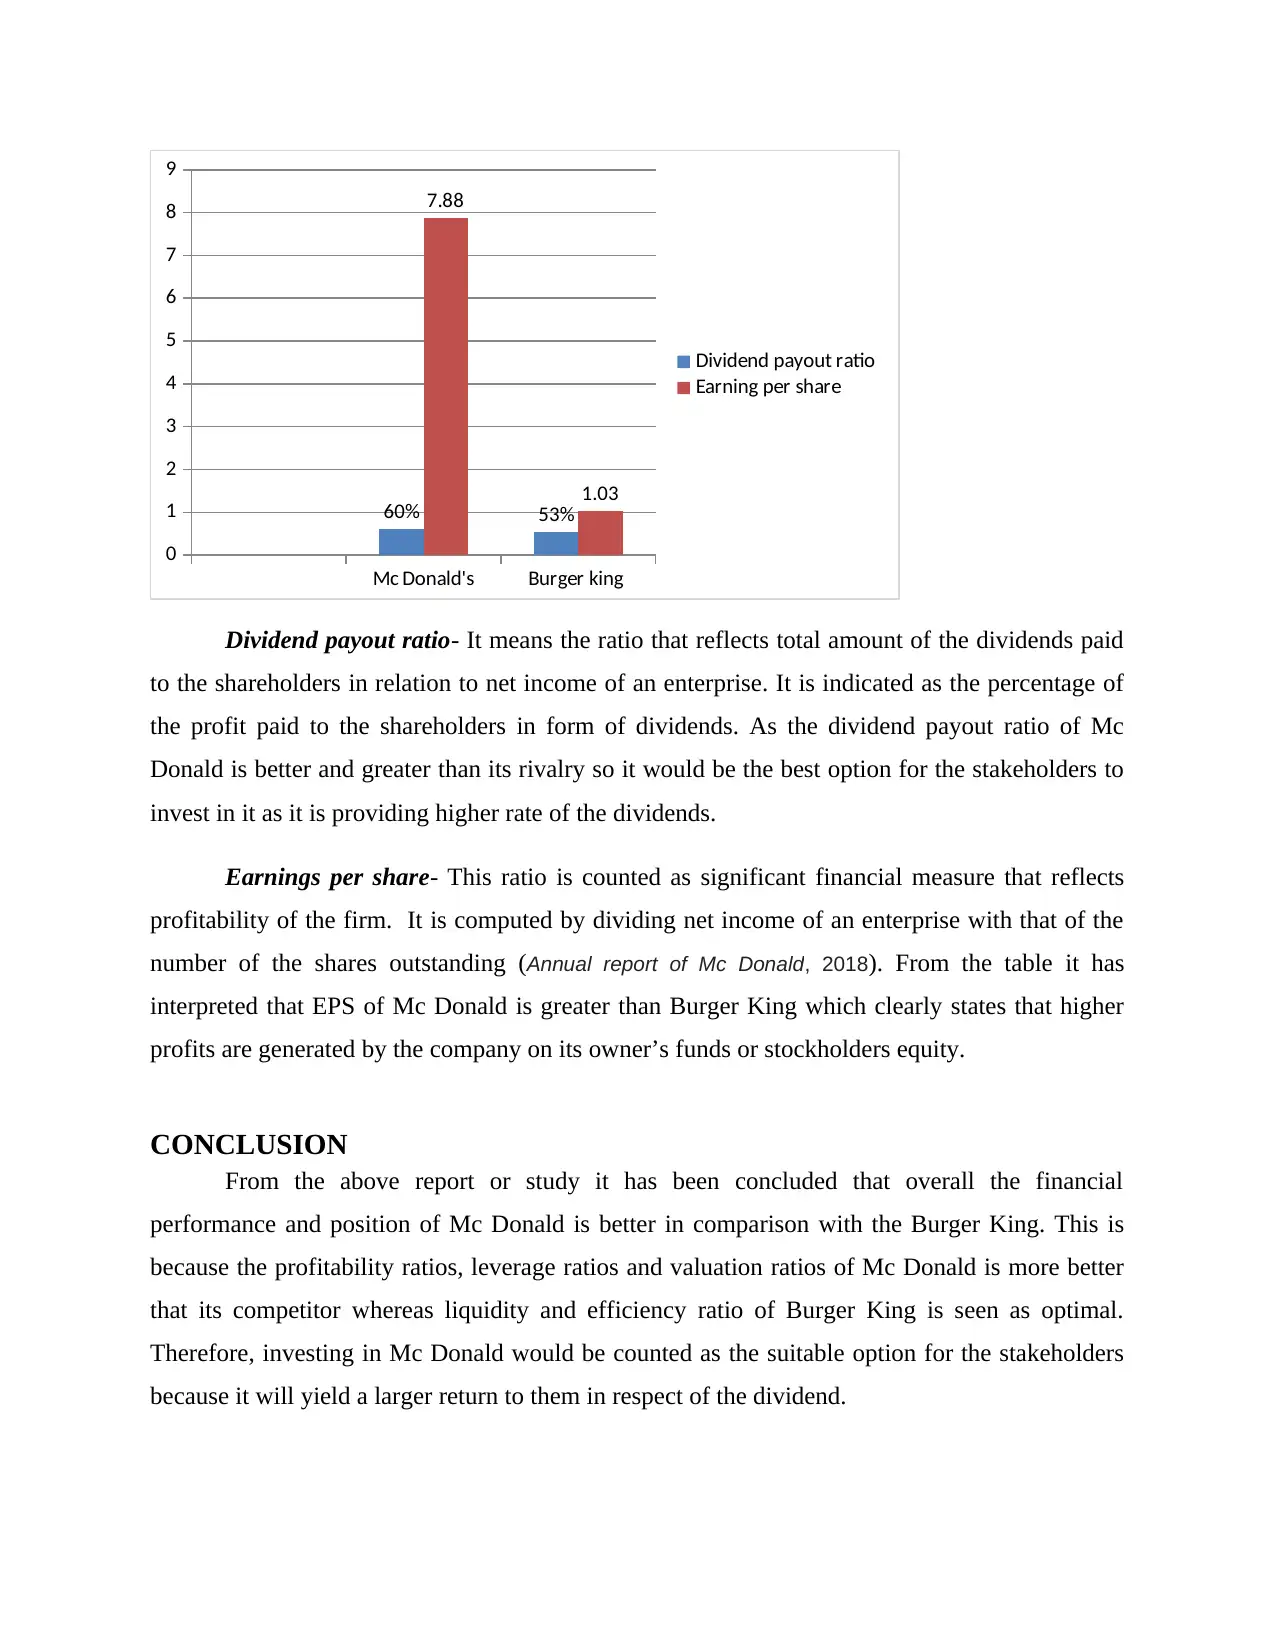
Dividend payout ratio- It means the ratio that reflects total amount of the dividends paid
to the shareholders in relation to net income of an enterprise. It is indicated as the percentage of
the profit paid to the shareholders in form of dividends. As the dividend payout ratio of Mc
Donald is better and greater than its rivalry so it would be the best option for the stakeholders to
invest in it as it is providing higher rate of the dividends.
Earnings per share- This ratio is counted as significant financial measure that reflects
profitability of the firm. It is computed by dividing net income of an enterprise with that of the
number of the shares outstanding (Annual report of Mc Donald, 2018). From the table it has
interpreted that EPS of Mc Donald is greater than Burger King which clearly states that higher
profits are generated by the company on its owner’s funds or stockholders equity.
CONCLUSION
From the above report or study it has been concluded that overall the financial
performance and position of Mc Donald is better in comparison with the Burger King. This is
because the profitability ratios, leverage ratios and valuation ratios of Mc Donald is more better
that its competitor whereas liquidity and efficiency ratio of Burger King is seen as optimal.
Therefore, investing in Mc Donald would be counted as the suitable option for the stakeholders
because it will yield a larger return to them in respect of the dividend.
0
1
2
3
4
5
6
7
8
9
60% 53%
7.88
1.03
Dividend payout ratio
Earning per share
Dividend payout ratio- It means the ratio that reflects total amount of the dividends paid
to the shareholders in relation to net income of an enterprise. It is indicated as the percentage of
the profit paid to the shareholders in form of dividends. As the dividend payout ratio of Mc
Donald is better and greater than its rivalry so it would be the best option for the stakeholders to
invest in it as it is providing higher rate of the dividends.
Earnings per share- This ratio is counted as significant financial measure that reflects
profitability of the firm. It is computed by dividing net income of an enterprise with that of the
number of the shares outstanding (Annual report of Mc Donald, 2018). From the table it has
interpreted that EPS of Mc Donald is greater than Burger King which clearly states that higher
profits are generated by the company on its owner’s funds or stockholders equity.
CONCLUSION
From the above report or study it has been concluded that overall the financial
performance and position of Mc Donald is better in comparison with the Burger King. This is
because the profitability ratios, leverage ratios and valuation ratios of Mc Donald is more better
that its competitor whereas liquidity and efficiency ratio of Burger King is seen as optimal.
Therefore, investing in Mc Donald would be counted as the suitable option for the stakeholders
because it will yield a larger return to them in respect of the dividend.
⊘ This is a preview!⊘
Do you want full access?
Subscribe today to unlock all pages.
Trusted by 1+ million students worldwide
1 out of 13
Related Documents


Your All-in-One AI-Powered Toolkit for Academic Success.
+13062052269
info@desklib.com
Available 24*7 on WhatsApp / Email
![[object Object]](/_next/static/media/star-bottom.7253800d.svg)
Unlock your academic potential
Copyright © 2020–2026 A2Z Services. All Rights Reserved. Developed and managed by ZUCOL.