Financial Analysis Report on Farsons and Heineken's Financials
VerifiedAdded on 2023/01/18
|26
|6837
|66
Report
AI Summary
This report presents a comprehensive financial analysis comparing Simonds Farsons Cisk plc. and Heineken, focusing on providing financial advice to a beer can manufacturer regarding potential suppliers. The analysis employs vertical, horizontal, and ratio analysis techniques to evaluate the financial performance and position of both companies from 2015 to 2018. The report examines income statements and balance sheets, assessing key metrics such as sales revenue, cost of revenue, inventory levels, and creditor amounts. Furthermore, it includes an evaluation of working capital and cash flow to offer informed recommendations. The findings indicate that while Farsons demonstrates stronger profitability, Heineken exhibits more robust growth and efficient creditor management. The report concludes with specific recommendations for the beer can manufacturer, considering factors like supplier payment policies and overall financial health to determine the most suitable business partner.
Financial Analysis Management &
Enterprise
Enterprise
Paraphrase This Document
Need a fresh take? Get an instant paraphrase of this document with our AI Paraphraser
Contents
INTRODUCTION...........................................................................................................................1
Overview of the companies.........................................................................................................1
Evaluation of the financial performance and financial position of FARSONS and HEINIKEN....1
Vertical analysis of the financial statements...............................................................................1
Horizontal analysis of the financial statements...........................................................................3
Ratio analysis of the financial statements....................................................................................4
EVALUATION OF THE WORKING CAPITAL..........................................................................7
EVALUATION OF THE CASH FLOW........................................................................................8
CONCLUSION AND RECOMMENDATIONS............................................................................9
REFERENCES..............................................................................................................................10
APPENDIX....................................................................................................................................11

⊘ This is a preview!⊘
Do you want full access?
Subscribe today to unlock all pages.
Trusted by 1+ million students worldwide
INTRODUCTION
Financial analysis management is the procedure of analysing the financial performance and
position of an organisation in order to make reliable decisions (Blum and Dacorogna, 2014). This
management assists stakeholders in making calculated decisions so that they can earn reliable
returns of their investments (Bragg, 2012). The main aim of this report is to develop an
understanding about the ways by which financial information can be evaluated. In this report,
financial advice to a beer can manufacturer will be provided regarding to which company, this
organisation can supply their produce goods. The options which are available to this beer can
manufacturer are Farsons and Heineken. In this report, financial analysis against both these
companies are done using horizontal, vertical and ratio analysis. Along with working capital a
cash flow analysis is also done in this report to provide valid recommendations to the beer can
manufacturer.
Overview of the companies
Simonds Farsons Cisk plc. is a food and beverage company which is involved in
operations of brewing, manufacturing, sale and distribution of beers and other soft drinks. This is
a public limited company and its shares are listed at Malta stock exchange. This company was
established in 1928 and since then it is growing with a rapid pace, due to which it has a reliable
image in the market (Annual Report of Farsons, 2019).
Heineken is a beer manufacturing company which is dealing in operations such as brewing,
production, marketing and sales of the beer around the world. This company is engaged in huge
marketing activities due to sales revenue of this company is much higher than its competitors due
to which it is considered by the beer can manufacturer (Annual Report of Heineken, 2019).
Evaluation of the financial performance and financial position of FARSONS
and HEINIKEN
Vertical analysis of the financial statements
Vertical analysis is a technique of analysing the financial statements by considering one
element of financial statement as a base figure (usually sales revenue) and then comparing other
elements with it so that it can decided how other elements effect the sales of an organisation
(Christensen, Cottrell and Baker, 2013). In present case, this analysis is done on two companies’
1
Paraphrase This Document
Need a fresh take? Get an instant paraphrase of this document with our AI Paraphraser
financial statements of four years (2015-2018) which is attached in appendix; commentary based
on that analysis is developed as below.
Vertical analysis of Simonds Farsons Cisk plc. (Income Statement)
Sales revenue is selected as the base for this analysis. It has been seen from the conducted
analysis that if the sales revenue of Farsons is 100% then the cost of revenue is 63% in 2015,
61.29% in 2016, 61.36% in 2017 and 61.05% in 2018. The aim of this vertical analysis is to
ascertain whether or not Farsons Plc. timely pay off their suppliers to advice beer can
manufacturer. The percentage of cost of sales is declining continuously in the case of this
company but it is also a benefit that the percentage of cost of revenue is considerably high that is
average of 62%. Cost of revenue includes the expenses which must be paid off to suppliers
against their supplied goods. This high percentage of supplier cost can be a benefit but also the
declining percentage can result into a limitation. Apart from sale revenue cost, other aspects of
the income statement are sound inclined as the end result of profit is average of 12% that is
continuously rising which says that the company is competent enough to pay their suppliers.
Vertical analysis of Simonds Farsons Cisk plc. (Balance Sheet)
In the case of balance sheet, total assets and liabilities are selected as a base from which
other elements of this financial statement will be compared. It has been seen from the analysis
that this company invests average of 8% against inventory from the total assets which means this
company invests huge amount on the raw material of beer cans that can be considered as an
opportunity for beer can manufacturer to offer them their proposal. To be more accurate, if the
total assets are 100% then the inventory percentage is 6.71% in 2015, 7.36% in 2016, 8.20% in
2017 and 8.64% in 2018. All other elements of balance sheet are effectively inclined against the
total assets and liabilities as the total of retained incomes and other incomes are averagely more
than 60% by which it can be said that this is a profit making company which enables them to pay
off their suppliers on time.
Vertical analysis of Heineken (Income Statement)
In the case of Heineken company analysis, the cost of revenue is observed to be increasing.
From the vertical analysis of income statement, it has been seen that if the sales revenue is 100%
then cost of sales is 47.25% in 2015, 46.64% in 2016, 46.23% in 2017 and 48.71% in 2018.
From this observation, it is analysed that this company is increasing their cost against the
suppliers which is a benefit for beer can manufacturer but even after this increasing trend the
2
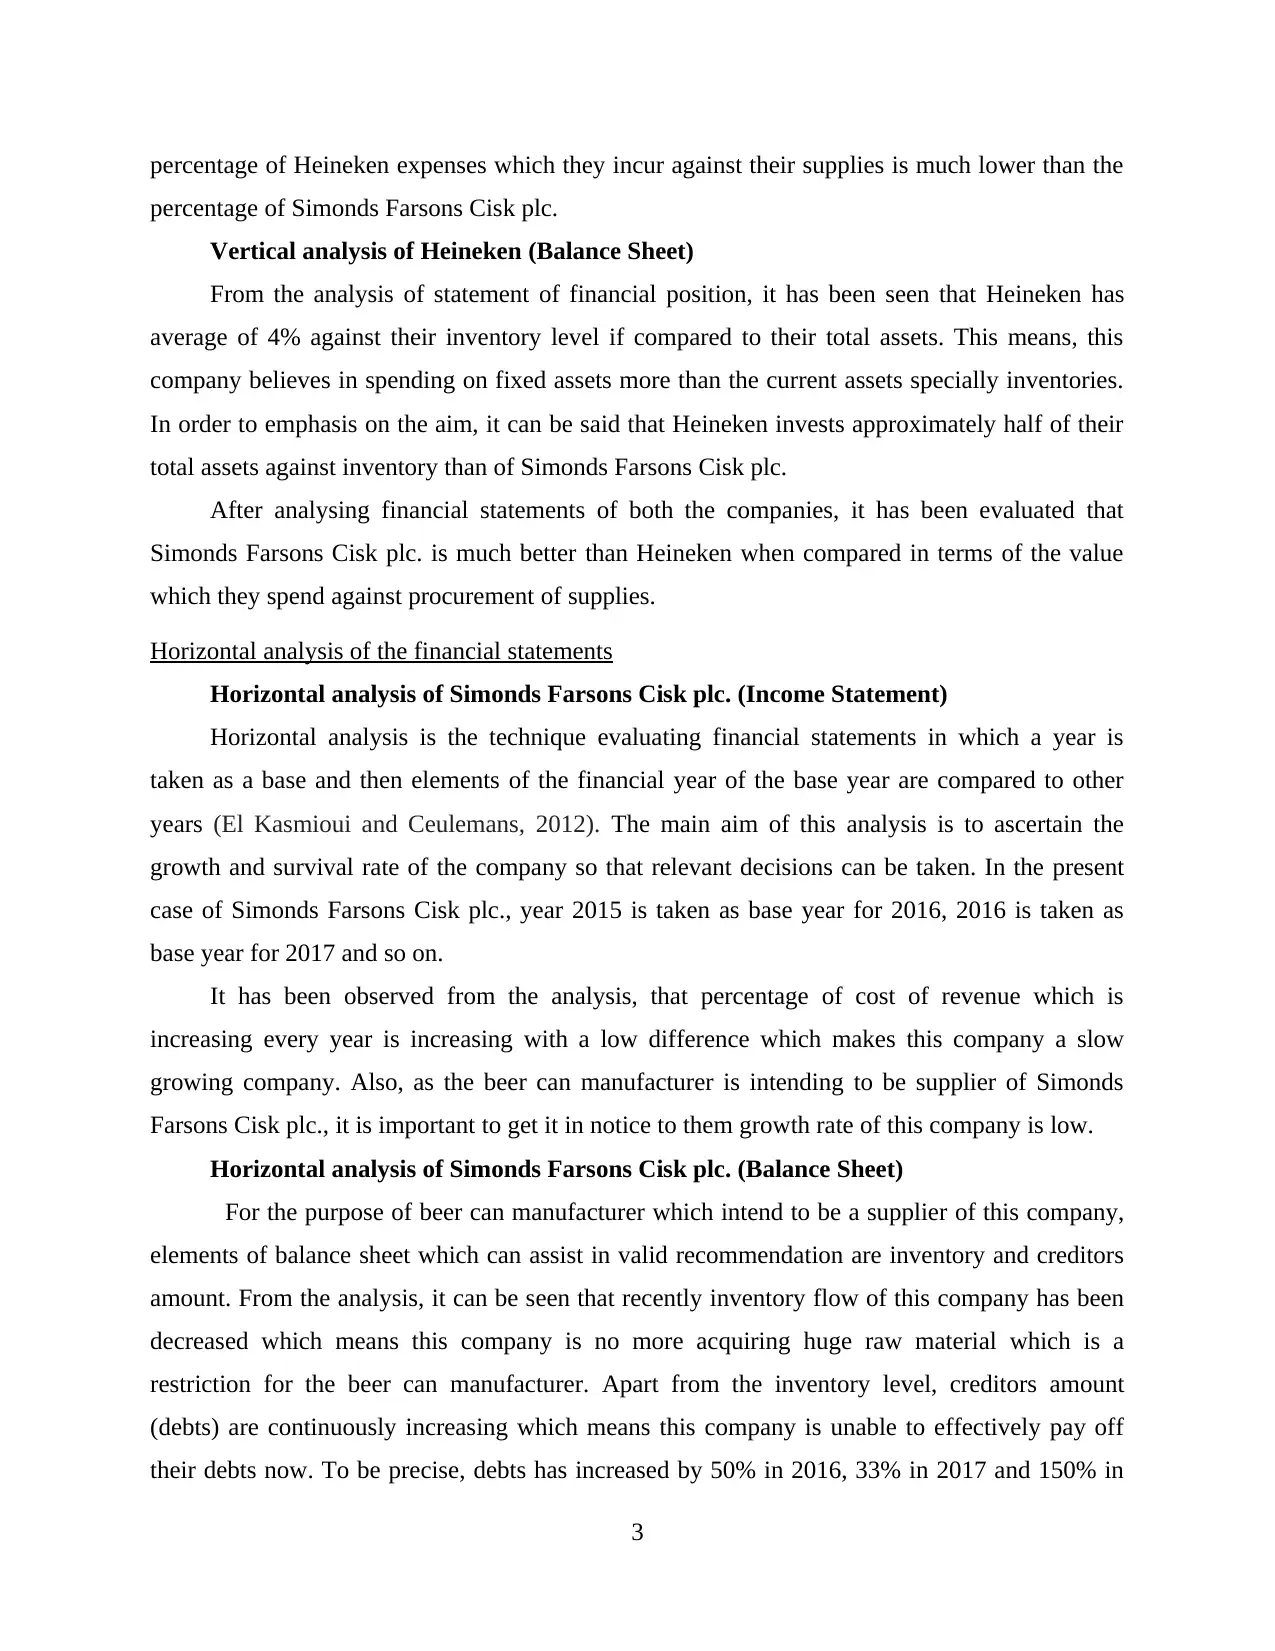
percentage of Heineken expenses which they incur against their supplies is much lower than the
percentage of Simonds Farsons Cisk plc.
Vertical analysis of Heineken (Balance Sheet)
From the analysis of statement of financial position, it has been seen that Heineken has
average of 4% against their inventory level if compared to their total assets. This means, this
company believes in spending on fixed assets more than the current assets specially inventories.
In order to emphasis on the aim, it can be said that Heineken invests approximately half of their
total assets against inventory than of Simonds Farsons Cisk plc.
After analysing financial statements of both the companies, it has been evaluated that
Simonds Farsons Cisk plc. is much better than Heineken when compared in terms of the value
which they spend against procurement of supplies.
Horizontal analysis of the financial statements
Horizontal analysis of Simonds Farsons Cisk plc. (Income Statement)
Horizontal analysis is the technique evaluating financial statements in which a year is
taken as a base and then elements of the financial year of the base year are compared to other
years (El Kasmioui and Ceulemans, 2012). The main aim of this analysis is to ascertain the
growth and survival rate of the company so that relevant decisions can be taken. In the present
case of Simonds Farsons Cisk plc., year 2015 is taken as base year for 2016, 2016 is taken as
base year for 2017 and so on.
It has been observed from the analysis, that percentage of cost of revenue which is
increasing every year is increasing with a low difference which makes this company a slow
growing company. Also, as the beer can manufacturer is intending to be supplier of Simonds
Farsons Cisk plc., it is important to get it in notice to them growth rate of this company is low.
Horizontal analysis of Simonds Farsons Cisk plc. (Balance Sheet)
For the purpose of beer can manufacturer which intend to be a supplier of this company,
elements of balance sheet which can assist in valid recommendation are inventory and creditors
amount. From the analysis, it can be seen that recently inventory flow of this company has been
decreased which means this company is no more acquiring huge raw material which is a
restriction for the beer can manufacturer. Apart from the inventory level, creditors amount
(debts) are continuously increasing which means this company is unable to effectively pay off
their debts now. To be precise, debts has increased by 50% in 2016, 33% in 2017 and 150% in
3
⊘ This is a preview!⊘
Do you want full access?
Subscribe today to unlock all pages.
Trusted by 1+ million students worldwide

2018. Even after this, the suppliers are concerned with the liquidity and debt level in which this
company is seemed to be effective.
Horizontal analysis of Heineken (Income Statement)
Cost of revenue is increasing with a huge rate in case of Heineken as in year 2016 it
increases by 0.01%, 4.40% in 2017 and 8.18% in 2018. These values can support the argument
that when it comes growth and survival Heineken is much more efficient than Simonds Farsons
Cisk plc. The manufacturer of beer can must consider these values as they reflect that Heineken
is continuously improving its supplier policies by which their suppliers get benefitted.
Horizontal analysis of Heineken (Balance Sheet)
In order to emphasising on the aim of assisting beer can manufacturer, suppliers are the
creditors for an organisation and according to the horizontal balance sheet analysis of Heineken,
it has been seen that creditors of this company are continuously decreasing which means this
company believes in quick payment to their suppliers. To provide an exact argument, the
creditors of this company has been decreased from past two years. Debts from creditors are
deceased by 15.36% in year 2017 and by 34.45% in 2018.
From the overall horizontal analysis, it has been observed that Heineken is growing with
rapid pace and is effective in paying their creditors which make it a better company then
Simonds Farsons Cisk plc., in which goods of beer can manufacturer can be supplied. But this
analysis, does not impact the potential of Farsons, as this company is an effective organisation of
being a client of beer can manufacturer.
Ratio analysis of the financial statements
Ratio analysis is a method of getting insights about the operational efficiency and liquidity
of the company (Eng, Lea and Cai, 2014). This assist in the procedure of decision making so that
a calculated decision regarding investment can be made by the stakeholders and potential clients.
Ratio analysis tool is even crucial in this situation as vertical analysis conducted above reflects
efficiency of Farsons Plc. and horizontal analysis shows effectiveness of both the companies
which are Farsons Plc and Heineken.
Ratio analysis in this case is done to observe liquidity, profitability and credibility of both
the companies; so that an informed decision can be made which can assist the potential supplier
of beer can manufacturer (Lee and et.al., 2018). Gross and net profit margin ratio are selected for
analysing profitability and current ratio is calculated for analysing the liquidity.
4
Paraphrase This Document
Need a fresh take? Get an instant paraphrase of this document with our AI Paraphraser
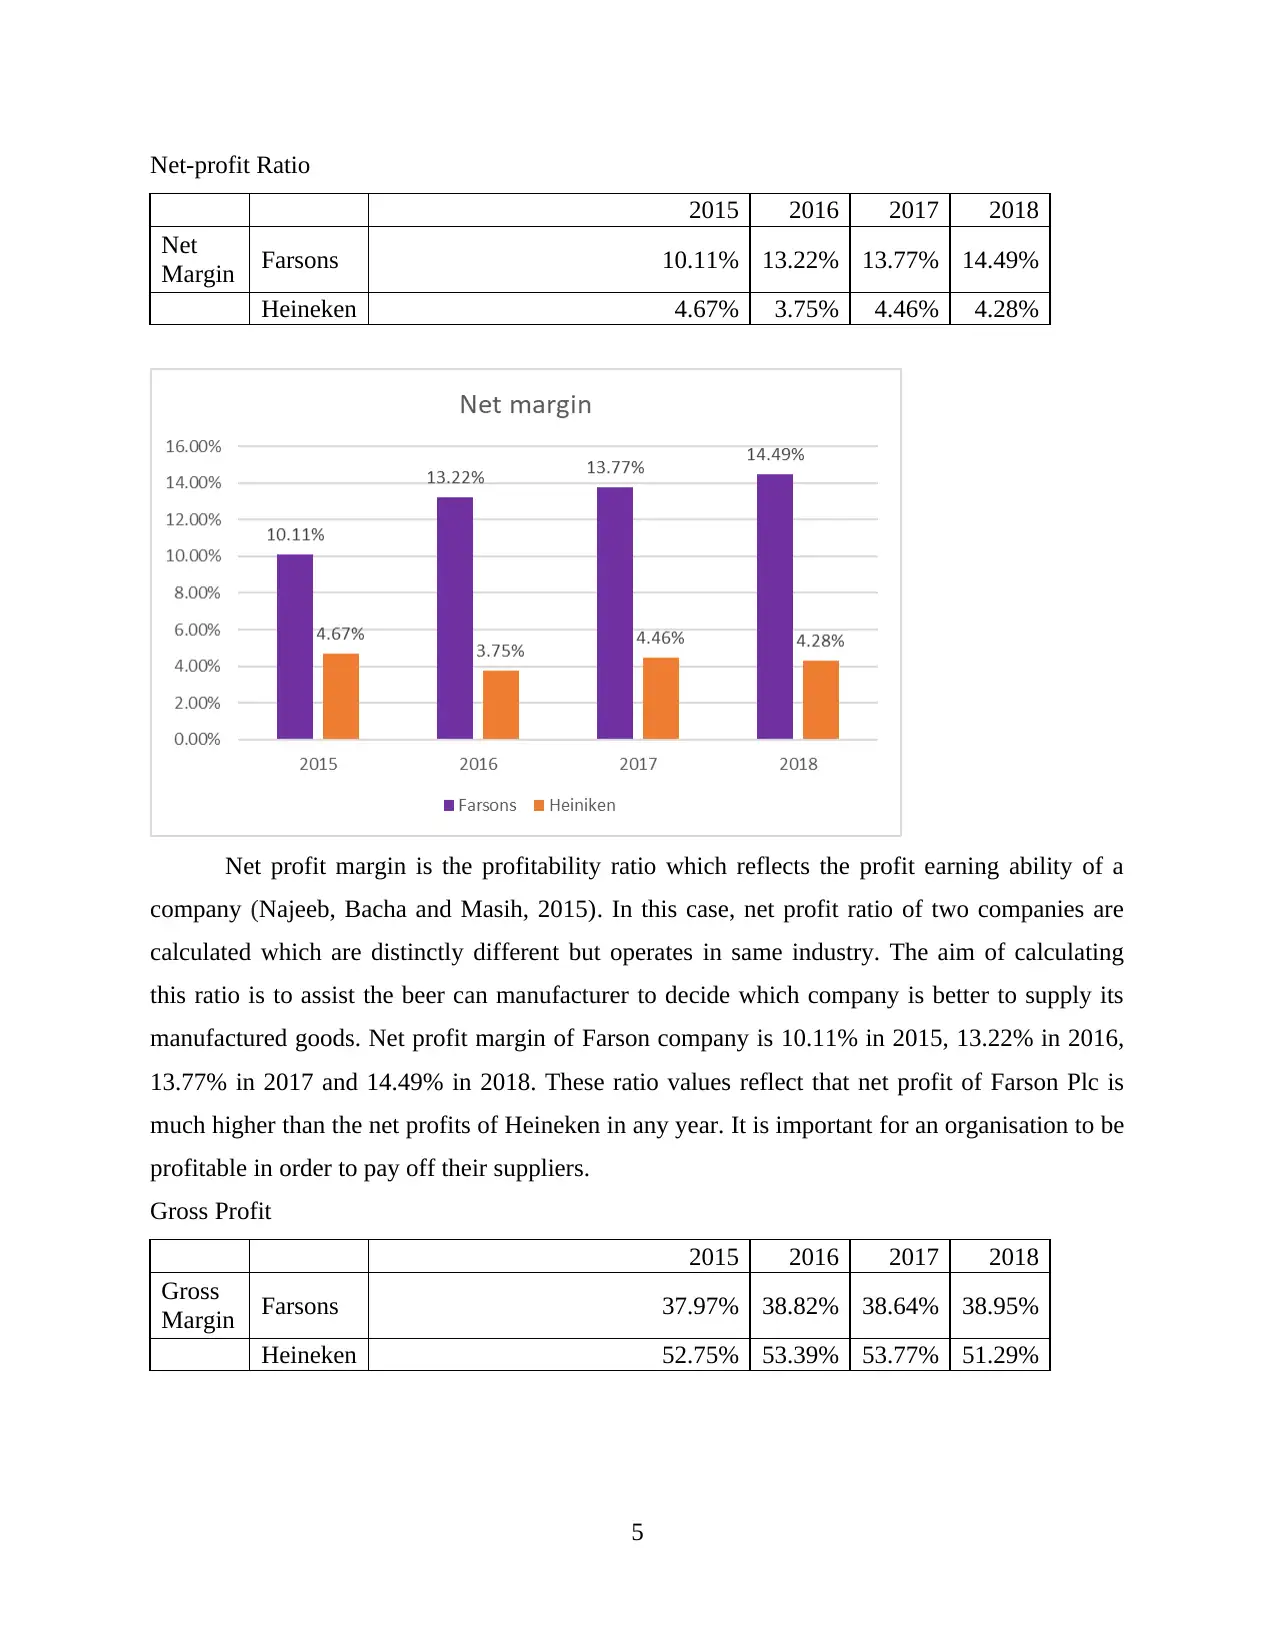
Net-profit Ratio
2015 2016 2017 2018
Net
Margin Farsons 10.11% 13.22% 13.77% 14.49%
Heineken 4.67% 3.75% 4.46% 4.28%
Net profit margin is the profitability ratio which reflects the profit earning ability of a
company (Najeeb, Bacha and Masih, 2015). In this case, net profit ratio of two companies are
calculated which are distinctly different but operates in same industry. The aim of calculating
this ratio is to assist the beer can manufacturer to decide which company is better to supply its
manufactured goods. Net profit margin of Farson company is 10.11% in 2015, 13.22% in 2016,
13.77% in 2017 and 14.49% in 2018. These ratio values reflect that net profit of Farson Plc is
much higher than the net profits of Heineken in any year. It is important for an organisation to be
profitable in order to pay off their suppliers.
Gross Profit
2015 2016 2017 2018
Gross
Margin Farsons 37.97% 38.82% 38.64% 38.95%
Heineken 52.75% 53.39% 53.77% 51.29%
5
2015 2016 2017 2018
Net
Margin Farsons 10.11% 13.22% 13.77% 14.49%
Heineken 4.67% 3.75% 4.46% 4.28%
Net profit margin is the profitability ratio which reflects the profit earning ability of a
company (Najeeb, Bacha and Masih, 2015). In this case, net profit ratio of two companies are
calculated which are distinctly different but operates in same industry. The aim of calculating
this ratio is to assist the beer can manufacturer to decide which company is better to supply its
manufactured goods. Net profit margin of Farson company is 10.11% in 2015, 13.22% in 2016,
13.77% in 2017 and 14.49% in 2018. These ratio values reflect that net profit of Farson Plc is
much higher than the net profits of Heineken in any year. It is important for an organisation to be
profitable in order to pay off their suppliers.
Gross Profit
2015 2016 2017 2018
Gross
Margin Farsons 37.97% 38.82% 38.64% 38.95%
Heineken 52.75% 53.39% 53.77% 51.29%
5
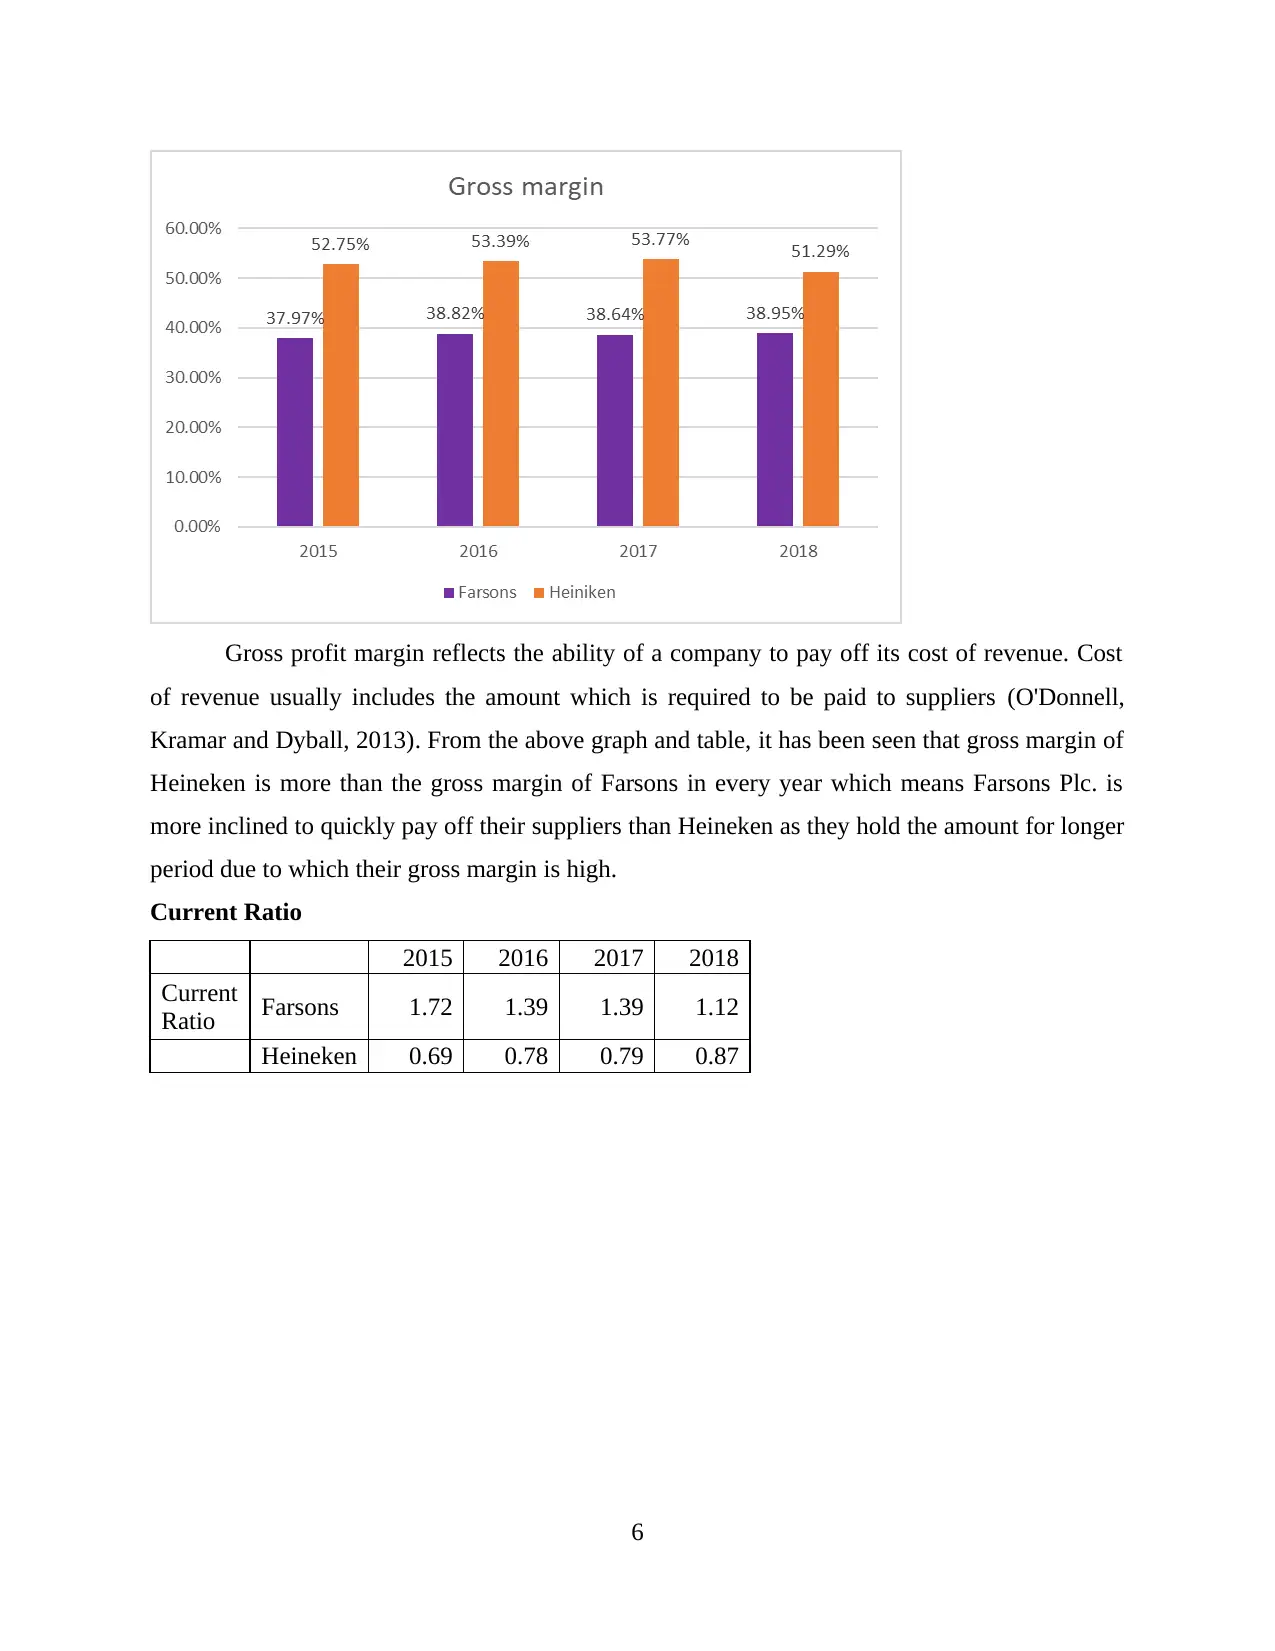
Gross profit margin reflects the ability of a company to pay off its cost of revenue. Cost
of revenue usually includes the amount which is required to be paid to suppliers (O'Donnell,
Kramar and Dyball, 2013). From the above graph and table, it has been seen that gross margin of
Heineken is more than the gross margin of Farsons in every year which means Farsons Plc. is
more inclined to quickly pay off their suppliers than Heineken as they hold the amount for longer
period due to which their gross margin is high.
Current Ratio
2015 2016 2017 2018
Current
Ratio Farsons 1.72 1.39 1.39 1.12
Heineken 0.69 0.78 0.79 0.87
6
⊘ This is a preview!⊘
Do you want full access?
Subscribe today to unlock all pages.
Trusted by 1+ million students worldwide
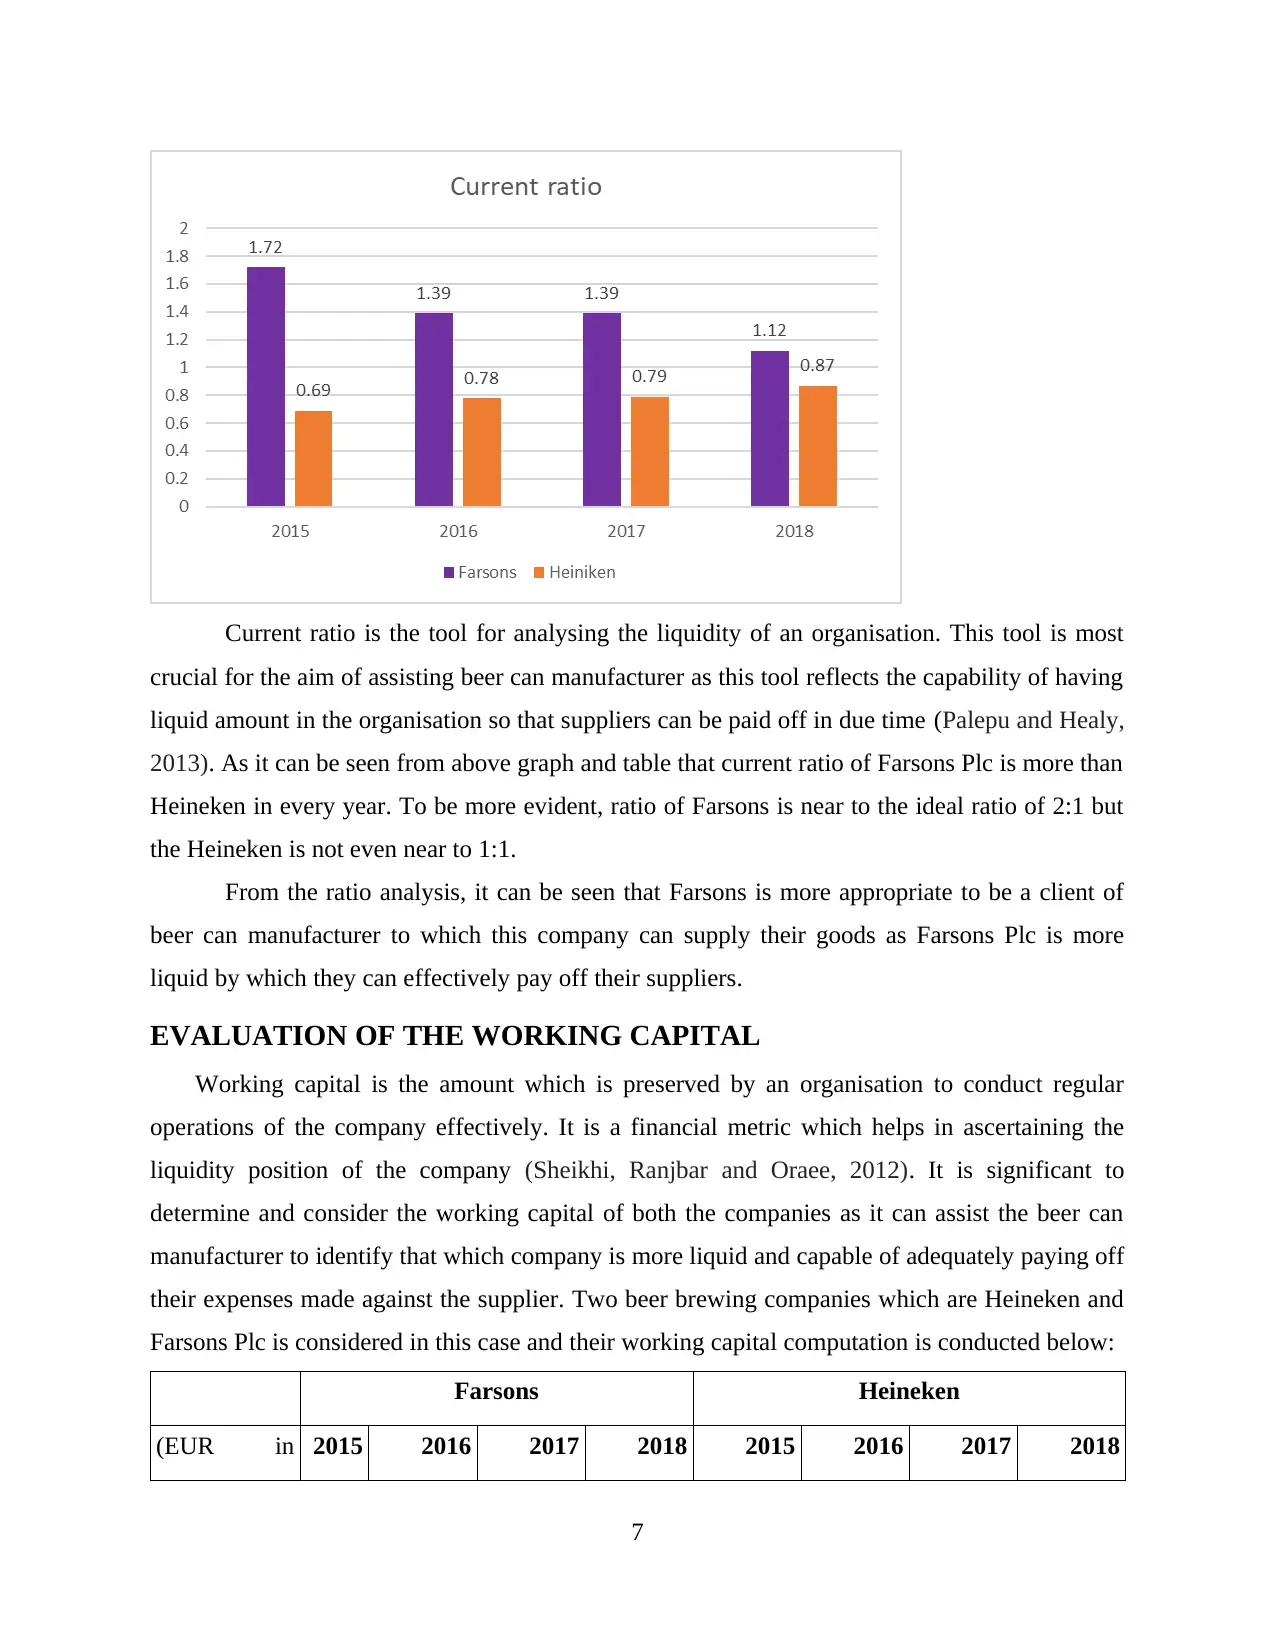
Current ratio is the tool for analysing the liquidity of an organisation. This tool is most
crucial for the aim of assisting beer can manufacturer as this tool reflects the capability of having
liquid amount in the organisation so that suppliers can be paid off in due time (Palepu and Healy,
2013). As it can be seen from above graph and table that current ratio of Farsons Plc is more than
Heineken in every year. To be more evident, ratio of Farsons is near to the ideal ratio of 2:1 but
the Heineken is not even near to 1:1.
From the ratio analysis, it can be seen that Farsons is more appropriate to be a client of
beer can manufacturer to which this company can supply their goods as Farsons Plc is more
liquid by which they can effectively pay off their suppliers.
EVALUATION OF THE WORKING CAPITAL
Working capital is the amount which is preserved by an organisation to conduct regular
operations of the company effectively. It is a financial metric which helps in ascertaining the
liquidity position of the company (Sheikhi, Ranjbar and Oraee, 2012). It is significant to
determine and consider the working capital of both the companies as it can assist the beer can
manufacturer to identify that which company is more liquid and capable of adequately paying off
their expenses made against the supplier. Two beer brewing companies which are Heineken and
Farsons Plc is considered in this case and their working capital computation is conducted below:
Farsons Heineken
(EUR in 2015 2016 2017 2018 2015 2016 2017 2018
7
Paraphrase This Document
Need a fresh take? Get an instant paraphrase of this document with our AI Paraphraser
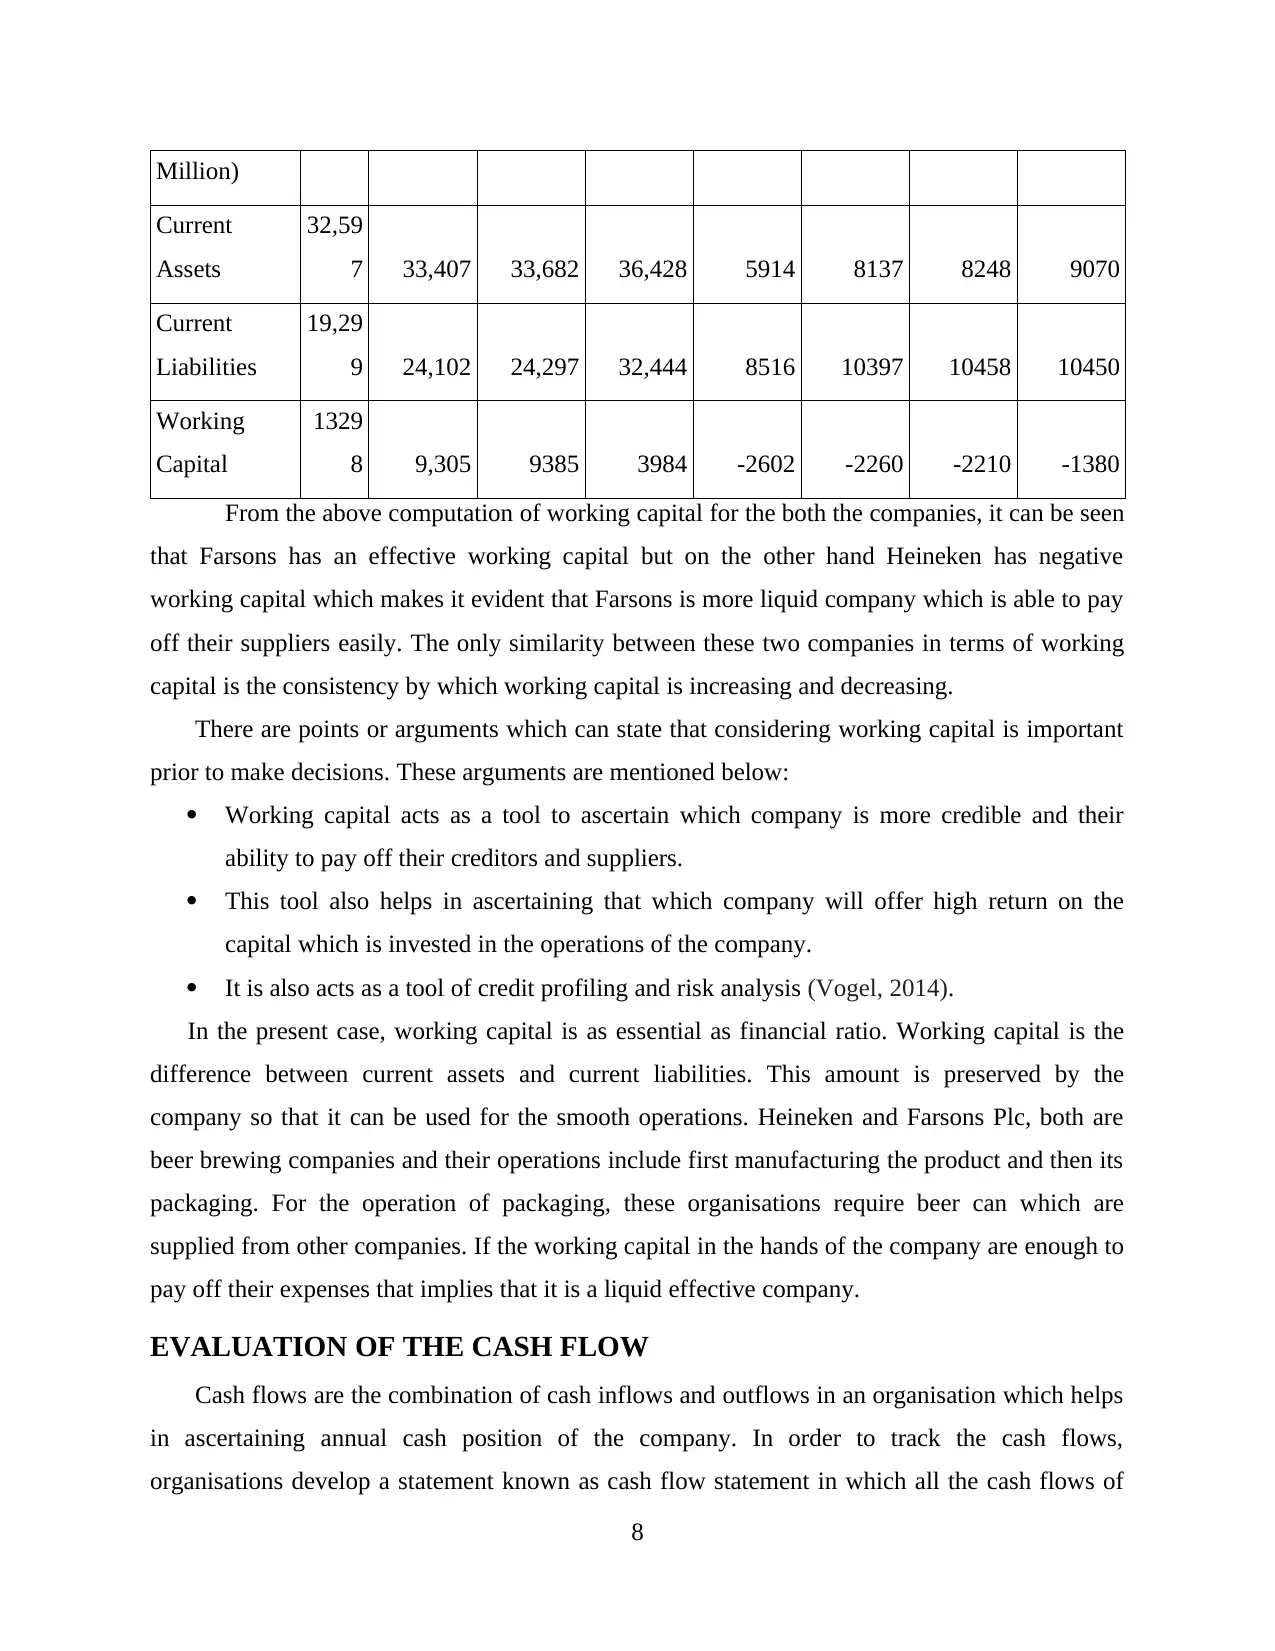
Million)
Current
Assets
32,59
7 33,407 33,682 36,428 5914 8137 8248 9070
Current
Liabilities
19,29
9 24,102 24,297 32,444 8516 10397 10458 10450
Working
Capital
1329
8 9,305 9385 3984 -2602 -2260 -2210 -1380
From the above computation of working capital for the both the companies, it can be seen
that Farsons has an effective working capital but on the other hand Heineken has negative
working capital which makes it evident that Farsons is more liquid company which is able to pay
off their suppliers easily. The only similarity between these two companies in terms of working
capital is the consistency by which working capital is increasing and decreasing.
There are points or arguments which can state that considering working capital is important
prior to make decisions. These arguments are mentioned below:
Working capital acts as a tool to ascertain which company is more credible and their
ability to pay off their creditors and suppliers.
This tool also helps in ascertaining that which company will offer high return on the
capital which is invested in the operations of the company.
It is also acts as a tool of credit profiling and risk analysis (Vogel, 2014).
In the present case, working capital is as essential as financial ratio. Working capital is the
difference between current assets and current liabilities. This amount is preserved by the
company so that it can be used for the smooth operations. Heineken and Farsons Plc, both are
beer brewing companies and their operations include first manufacturing the product and then its
packaging. For the operation of packaging, these organisations require beer can which are
supplied from other companies. If the working capital in the hands of the company are enough to
pay off their expenses that implies that it is a liquid effective company.
EVALUATION OF THE CASH FLOW
Cash flows are the combination of cash inflows and outflows in an organisation which helps
in ascertaining annual cash position of the company. In order to track the cash flows,
organisations develop a statement known as cash flow statement in which all the cash flows of
8
Current
Assets
32,59
7 33,407 33,682 36,428 5914 8137 8248 9070
Current
Liabilities
19,29
9 24,102 24,297 32,444 8516 10397 10458 10450
Working
Capital
1329
8 9,305 9385 3984 -2602 -2260 -2210 -1380
From the above computation of working capital for the both the companies, it can be seen
that Farsons has an effective working capital but on the other hand Heineken has negative
working capital which makes it evident that Farsons is more liquid company which is able to pay
off their suppliers easily. The only similarity between these two companies in terms of working
capital is the consistency by which working capital is increasing and decreasing.
There are points or arguments which can state that considering working capital is important
prior to make decisions. These arguments are mentioned below:
Working capital acts as a tool to ascertain which company is more credible and their
ability to pay off their creditors and suppliers.
This tool also helps in ascertaining that which company will offer high return on the
capital which is invested in the operations of the company.
It is also acts as a tool of credit profiling and risk analysis (Vogel, 2014).
In the present case, working capital is as essential as financial ratio. Working capital is the
difference between current assets and current liabilities. This amount is preserved by the
company so that it can be used for the smooth operations. Heineken and Farsons Plc, both are
beer brewing companies and their operations include first manufacturing the product and then its
packaging. For the operation of packaging, these organisations require beer can which are
supplied from other companies. If the working capital in the hands of the company are enough to
pay off their expenses that implies that it is a liquid effective company.
EVALUATION OF THE CASH FLOW
Cash flows are the combination of cash inflows and outflows in an organisation which helps
in ascertaining annual cash position of the company. In order to track the cash flows,
organisations develop a statement known as cash flow statement in which all the cash flows of
8
the organisations are categorised into three classes which are operating, investing and financing
activities (Williams and Dobelman, 2017). Cash generated from operating activities and net
profit generated from operating activities are only two elements of the cash flow statement which
are relevant with the decisions making of selecting the appropriate company for beer can
manufacturer.
Annual report of Farsons Plc reflects that their cash flows from operating activities are
€22933000 in 2018 and €15513000 in 2017. And net cash generated from operating activities are
€20893000 in 2018 and €13135000. By this, it is evident that Farsons Plc is continuously
growing and their cash flows are increasing year by year. High operating cash flow makes this
company capable to pay off all the creditors, debts and suppliers.
From the annual report of Heineken, it has been seen that operational cash flows for the last
two years i.e., 2017 and 2018 are 3882 million and 4388 million. The amount of cash flows in
this case is high than Farsons Plc but the rate by which these funds are increasing is in the favour
of Farsons Plc.
From the above analysis of cash flows, it is evident that Farsons is a better organisation to be
selected for the purpose of being a client for a beer can manufacturer supplier. Farsons is a not
much involved in activities of marketing due to which brand equity of this company is low but
this element is nothing to do with the credibility of this company. When it comes to liquidity
position and ability to paying the suppliers, Farsons is the right choice.
CONCLUSION AND RECOMMENDATIONS
From the above report, it has been concluded that financial analysis is the procedure of
analysing income statement, balance sheet and cash flow statement so that financial position of
the company can be ascertained in a market. It has been also found that financial analysis is done
for an aim of facilitating in the process of decision making. By conducting financial analysis of
Heineken and Farsons Plc., it has been concluded that Farsons Plc., is a better organisation for
the purpose of being a client of beer can manufacturer supplier. This conclusion is evidently
argument through effective liquidity position and credibility of Farsons Plc. At last, it is
recommended to the beer can manufacturer to select Farsons Plc. as their client and supply goods
to this company.
9
⊘ This is a preview!⊘
Do you want full access?
Subscribe today to unlock all pages.
Trusted by 1+ million students worldwide
1 out of 26
Related Documents


Your All-in-One AI-Powered Toolkit for Academic Success.
+13062052269
info@desklib.com
Available 24*7 on WhatsApp / Email
![[object Object]](/_next/static/media/star-bottom.7253800d.svg)
Unlock your academic potential
Copyright © 2020–2026 A2Z Services. All Rights Reserved. Developed and managed by ZUCOL.